

#sp500topsrecord7800
sp500topsrecord7800
159,091 views
1,879 Discussing
Hot
Latest

·
--
#sp500topsrecord7800
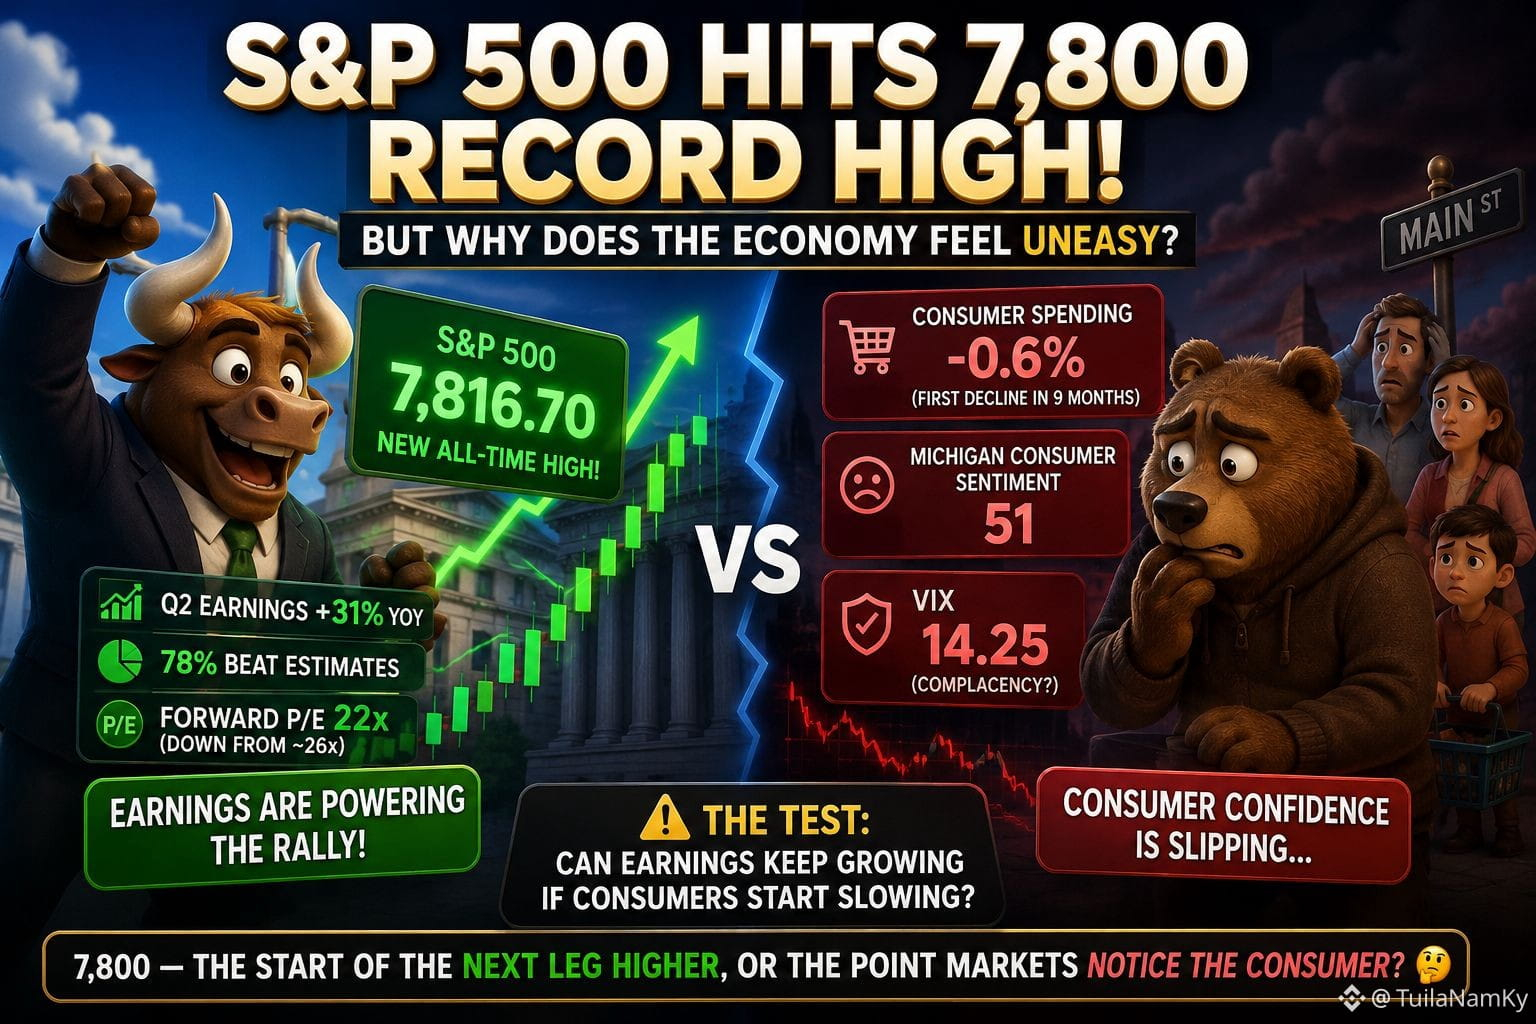
S&P 500 just broke 7,800 for the first time.
So why does the economy underneath it look less comfortable? 👀
The bull case is real:
📈 7,816.70 intraday high
💰 Q2 earnings +31% YoY
🚀 78% of companies beat estimates
📊 Forward P/E fell from ~26x to ~22x
That last number matters. Stocks have risen, but earnings have risen even faster.
Then comes the contradiction.
Consumer spending just fell 0.6% — its first decline in 9 months — while Michigan consumer sentiment dropped to 51.
And VIX is sitting at just 14.25.
Markets are pricing confidence. Consumers may be telling a different story.
That doesn't automatically make SPX bearish.
It creates a test:
Can corporate earnings keep accelerating if the consumer starts slowing?
If this risk-off divergence eventually spreads across markets, risk assets like BTC could feel the macro impact too.
The bull case is strong.
But is 7,800 the start of the next leg higher — or the point where markets finally notice the consumer? 🤔
#SP500 $SPX $BTC
{future}(BTCUSDT)
{future}(SPXUSDT)
#sp500topsrecord7800
S&P 500 just broke 7,800 for the first time.
So why does the economy underneath it look less comfortable? 👀
The bull case is real:
📈 7,816.70 intraday high
💰 Q2 earnings +31% YoY
🚀 78% of companies beat estimates
📊 Forward P/E fell from ~26x to ~22x
That last number matters. Stocks have risen, but earnings have risen even faster.
Then comes the contradiction.
Consumer spending just fell 0.6% — its first decline in 9 months — while Michigan consumer sentiment dropped to 51.
And VIX is sitting at just 14.25.
Markets are pricing confidence. Consumers may be telling a different story.
That doesn't automatically make SPX bearish.
It creates a test:
Can corporate earnings keep accelerating if the consumer starts slowing?
If this risk-off divergence eventually spreads across markets, risk assets like BTC could feel the macro impact too.
The bull case is strong.
But is 7,800 the start of the next leg higher — or the point where markets finally notice the consumer? 🤔
#SP500 $SPX $BTC
S&P 500 just broke 7,800 for the first time.
So why does the economy underneath it look less comfortable? 👀
The bull case is real:
📈 7,816.70 intraday high
💰 Q2 earnings +31% YoY
🚀 78% of companies beat estimates
📊 Forward P/E fell from ~26x to ~22x
That last number matters. Stocks have risen, but earnings have risen even faster.
Then comes the contradiction.
Consumer spending just fell 0.6% — its first decline in 9 months — while Michigan consumer sentiment dropped to 51.
And VIX is sitting at just 14.25.
Markets are pricing confidence. Consumers may be telling a different story.
That doesn't automatically make SPX bearish.
It creates a test:
Can corporate earnings keep accelerating if the consumer starts slowing?
If this risk-off divergence eventually spreads across markets, risk assets like BTC could feel the macro impact too.
The bull case is strong.
But is 7,800 the start of the next leg higher — or the point where markets finally notice the consumer? 🤔
#SP500 $SPX $BTC
467

🏆📊 Wall Street Hits Another Milestone
The S&P 500 has crossed another major psychological level, topping 7,800 after reaching 7,816.70 intraday. The latest record came as investors responded positively to stable July producer prices and continued optimism around corporate earnings and AI-related growth.
Digital assets such as $BTC, $SOL and $BNB remain part of the broader risk-asset landscape, but their performance can differ sharply from equities.
#sp500topsrecord7800
🏆📊 Wall Street Hits Another Milestone
The S&P 500 has crossed another major psychological level, topping 7,800 after reaching 7,816.70 intraday. The latest record came as investors responded positively to stable July producer prices and continued optimism around corporate earnings and AI-related growth.
Digital assets such as $BTC, $SOL and $BNB remain part of the broader risk-asset landscape, but their performance can differ sharply from equities.
#sp500topsrecord7800
The S&P 500 has crossed another major psychological level, topping 7,800 after reaching 7,816.70 intraday. The latest record came as investors responded positively to stable July producer prices and continued optimism around corporate earnings and AI-related growth.
Digital assets such as $BTC, $SOL and $BNB remain part of the broader risk-asset landscape, but their performance can differ sharply from equities.
#sp500topsrecord7800
1
23
👀 WALL STREET AT RECORDS — BUT DON’T IGNORE THE WARNING SIGNS
The S&P 500 reached a record high above 7,800, but the rally is facing mixed signals.
✅ Strong corporate earnings
✅ AI optimism
✅ Easing rate-hike fears
⚠️ Softer consumer data
⚠️ Higher oil prices
⚠️ Geopolitical uncertainty
The index later slipped 0.17% to 7,785.76 on August 14 as investors weighed weaker retail data and Middle East tensions.
That combination could keep volatility elevated.
For spot-market watchers, $BTC, $ETH and $BNB remain worth monitoring as global risk appetite shifts.
#sp500topsrecord7800
👀 WALL STREET AT RECORDS — BUT DON’T IGNORE THE WARNING SIGNS
The S&P 500 reached a record high above 7,800, but the rally is facing mixed signals.
✅ Strong corporate earnings
✅ AI optimism
✅ Easing rate-hike fears
⚠️ Softer consumer data
⚠️ Higher oil prices
⚠️ Geopolitical uncertainty
The index later slipped 0.17% to 7,785.76 on August 14 as investors weighed weaker retail data and Middle East tensions.
That combination could keep volatility elevated.
For spot-market watchers, $BTC, $ETH and $BNB remain worth monitoring as global risk appetite shifts.
#sp500topsrecord7800
The S&P 500 reached a record high above 7,800, but the rally is facing mixed signals.
✅ Strong corporate earnings
✅ AI optimism
✅ Easing rate-hike fears
⚠️ Softer consumer data
⚠️ Higher oil prices
⚠️ Geopolitical uncertainty
The index later slipped 0.17% to 7,785.76 on August 14 as investors weighed weaker retail data and Middle East tensions.
That combination could keep volatility elevated.
For spot-market watchers, $BTC, $ETH and $BNB remain worth monitoring as global risk appetite shifts.
#sp500topsrecord7800
102

·
--
#sp500topsrecord7800 The stock market just hit a massive milestone. The S&P 500 crossed the 7,800 mark for the first time, driven by strong company profits and lower inflation fears. Even though prices are at an all-time high, many experts feel positive about future economic growth. However, some people worry that everyday shoppers are starting to spend less. It is always smart to stay careful and look at both the good signs and the risks before making any big investment choices.
CLICK BELOW TO TRADE : $BTC $SOL $CL
{future}(CLUSDT)
{future}(SOLUSDT)
{future}(BTCUSDT)
#sp500topsrecord7800 The stock market just hit a massive milestone. The S&P 500 crossed the 7,800 mark for the first time, driven by strong company profits and lower inflation fears. Even though prices are at an all-time high, many experts feel positive about future economic growth. However, some people worry that everyday shoppers are starting to spend less. It is always smart to stay careful and look at both the good signs and the risks before making any big investment choices.
CLICK BELOW TO TRADE : $BTC $SOL $CL
CLICK BELOW TO TRADE : $BTC $SOL $CL
198
📈🚀 S&P 500 Breaks Into Record Territory
The S&P 500 pushed above 7,800 for the first time, reaching an intraday record around 7,816.70 before closing at 7,798.99 on August 13. Softer U.S. producer-price data helped ease concerns about near-term rate increases, while technology shares added momentum.
For spot-focused crypto investors, the move is another important signal to watch alongside $BTC, $ETH and $BNB.
#sp500topsrecord7800
📈🚀 S&P 500 Breaks Into Record Territory
The S&P 500 pushed above 7,800 for the first time, reaching an intraday record around 7,816.70 before closing at 7,798.99 on August 13. Softer U.S. producer-price data helped ease concerns about near-term rate increases, while technology shares added momentum.
For spot-focused crypto investors, the move is another important signal to watch alongside $BTC, $ETH and $BNB.
#sp500topsrecord7800
The S&P 500 pushed above 7,800 for the first time, reaching an intraday record around 7,816.70 before closing at 7,798.99 on August 13. Softer U.S. producer-price data helped ease concerns about near-term rate increases, while technology shares added momentum.
For spot-focused crypto investors, the move is another important signal to watch alongside $BTC, $ETH and $BNB.
#sp500topsrecord7800
19
💰 THE $7,800 S&P 500 LEVEL COULD BECOME A MARKET BATTLEGROUND
The S&P 500 has entered unprecedented territory, closing at a record 7,798.99 on August 13 after briefly trading above 7,800.
Now the key battle is between momentum and valuation.
If earnings continue delivering and rate fears remain contained, buyers may keep supporting stocks. But weaker economic data or renewed inflation pressure could test this record-setting rally.
That could spill into broader risk assets, including $BTC, $ETH and $BNB.
Record highs create opportunity—but they also demand discipline. 📈⚠️
#sp500topsrecord7800
💰 THE $7,800 S&P 500 LEVEL COULD BECOME A MARKET BATTLEGROUND
The S&P 500 has entered unprecedented territory, closing at a record 7,798.99 on August 13 after briefly trading above 7,800.
Now the key battle is between momentum and valuation.
If earnings continue delivering and rate fears remain contained, buyers may keep supporting stocks. But weaker economic data or renewed inflation pressure could test this record-setting rally.
That could spill into broader risk assets, including $BTC, $ETH and $BNB.
Record highs create opportunity—but they also demand discipline. 📈⚠️
#sp500topsrecord7800
The S&P 500 has entered unprecedented territory, closing at a record 7,798.99 on August 13 after briefly trading above 7,800.
Now the key battle is between momentum and valuation.
If earnings continue delivering and rate fears remain contained, buyers may keep supporting stocks. But weaker economic data or renewed inflation pressure could test this record-setting rally.
That could spill into broader risk assets, including $BTC, $ETH and $BNB.
Record highs create opportunity—but they also demand discipline. 📈⚠️
#sp500topsrecord7800
1
487

Partly True
#sp500topsrecord7800
🚨 7,800 just happened... the S&P 500 has entered new record territory. 📈🔥
The S&P 500 has officially pushed above 7,800, marking another powerful milestone for the U.S. stock market. 👀
This move puts the index deeper into record territory as buying momentum continues to push prices higher.
📊 Here’s what stands out:
- 7,800 has been reached — another major psychological level for the index.
- Momentum remains strong — the S&P 500 continues to push higher instead of giving back its recent gains.
- Record levels keep attracting attention — every new high puts the next milestone directly in focus.
The market has now crossed another major barrier.
And the bigger the index climbs, the more important each new level becomes.
7,800 is no longer a target. It is now history.
The focus has shifted to what comes next as the S&P 500 continues trading at record levels. 👀
💬 How far can the S&P 500 go from here?
#WallStreet #Write2Earn #BullMarket #cryptotrading
$ONG
{spot}(ONGUSDT)
$BTC
{spot}(BTCUSDT)
$PORTAL
{spot}(PORTALUSDT)
#sp500topsrecord7800
🚨 7,800 just happened... the S&P 500 has entered new record territory. 📈🔥
The S&P 500 has officially pushed above 7,800, marking another powerful milestone for the U.S. stock market. 👀
This move puts the index deeper into record territory as buying momentum continues to push prices higher.
📊 Here’s what stands out:
- 7,800 has been reached — another major psychological level for the index.
- Momentum remains strong — the S&P 500 continues to push higher instead of giving back its recent gains.
- Record levels keep attracting attention — every new high puts the next milestone directly in focus.
The market has now crossed another major barrier.
And the bigger the index climbs, the more important each new level becomes.
7,800 is no longer a target. It is now history.
The focus has shifted to what comes next as the S&P 500 continues trading at record levels. 👀
💬 How far can the S&P 500 go from here?
#WallStreet #Write2Earn #BullMarket #cryptotrading
$ONG
$BTC
$PORTAL
🚨 7,800 just happened... the S&P 500 has entered new record territory. 📈🔥
The S&P 500 has officially pushed above 7,800, marking another powerful milestone for the U.S. stock market. 👀
This move puts the index deeper into record territory as buying momentum continues to push prices higher.
📊 Here’s what stands out:
- 7,800 has been reached — another major psychological level for the index.
- Momentum remains strong — the S&P 500 continues to push higher instead of giving back its recent gains.
- Record levels keep attracting attention — every new high puts the next milestone directly in focus.
The market has now crossed another major barrier.
And the bigger the index climbs, the more important each new level becomes.
7,800 is no longer a target. It is now history.
The focus has shifted to what comes next as the S&P 500 continues trading at record levels. 👀
💬 How far can the S&P 500 go from here?
#WallStreet #Write2Earn #BullMarket #cryptotrading
$ONG
$BTC
$PORTAL
3
3
5.5k

#SP500TopsRecord7800
The S&P 500 has shattered records by hitting an all-time intraday high of 7,816.70 and securing its first-ever weekly close near the threshold at 7,798.99, driving the total index valuation to a historic $70.8 trillion. This rapid surge caught Wall Street by surprise, crossing from 7,700 to 7,800 in just seven trading sessions and effectively hitting analysts' "blue sky" year-end targets in the third quarter of 2026.While market momentum remains strong, single-asset or hyper-concentrated index investing carries macro risks; a sudden shift in monetary policy or a sharp economic downturn could trigger severe profit-taking, exposing unprepared investors to significant capital losses. Evaluating this milestone requires looking at both the underlying drivers and the structural economic friction threatening to slow it down.$AAPLB $BNB
#SP500TopsRecord7800
The S&P 500 has shattered records by hitting an all-time intraday high of 7,816.70 and securing its first-ever weekly close near the threshold at 7,798.99, driving the total index valuation to a historic $70.8 trillion. This rapid surge caught Wall Street by surprise, crossing from 7,700 to 7,800 in just seven trading sessions and effectively hitting analysts' "blue sky" year-end targets in the third quarter of 2026.While market momentum remains strong, single-asset or hyper-concentrated index investing carries macro risks; a sudden shift in monetary policy or a sharp economic downturn could trigger severe profit-taking, exposing unprepared investors to significant capital losses. Evaluating this milestone requires looking at both the underlying drivers and the structural economic friction threatening to slow it down.$AAPLB $BNB
The S&P 500 has shattered records by hitting an all-time intraday high of 7,816.70 and securing its first-ever weekly close near the threshold at 7,798.99, driving the total index valuation to a historic $70.8 trillion. This rapid surge caught Wall Street by surprise, crossing from 7,700 to 7,800 in just seven trading sessions and effectively hitting analysts' "blue sky" year-end targets in the third quarter of 2026.While market momentum remains strong, single-asset or hyper-concentrated index investing carries macro risks; a sudden shift in monetary policy or a sharp economic downturn could trigger severe profit-taking, exposing unprepared investors to significant capital losses. Evaluating this milestone requires looking at both the underlying drivers and the structural economic friction threatening to slow it down.$AAPLB $BNB
44
🧭📈 7,800 Becomes the New Market Landmark
The S&P 500 moved above 7,800 only seven days after crossing 7,700, highlighting how quickly the latest advance has developed. It ultimately finished Thursday at a record 7,798.99, just below the milestone at the close.
That pace makes disciplined risk management especially important for investors following both equities and spot crypto such as $BTC, $BNB and $ETH.
#sp500topsrecord7800
🧭📈 7,800 Becomes the New Market Landmark
The S&P 500 moved above 7,800 only seven days after crossing 7,700, highlighting how quickly the latest advance has developed. It ultimately finished Thursday at a record 7,798.99, just below the milestone at the close.
That pace makes disciplined risk management especially important for investors following both equities and spot crypto such as $BTC, $BNB and $ETH.
#sp500topsrecord7800
The S&P 500 moved above 7,800 only seven days after crossing 7,700, highlighting how quickly the latest advance has developed. It ultimately finished Thursday at a record 7,798.99, just below the milestone at the close.
That pace makes disciplined risk management especially important for investors following both equities and spot crypto such as $BTC, $BNB and $ETH.
#sp500topsrecord7800
45
🚀📈 7,800 Is Here — Wall Street Just Hit Another Milestone!
The S&P 500 briefly broke 7,800 for the first time before closing at a record 7,798.99. 🔥
Strong earnings + cooler producer inflation helped push investors further into risk assets.
Now the bigger question is whether earnings can keep supporting these valuations. 👀
For spot investors, $BTC, $BNB and $ETH are also worth watching as broader risk appetite remains strong.
#sp500topsrecord7800
🚀📈 7,800 Is Here — Wall Street Just Hit Another Milestone!
The S&P 500 briefly broke 7,800 for the first time before closing at a record 7,798.99. 🔥
Strong earnings + cooler producer inflation helped push investors further into risk assets.
Now the bigger question is whether earnings can keep supporting these valuations. 👀
For spot investors, $BTC, $BNB and $ETH are also worth watching as broader risk appetite remains strong.
#sp500topsrecord7800
The S&P 500 briefly broke 7,800 for the first time before closing at a record 7,798.99. 🔥
Strong earnings + cooler producer inflation helped push investors further into risk assets.
Now the bigger question is whether earnings can keep supporting these valuations. 👀
For spot investors, $BTC, $BNB and $ETH are also worth watching as broader risk appetite remains strong.
#sp500topsrecord7800
58

#SP500TopsRecord7800
#SP500TopsRecord7800
Title: S&P 500 Tops Record 7,800
The S&P 500 has climbed above the 7,800 level to reach a new record high, reflecting strong investor confidence and continued optimism across U.S. markets.
The milestone highlights the ongoing strength of equities as investors monitor economic growth, corporate earnings, and expectations for monetary policy.
#SP500TopsRecord7800
#SP500TopsRecord7800
#SP500TopsRecord7800
Title: S&P 500 Tops Record 7,800
The S&P 500 has climbed above the 7,800 level to reach a new record high, reflecting strong investor confidence and continued optimism across U.S. markets.
The milestone highlights the ongoing strength of equities as investors monitor economic growth, corporate earnings, and expectations for monetary policy.
#SP500TopsRecord7800
#SP500TopsRecord7800
Title: S&P 500 Tops Record 7,800
The S&P 500 has climbed above the 7,800 level to reach a new record high, reflecting strong investor confidence and continued optimism across U.S. markets.
The milestone highlights the ongoing strength of equities as investors monitor economic growth, corporate earnings, and expectations for monetary policy.
#SP500TopsRecord7800
75

The S&P 500 has just broken above the 7,800-point level for the first time in history, setting a new record while Bitcoin moves sideways in the 63K area. Why does this matter in crypto?
When traditional indexes break historical highs, venture capital tends to stay in stocks before moving into more volatile assets like Bitcoin. The S&P 500 has come from beating corporate earnings expectations, reinforcing the “risk-on” narrative in traditional markets, but it may delay the flow into crypto.
The correlation between the S&P 500 and Bitcoin has been positive over the past few months, but with a lag: when the S&P rises, Bitcoin usually follows days or weeks later, as long as the macro context allows it. The detail is that today the crypto Fear Index fell to 31 (a fear zone), while the S&P is breaking records. This divergence suggests that capital is choosing stocks over crypto in the short term.
Does this mean Bitcoin won’t go up? No. It means it first needs risk to migrate from stocks to alternative assets, which usually happens when indexes consolidate or when a strong crypto catalyst appears (ETF approvals, halving, favorable regulation).
Meanwhile, Bitcoin is trading between 62.7K and 63.9K, without defining a clear structure. The question is: is the S&P 500 record the ceiling before a correction drags Bitcoin down, or is it the floor before capital rotates into crypto?
Do you think Bitcoin will follow the S&P higher or will it decouple? Leave your take in the comments.
#SP500TopsRecord7800
The S&P 500 has just broken above the 7,800-point level for the first time in history, setting a new record while Bitcoin moves sideways in the 63K area. Why does this matter in crypto?
When traditional indexes break historical highs, venture capital tends to stay in stocks before moving into more volatile assets like Bitcoin. The S&P 500 has come from beating corporate earnings expectations, reinforcing the “risk-on” narrative in traditional markets, but it may delay the flow into crypto.
The correlation between the S&P 500 and Bitcoin has been positive over the past few months, but with a lag: when the S&P rises, Bitcoin usually follows days or weeks later, as long as the macro context allows it. The detail is that today the crypto Fear Index fell to 31 (a fear zone), while the S&P is breaking records. This divergence suggests that capital is choosing stocks over crypto in the short term.
Does this mean Bitcoin won’t go up? No. It means it first needs risk to migrate from stocks to alternative assets, which usually happens when indexes consolidate or when a strong crypto catalyst appears (ETF approvals, halving, favorable regulation).
Meanwhile, Bitcoin is trading between 62.7K and 63.9K, without defining a clear structure. The question is: is the S&P 500 record the ceiling before a correction drags Bitcoin down, or is it the floor before capital rotates into crypto?
Do you think Bitcoin will follow the S&P higher or will it decouple? Leave your take in the comments.
#SP500TopsRecord7800
When traditional indexes break historical highs, venture capital tends to stay in stocks before moving into more volatile assets like Bitcoin. The S&P 500 has come from beating corporate earnings expectations, reinforcing the “risk-on” narrative in traditional markets, but it may delay the flow into crypto.
The correlation between the S&P 500 and Bitcoin has been positive over the past few months, but with a lag: when the S&P rises, Bitcoin usually follows days or weeks later, as long as the macro context allows it. The detail is that today the crypto Fear Index fell to 31 (a fear zone), while the S&P is breaking records. This divergence suggests that capital is choosing stocks over crypto in the short term.
Does this mean Bitcoin won’t go up? No. It means it first needs risk to migrate from stocks to alternative assets, which usually happens when indexes consolidate or when a strong crypto catalyst appears (ETF approvals, halving, favorable regulation).
Meanwhile, Bitcoin is trading between 62.7K and 63.9K, without defining a clear structure. The question is: is the S&P 500 record the ceiling before a correction drags Bitcoin down, or is it the floor before capital rotates into crypto?
Do you think Bitcoin will follow the S&P higher or will it decouple? Leave your take in the comments.
#SP500TopsRecord7800
115

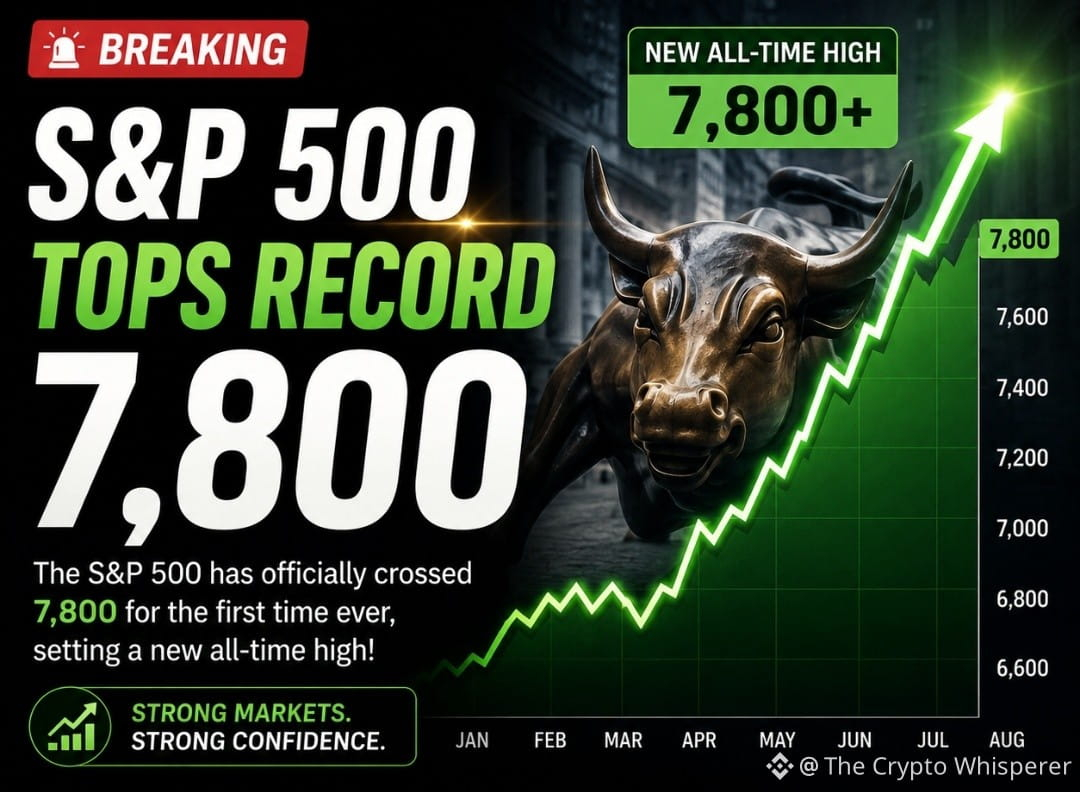
🚨BREAKING:
The S&P 500 has topped 7,800 for the first time, marking another record milestone for U.S. equities.
Risk appetite remains strong as investors continue pushing stocks into uncharted territory.
The big question now: can the rally keep extending, or is a major pullback approaching?
#SP500 #Stocks #Market
$BTC $SPX
{future}(SPXUSDT)
{spot}(BTCUSDT)
#SP500TopsRecord7800
🚨BREAKING:
The S&P 500 has topped 7,800 for the first time, marking another record milestone for U.S. equities.
Risk appetite remains strong as investors continue pushing stocks into uncharted territory.
The big question now: can the rally keep extending, or is a major pullback approaching?
#SP500 #Stocks #Market
$BTC $SPX
#SP500TopsRecord7800
The S&P 500 has topped 7,800 for the first time, marking another record milestone for U.S. equities.
Risk appetite remains strong as investors continue pushing stocks into uncharted territory.
The big question now: can the rally keep extending, or is a major pullback approaching?
#SP500 #Stocks #Market
$BTC $SPX
#SP500TopsRecord7800
61
·
--
Verified
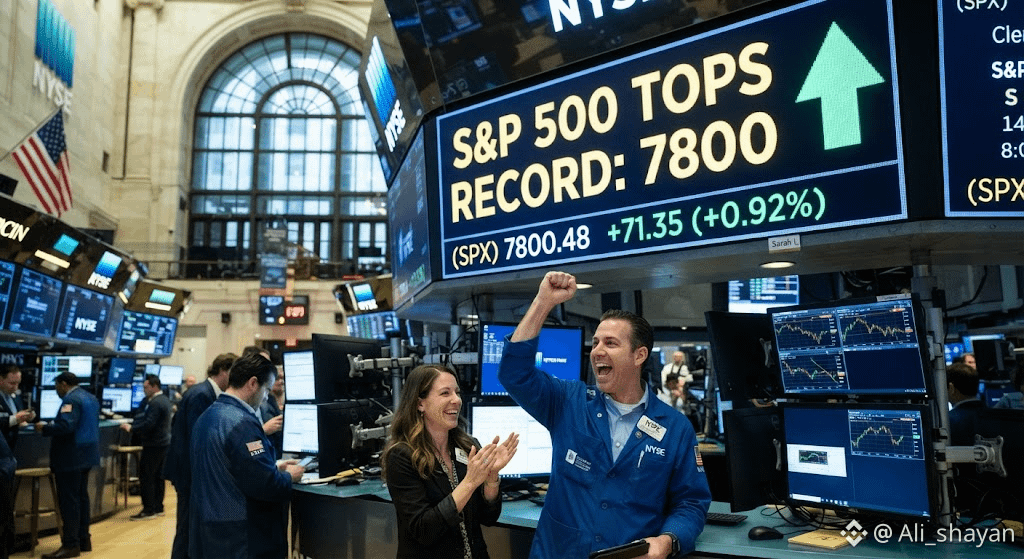
#sp500topsrecord7800 Big news for the stock market today! The S&P 500 has officially crossed the 7,800 mark to hit a brand new all-time high.
This exciting jump comes after recent reports showed inflation is cooling down, giving investors high hopes that interest rates might soon drop. Strong company earnings and a big bounce back in tech shares are also helping push stock prices higher. Wall Street is celebrating this major milestone as the market keeps on growing.
CLICK BELOW TO TRADE : $BTC $ETH $ONDO
{future}(ONDOUSDT)
{future}(ETHUSDT)
{future}(BTCUSDT)
#sp500topsrecord7800 Big news for the stock market today! The S&P 500 has officially crossed the 7,800 mark to hit a brand new all-time high.
This exciting jump comes after recent reports showed inflation is cooling down, giving investors high hopes that interest rates might soon drop. Strong company earnings and a big bounce back in tech shares are also helping push stock prices higher. Wall Street is celebrating this major milestone as the market keeps on growing.
CLICK BELOW TO TRADE : $BTC $ETH $ONDO
This exciting jump comes after recent reports showed inflation is cooling down, giving investors high hopes that interest rates might soon drop. Strong company earnings and a big bounce back in tech shares are also helping push stock prices higher. Wall Street is celebrating this major milestone as the market keeps on growing.
CLICK BELOW TO TRADE : $BTC $ETH $ONDO
2.1k

·
--
Partly True
#sp500topsrecord7800
S&P 500 just broke above the historic 7,800 level! 📈🔥
A fresh all-time high shows that bullish momentum is still strong. Now that 7,800 has been cleared, traders are watching to see if it can turn into solid support.
🎯 Next major level: 8,000
Breakouts can be exciting, but discipline matters—don’t chase blindly. Let price action confirm the trend and manage your risk.
Not financial advice. DYOR.
#SP500 #MarketATH #SP500TopsRecord7800 $ONDO
{future}(ONDOUSDT)
$LINK
{future}(LINKUSDT)
$BTC
{future}(BTCUSDT)
#USToPressNationsToPickUSOrChinaAICoalition
#sp500topsrecord7800
S&P 500 just broke above the historic 7,800 level! 📈🔥
A fresh all-time high shows that bullish momentum is still strong. Now that 7,800 has been cleared, traders are watching to see if it can turn into solid support.
🎯 Next major level: 8,000
Breakouts can be exciting, but discipline matters—don’t chase blindly. Let price action confirm the trend and manage your risk.
Not financial advice. DYOR.
#SP500 #MarketATH #SP500TopsRecord7800 $ONDO
$LINK
$BTC
#USToPressNationsToPickUSOrChinaAICoalition
S&P 500 just broke above the historic 7,800 level! 📈🔥
A fresh all-time high shows that bullish momentum is still strong. Now that 7,800 has been cleared, traders are watching to see if it can turn into solid support.
🎯 Next major level: 8,000
Breakouts can be exciting, but discipline matters—don’t chase blindly. Let price action confirm the trend and manage your risk.
Not financial advice. DYOR.
#SP500 #MarketATH #SP500TopsRecord7800 $ONDO
$LINK
$BTC
#USToPressNationsToPickUSOrChinaAICoalition

3
3
8.5k

#sp500topsrecord7800 📈 #S&P500TopsRecord7800
The S&P 500 broke above 7,800 for the first time, extending its record-setting rally. On August 13, it closed at 7,798.99, up about 0.65%, helped by softer U.S. producer-inflation data and reduced expectations of a September Fed rate hike.
Key points:
🔥 Record zone: S&P 500 reached the 7,800 level.
🤖 AI/semiconductors: Tech and chip stocks helped drive the rally; SanDisk and Micron were notable gainers.
🏦 Fed: Flat July PPI strengthened expectations that the Fed may keep rates unchanged in September.
🎯 Next psychological level: 8,000 is now the major round-number target, although further gains aren't guaranteed.
⚠️ Risk: After a rapid move to record highs, profit-taking or a pullback remains possible.
Interestingly, the index slipped 0.2% to 7,785.76 on Friday, August 14, but remained close to record territory.
#sp500topsrecord7800 📈 #S&P500TopsRecord7800
The S&P 500 broke above 7,800 for the first time, extending its record-setting rally. On August 13, it closed at 7,798.99, up about 0.65%, helped by softer U.S. producer-inflation data and reduced expectations of a September Fed rate hike.
Key points:
🔥 Record zone: S&P 500 reached the 7,800 level.
🤖 AI/semiconductors: Tech and chip stocks helped drive the rally; SanDisk and Micron were notable gainers.
🏦 Fed: Flat July PPI strengthened expectations that the Fed may keep rates unchanged in September.
🎯 Next psychological level: 8,000 is now the major round-number target, although further gains aren't guaranteed.
⚠️ Risk: After a rapid move to record highs, profit-taking or a pullback remains possible.
Interestingly, the index slipped 0.2% to 7,785.76 on Friday, August 14, but remained close to record territory.
The S&P 500 broke above 7,800 for the first time, extending its record-setting rally. On August 13, it closed at 7,798.99, up about 0.65%, helped by softer U.S. producer-inflation data and reduced expectations of a September Fed rate hike.
Key points:
🔥 Record zone: S&P 500 reached the 7,800 level.
🤖 AI/semiconductors: Tech and chip stocks helped drive the rally; SanDisk and Micron were notable gainers.
🏦 Fed: Flat July PPI strengthened expectations that the Fed may keep rates unchanged in September.
🎯 Next psychological level: 8,000 is now the major round-number target, although further gains aren't guaranteed.
⚠️ Risk: After a rapid move to record highs, profit-taking or a pullback remains possible.
Interestingly, the index slipped 0.2% to 7,785.76 on Friday, August 14, but remained close to record territory.
1
1
375


Verified
S&P 500 Nears and Tops the 7,800 Milestone
#SP500TopsRecord7800
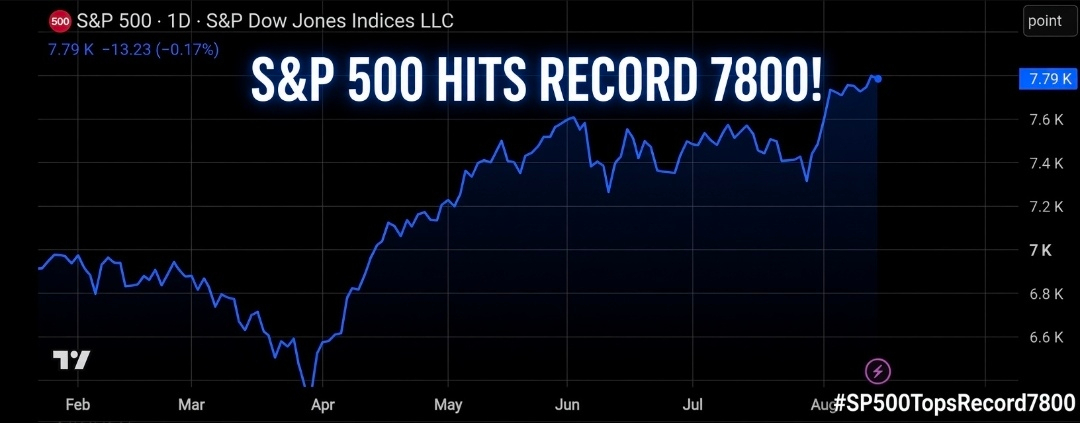
In mid-August 2026, the S&P 500 delivered another landmark moment for investors. On August 13, the index closed at a fresh all-time high of 7,798.99. The following day it pulled back slightly to 7,785.76, still hovering just below the psychological 7,800 level after touching an intraday peak of 7,816.70.
This marks the 27th record close of 2026 so far. The index is up roughly 13–14% year-to-date, continuing a strong run fueled largely by technology and artificial-intelligence related stocks.
Why It Matters
Crossing or closely approaching round-number levels like 7,000 earlier in the year and now 7,800 often draws attention from both retail and institutional investors. It signals sustained confidence in large-cap U.S. companies despite ongoing global uncertainties.
Key drivers behind the latest push include:
Strong earnings from major tech names
Softening inflation data that eased concerns about further rate hikes
Continued optimism around AI infrastructure and semiconductor demand
Looking Ahead
Analysts remain divided on how much further the rally can go, but the consistent ability of the S&P 500 to set new highs in 2026 shows the market’s underlying resilience. Whether the index sustains a move above 7,800 in the coming sessions will be closely watched.
For now, the hashtag #SP500TopsRecord7800 captures the excitement around this latest milestone in a year already full of records.
#BinanceAfrica @BinanceAfrica
S&P 500 Nears and Tops the 7,800 Milestone
#SP500TopsRecord7800
In mid-August 2026, the S&P 500 delivered another landmark moment for investors. On August 13, the index closed at a fresh all-time high of 7,798.99. The following day it pulled back slightly to 7,785.76, still hovering just below the psychological 7,800 level after touching an intraday peak of 7,816.70.
This marks the 27th record close of 2026 so far. The index is up roughly 13–14% year-to-date, continuing a strong run fueled largely by technology and artificial-intelligence related stocks.
Why It Matters
Crossing or closely approaching round-number levels like 7,000 earlier in the year and now 7,800 often draws attention from both retail and institutional investors. It signals sustained confidence in large-cap U.S. companies despite ongoing global uncertainties.
Key drivers behind the latest push include:
Strong earnings from major tech names
Softening inflation data that eased concerns about further rate hikes
Continued optimism around AI infrastructure and semiconductor demand
Looking Ahead
Analysts remain divided on how much further the rally can go, but the consistent ability of the S&P 500 to set new highs in 2026 shows the market’s underlying resilience. Whether the index sustains a move above 7,800 in the coming sessions will be closely watched.
For now, the hashtag #SP500TopsRecord7800 captures the excitement around this latest milestone in a year already full of records.
#BinanceAfrica @Binance Africa
#SP500TopsRecord7800
In mid-August 2026, the S&P 500 delivered another landmark moment for investors. On August 13, the index closed at a fresh all-time high of 7,798.99. The following day it pulled back slightly to 7,785.76, still hovering just below the psychological 7,800 level after touching an intraday peak of 7,816.70.
This marks the 27th record close of 2026 so far. The index is up roughly 13–14% year-to-date, continuing a strong run fueled largely by technology and artificial-intelligence related stocks.
Why It Matters
Crossing or closely approaching round-number levels like 7,000 earlier in the year and now 7,800 often draws attention from both retail and institutional investors. It signals sustained confidence in large-cap U.S. companies despite ongoing global uncertainties.
Key drivers behind the latest push include:
Strong earnings from major tech names
Softening inflation data that eased concerns about further rate hikes
Continued optimism around AI infrastructure and semiconductor demand
Looking Ahead
Analysts remain divided on how much further the rally can go, but the consistent ability of the S&P 500 to set new highs in 2026 shows the market’s underlying resilience. Whether the index sustains a move above 7,800 in the coming sessions will be closely watched.
For now, the hashtag #SP500TopsRecord7800 captures the excitement around this latest milestone in a year already full of records.
#BinanceAfrica @Binance Africa
9
5
597

#SP500TopsRecord7800 : S&P 500 Reaches 7,800
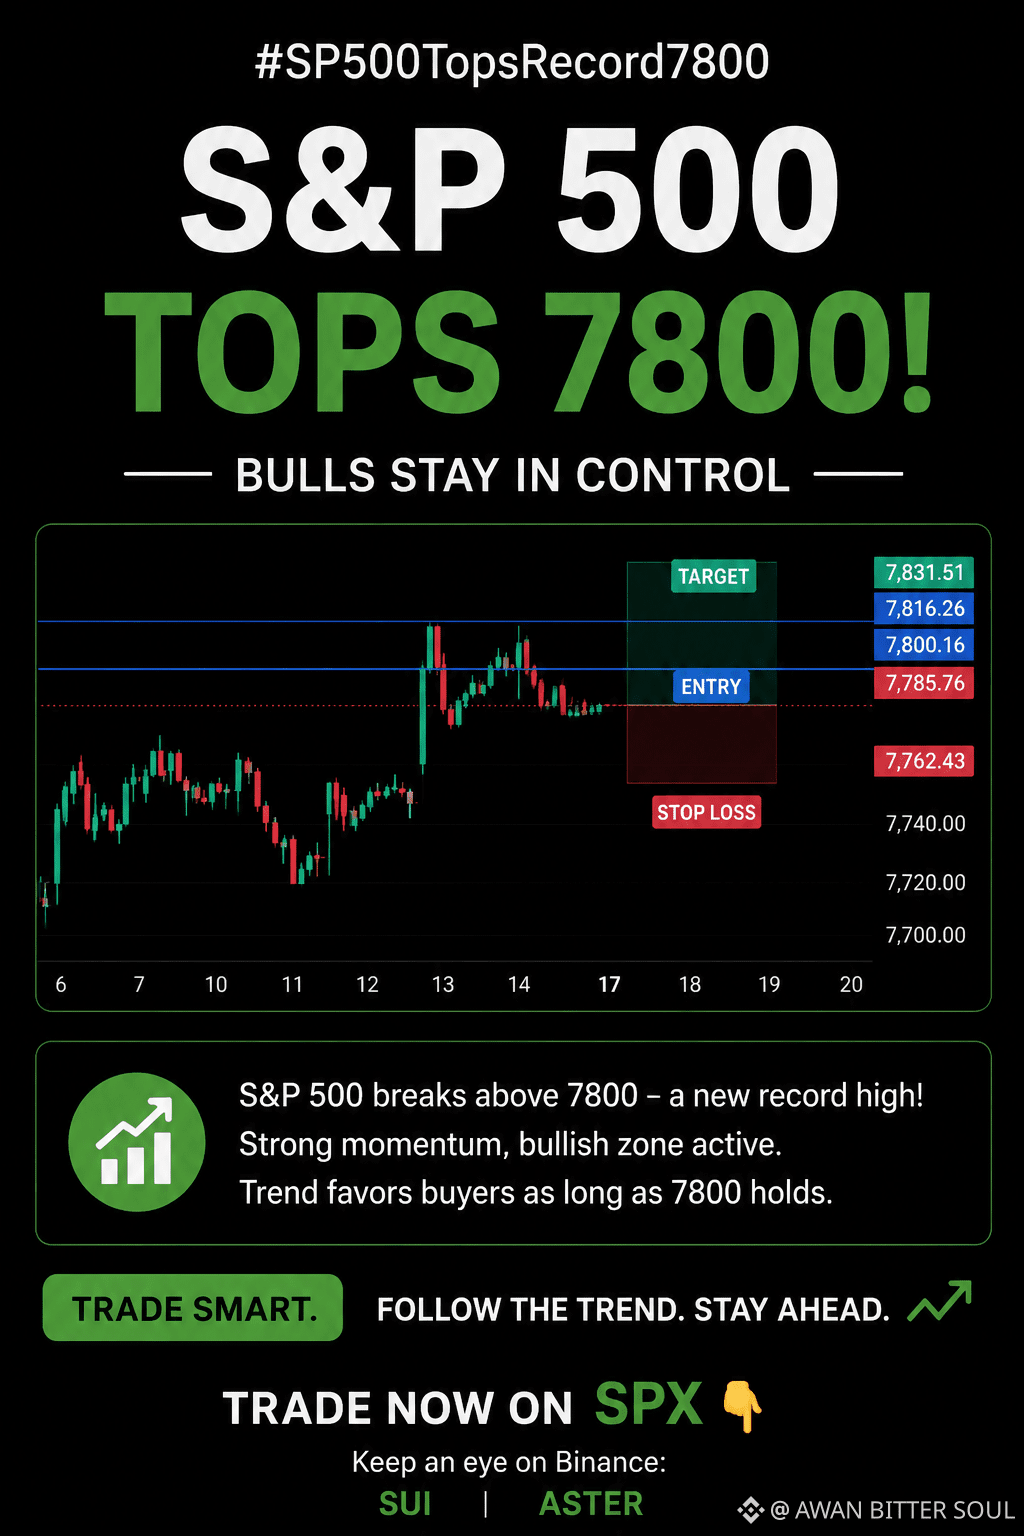
The S&P 500 has pushed above the 7,800 level, showing strong bullish momentum and renewed confidence across the market.
Breaking this important psychological level could keep buyers in control, especially if the index continues to hold above 7,800. Traders will now watch whether this breakout can develop into another leg higher.
For now, the trend remains positive, but volatility and pullbacks should still be expected. The 7,800 level could become an important support zone for the next move.
#SP500TopsRecord7800 : S&P 500 Reaches 7,800
The S&P 500 has pushed above the 7,800 level, showing strong bullish momentum and renewed confidence across the market.
Breaking this important psychological level could keep buyers in control, especially if the index continues to hold above 7,800. Traders will now watch whether this breakout can develop into another leg higher.
For now, the trend remains positive, but volatility and pullbacks should still be expected. The 7,800 level could become an important support zone for the next move.
The S&P 500 has pushed above the 7,800 level, showing strong bullish momentum and renewed confidence across the market.
Breaking this important psychological level could keep buyers in control, especially if the index continues to hold above 7,800. Traders will now watch whether this breakout can develop into another leg higher.
For now, the trend remains positive, but volatility and pullbacks should still be expected. The 7,800 level could become an important support zone for the next move.
2
158

#SP500TopsRecord7800 Yes — that headline is basically right, with one important nuance: the S&P 500 traded above 7,800 intraday on Thursday, August 13, 2026, but it closed just below that level at 7,798.99. CNBC reported it was the first time ever the index surpassed 7,800 during trading, and Reuters coverage said it finished at a record-high close. (cnbc.com)
The move was tied mainly to cooler-than-expected inflation data, falling oil prices, and continued strength in large-cap tech names linked to the AI trade. Reuters-style coverage highlighted gains in companies like Sandisk, Micron, Microsoft, and Meta as part of the backdrop. (thestar.com.my)
So the cleanest way to say it is: the S&P 500 topped 7,800 intraday and set a record close near 7,799, rather than closing above 7,800. (cnbc.com)$BTC
{spot}(BTCUSDT)
$ONG
{spot}(ONGUSDT)
$SPYB
{spot}(SPYBUSDT)
#SP500TopsRecord7800 Yes — that headline is basically right, with one important nuance: the S&P 500 traded above 7,800 intraday on Thursday, August 13, 2026, but it closed just below that level at 7,798.99. CNBC reported it was the first time ever the index surpassed 7,800 during trading, and Reuters coverage said it finished at a record-high close. (cnbc.com)
The move was tied mainly to cooler-than-expected inflation data, falling oil prices, and continued strength in large-cap tech names linked to the AI trade. Reuters-style coverage highlighted gains in companies like Sandisk, Micron, Microsoft, and Meta as part of the backdrop. (thestar.com.my)
So the cleanest way to say it is: the S&P 500 topped 7,800 intraday and set a record close near 7,799, rather than closing above 7,800. (cnbc.com)$BTC
$ONG
$SPYB
The move was tied mainly to cooler-than-expected inflation data, falling oil prices, and continued strength in large-cap tech names linked to the AI trade. Reuters-style coverage highlighted gains in companies like Sandisk, Micron, Microsoft, and Meta as part of the backdrop. (thestar.com.my)
So the cleanest way to say it is: the S&P 500 topped 7,800 intraday and set a record close near 7,799, rather than closing above 7,800. (cnbc.com)$BTC
$ONG
$SPYB
1
104
·
--
Verified
#sp500topsrecord7800 The S&P 500 just crossed the historic 7,800 mark for the first time ever! This massive jump is driven by strong company profits and lower inflation numbers that gave investors a lot of hope. Even though some people worry about everyday shoppers spending less money, the stock market keeps pushing higher. Big tech growth and great quarterly earnings are doing all the heavy lifting right now. Wall Street is celebrating another major record!
CLICK BELOW TO TRADE : $BTC $ETH $CL
{future}(CLUSDT)
{future}(ETHUSDT)
{future}(BTCUSDT)
#sp500topsrecord7800 The S&P 500 just crossed the historic 7,800 mark for the first time ever! This massive jump is driven by strong company profits and lower inflation numbers that gave investors a lot of hope. Even though some people worry about everyday shoppers spending less money, the stock market keeps pushing higher. Big tech growth and great quarterly earnings are doing all the heavy lifting right now. Wall Street is celebrating another major record!
CLICK BELOW TO TRADE : $BTC $ETH $CL
CLICK BELOW TO TRADE : $BTC $ETH $CL
1
1.3k
Log in to explore more content
Join global crypto users on Binance Square
⚡️ Get latest and useful information about crypto.
💬 Trusted by the world’s largest crypto exchange.
👍 Discover real insights from verified creators.
Email / Phone number
Trending Topics
1
#IMFApproves$139MDisbursementToElSalvador
0 views
1 Discussing
2
#AnthropicTargetsIPOAsSoonAsMidNovember
475 views
31 Discussing
3
#EtherGains70.9%InQ3
192,686 views
1,265 Discussing
4
#TreasuryLetsStatesFileStablecoinCertificationsEarly
13,208 views
99 Discussing
5
#US10YearYieldNears5.3%
167,008 views
1,216 Discussing
6
#DollarIndexHitsHighestSinceMay2025
52,691 views
676 Discussing
7
#USWeeklyJoblessClaimsFallTo197000
40,685 views
543 Discussing
8
#BitcoinETFsTake$6.34BillionInQ3
10,820 views
77 Discussing
9
#KoreaProposesTokenizingStocksAndBonds
78,508 views
856 Discussing
10
#MetaMaskExitsLidoValidatorsAfterSecurityIncident
179,566 views
1,583 Discussing