

#nvdab
nvdab
53,973 views
1,349 Discussing
Hot
Latest


$NVDAB: Do Loud Candles Guarantee Success?
Myth: High volume proves a breakout is real.
Question
Traders often assume that when volume spikes, the price move is permanent. For $NVDAB, the hourly direction is up and volume is above baseline. Many see this loud activity and expect a smooth trend. But does participation guarantee direction?
Mechanism
Volume measures effort, not just result. A spike means more traders are active, but it does not say who is winning. Sellers can create high volume while price stays inside the recorded range. If the close remains below resistance, the effort was offset by opposition. The relative volume token confirms activity, but it does not confirm buy pressure alone.
Check the close location. If price holds near the high of the candle with sustained volume, the move has conviction. If it closes near the middle, the market is undecided. This distinction separates a breakout from a trap.
Limits
This logic fails during low liquidity hours. Thin markets can show fake spikes from few trades. Watch the daily VWAP. If hourly candles sit above it, the trend has structural support. If they drift below, the initial hope fades. Do not confuse speed with safety. A fast move on high volume can reverse quickly if support breaks. Always reassess the close versus the range. High energy creates opportunity, but only structure creates reliability. Focus on where price settles, not just how loudly it moves. The data shows activity; the chart shows outcome. Trust the structure over the noise. 📊
Probabilistic market research, not a recommendation or guaranteed return.
Which trading assumption would you like to question next?
#NVDAB #CryptoLearning
$NVDAB : Do Loud Candles Guarantee Success?
Myth: High volume proves a breakout is real.
Question
Traders often assume that when volume spikes, the price move is permanent. For $NVDAB , the hourly direction is up and volume is above baseline. Many see this loud activity and expect a smooth trend. But does participation guarantee direction?
Mechanism
Volume measures effort, not just result. A spike means more traders are active, but it does not say who is winning. Sellers can create high volume while price stays inside the recorded range. If the close remains below resistance, the effort was offset by opposition. The relative volume token confirms activity, but it does not confirm buy pressure alone.
Check the close location. If price holds near the high of the candle with sustained volume, the move has conviction. If it closes near the middle, the market is undecided. This distinction separates a breakout from a trap.
Limits
This logic fails during low liquidity hours. Thin markets can show fake spikes from few trades. Watch the daily VWAP. If hourly candles sit above it, the trend has structural support. If they drift below, the initial hope fades. Do not confuse speed with safety. A fast move on high volume can reverse quickly if support breaks. Always reassess the close versus the range. High energy creates opportunity, but only structure creates reliability. Focus on where price settles, not just how loudly it moves. The data shows activity; the chart shows outcome. Trust the structure over the noise. 📊
Probabilistic market research, not a recommendation or guaranteed return.
Which trading assumption would you like to question next?
#NVDAB #CryptoLearning
15

·
--
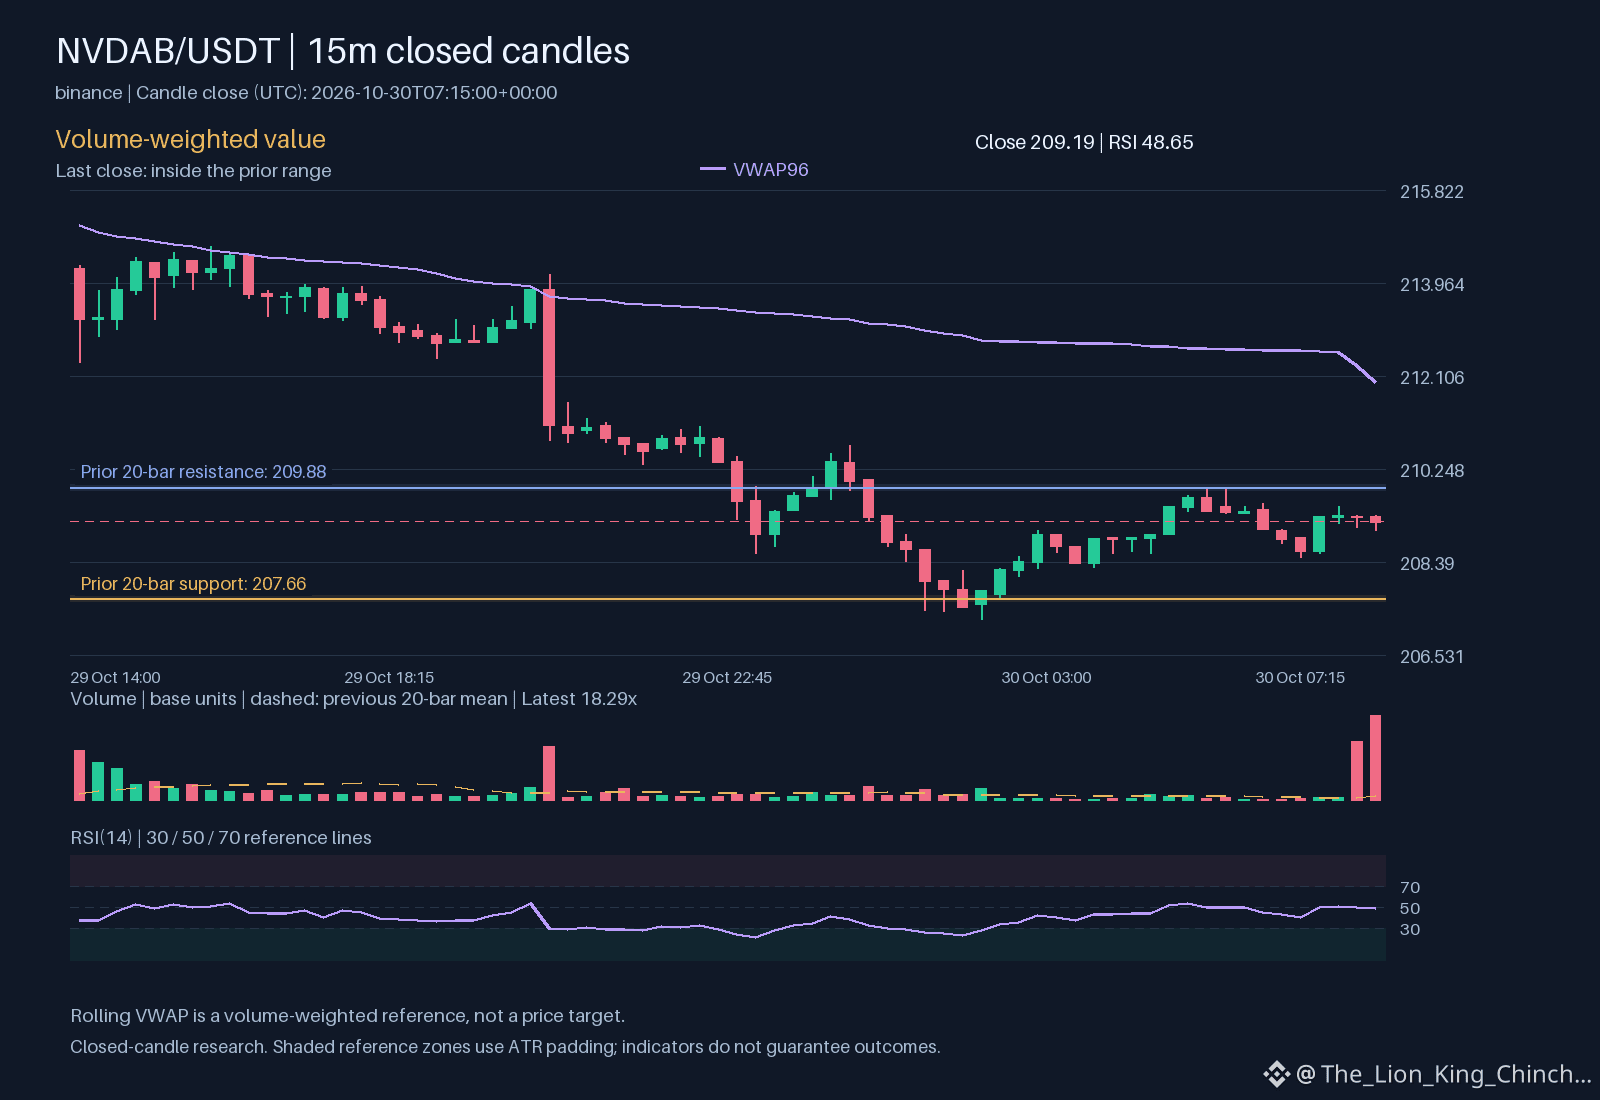
Volume surged 5.73x above average as $NVDAB pulled back 1.91% to $214.02.
Hourly closes are hovering near 213.26 after testing the lower boundary of its 212.70 to 218.70 range.
If buyers defend the lower boundary and reclaim 218.70 with sustaining volume, momentum could shift upward. Conversely, a sustained break below 212.70 invalidates the stabilization scenario.
Will you wait for a reclaim of 218.70 to confirm strength, or does a drop below 212.70 invalidate your setup?
Tap $NVDAB for the live chart. #NVDAB #BinanceSquare

Breaking this down real quick...
ATH/ATL Watch 🎯
Getting close to all-time highs:
$BFUSD - 0.1% away
$NVDAB - 11.9% away
Near all-time lows:
$XUSD - 0.2% away
ATH breakouts often signal strong momentum. ATL bounces can be interesting reversal plays. Always DYOR.
Bookmark this one
#NVDAB #XUSD #BFUSD #CryptoNews #Trending
📱 Follow @PoorCryptoMan
Right now...
ATH/ATL Watch 🎯
Getting close to all-time highs:
$INIT - 9.4% away
$NVDAB - 10.1% away
Near all-time lows:
$XUSD - 0.2% away
ATH breakouts often signal strong momentum. ATL bounces can be interesting reversal plays. Always DYOR.
Are you buying, selling, or holding?
#NVDAB #XUSD #INIT #Breaking #Trending
📱 Follow @PoorCryptoMan
2
ATH/ATL Watch 🎯
Getting close to all-time highs:
$TSLAB - 10.5% away
$NVDAB - 11.3% away
Near all-time lows:
$XUSD - 0.2% away
ATH breakouts often signal strong momentum. ATL bounces can be interesting reversal plays. Always DYOR.
Follow for daily updates
#NVDAB #XUSD #TSLAB #MarketUpdate #CryptoNews
📱 Follow @PoorCryptoMan
5

·
--
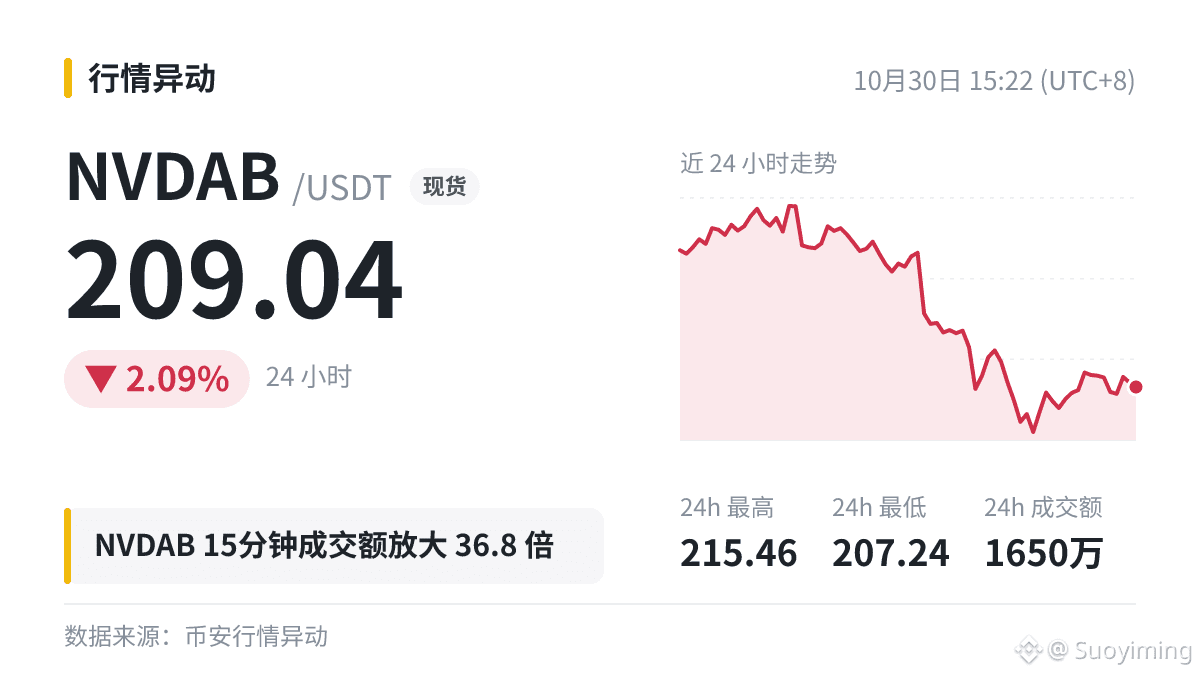
📌 $NVDAB 15-minute trading volume: $2.57 million (36.8 times the average)
The price barely moved; the current price is 209.04.
When I look at a surge in volume, I generally consider two things: how large the volume is, and where the price closes during the surge.
#NVDAB
📌 $NVDAB 15-minute trading volume: $2.57 million (36.8 times the average)
The price barely moved; the current price is 209.04.
When I look at a surge in volume, I generally consider two things: how large the volume is, and where the price closes during the surge.
#NVDAB
The price barely moved; the current price is 209.04.
When I look at a surge in volume, I generally consider two things: how large the volume is, and where the price closes during the surge.
#NVDAB

·
--
Whoa, this move is pretty intense!
$NVDAB 15 minutes of 36.8x volume, but the price barely moved!
With volatile coins, it's even more important to trade in batches. Going all in or out at once can easily get you shaken out.
#NVDAB
Just a market record; please make your own trading decisions.
Whoa, this move is pretty intense!
$NVDAB 15 minutes of 36.8x volume, but the price barely moved!
With volatile coins, it's even more important to trade in batches. Going all in or out at once can easily get you shaken out.
#NVDAB
Just a market record; please make your own trading decisions.
$NVDAB 15 minutes of 36.8x volume, but the price barely moved!
With volatile coins, it's even more important to trade in batches. Going all in or out at once can easily get you shaken out.
#NVDAB
Just a market record; please make your own trading decisions.

Brothers!!
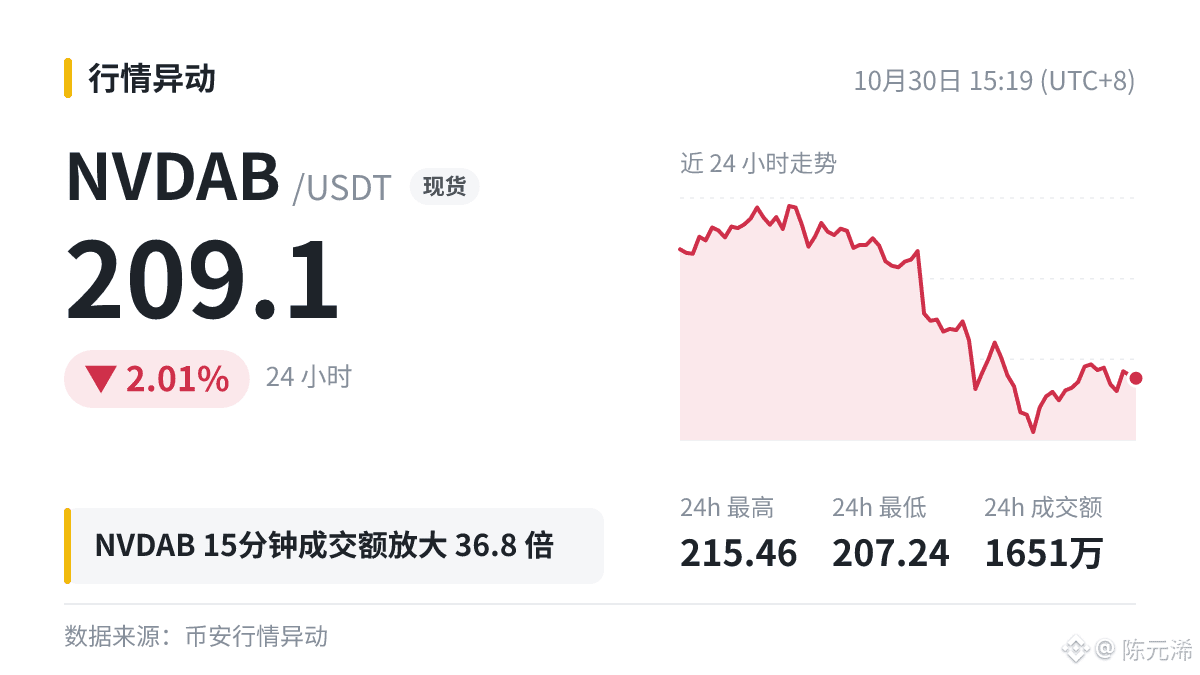
$NVDAB In 15 minutes, trading volume suddenly surged 36.8x!
The price hasn't moved much yet—is a market reversal coming?
Volume-price divergence often signals intense turnover. Watch which way the market moves. Where are you looking next?
#NVDAB
Brothers!!
$NVDAB In 15 minutes, trading volume suddenly surged 36.8x!
The price hasn't moved much yet—is a market reversal coming?
Volume-price divergence often signals intense turnover. Watch which way the market moves. Where are you looking next?
#NVDAB
$NVDAB In 15 minutes, trading volume suddenly surged 36.8x!
The price hasn't moved much yet—is a market reversal coming?
Volume-price divergence often signals intense turnover. Watch which way the market moves. Where are you looking next?
#NVDAB
7

·
--
🐋 $NVDAB The 15-minute trading volume was about $2.57 million, 36.8 times the previous average; the price barely moved during the same period.
When volume picks up, many people instinctively assume big money is coming in, but it’s not that simple.
Minute-level volume spikes can be noisy. A single high-volume candlestick may simply reflect one large order; several consecutive high-volume candles are more telling.
Sometimes a surge in volume comes from widespread liquidations: liquidation orders are executed involuntarily, so this kind of volume means something different from voluntary buying and selling. Check liquidation data for context.
With leveraged trading, first work out whether you can withstand the worst-case scenario, then consider what the indicators are saying.
#NVDAB
3

$59.7 million, 9,600 A100s, which works out to $6,220 per card. The listing for this setup on eBay specifies 300 racks, 1,200 GPU servers, 384TB of VRAM, and 1.4PB of memory. The seller is Core 4 Solution. Of all these numbers, the per-card price tag is the one that deserves the most attention.
First, let’s confirm the model of this equipment. Divide 384TB of VRAM by 9,600 cards and you get exactly 40GB per card, not the 80GB version. This is an older SKU. It’s housed in 300 racks containing 1,200 servers—an average of four servers per rack, which isn’t particularly dense. This looks like a cluster that has completed its depreciation cycle and is being liquidated as a package, rather than a standard configuration for a newly built AI factory.
First, the fact that it’s being offered as a single package says more than the unit price. If the 9,600 cards were sold individually, the price per card could theoretically be higher, but the seller has chosen to sell everything at once for $59.7 million. That suggests there are few buyers able to take on 300 racks in one go, and that the seller is prioritizing speed over a premium. Compute capacity is shifting from “scarce rent” to “assets for disposal.” That change in status is more worth documenting than any individual card’s asking price.
Second, the signal’s path to NVDAB is long, and it isn’t linear. Secondhand listing prices first affect expectations for rental rates; rental rates then affect cloud providers’ purchasing pace; and purchasing pace, in turn, affects shipment guidance. There are two or three quarters in between. Trading an eBay listing price directly as bad news for NVDAB means skipping every step in that transmission chain—and ultimately just paying for a headline.
Third, NVDAB’s actual pricing basis isn’t eBay, but the closing NAV and the overnight gap. The token trades 24/7, while the underlying assets are priced only during the six and a half hours of the U.S. stock market session. When news like this breaks during Asian trading hours, the token may move first, but that’s a sentiment discount, not NAV. Once the U.S. market closes and NAV is set, the next day’s opening gap is when the real repricing happens. This structural time lag is a more useful trading framework than the news itself.
Fourth, the risk lies in market depth. During non-U.S. trading hours, NVDAB’s order book is already thin. A single large order can push the premium or discount outside a reasonable range, and market makers may pull one side of their quotes when the direction is unclear. In these conditions, the price you see on screen may not be a price anyone is willing to trade at. What you should really watch is how quickly the order book recovers once the gap closes, rather than the gap’s absolute size.
My view is that this news alone isn’t enough to determine NVDAB’s direction, but it provides a useful window to watch. If more similar bulk compute listings appear over the next few weeks and transaction prices keep falling, that would be evidence that the capital expenditure cycle is peaking—not just a one-off news story. Conversely, if no one takes this $59.7 million package, it would suggest that the market has yet to reach a consensus on the residual value of older SKUs, and the depreciation curve will only get steeper. These two possible developments would have very different implications for NVDAB, so it’s too early to draw a conclusion.
Risk warning: Quotes for tokenized stocks during non-trading hours have limited reference value. Betting on the overnight gap is essentially a bet on liquidity, not fundamentals.
#NVDAB #Crypto
17

·
--
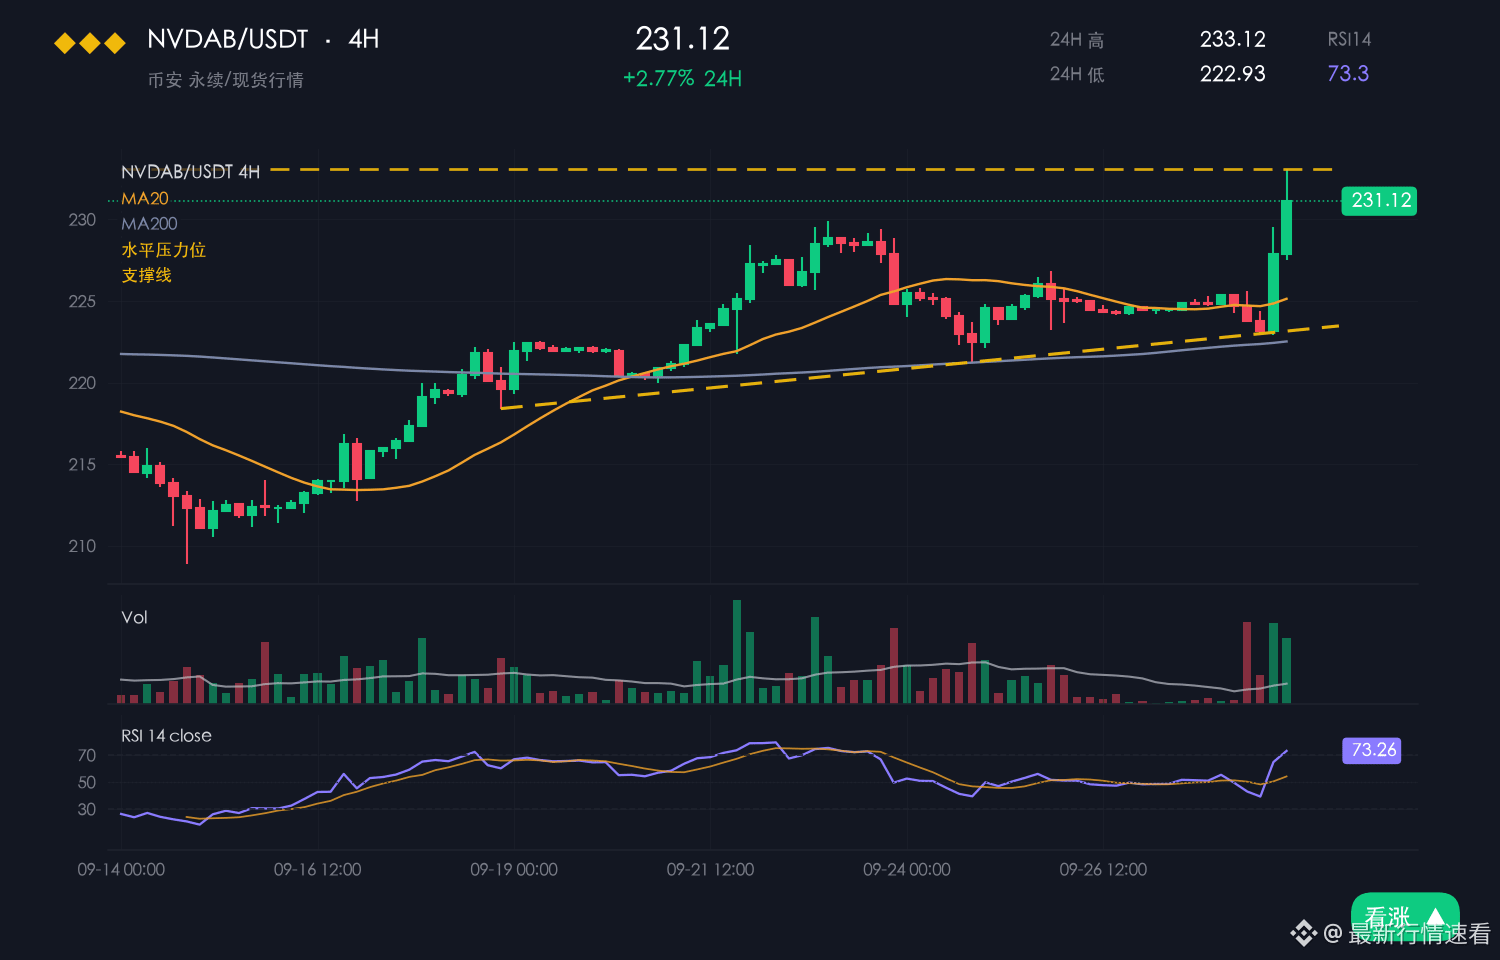
NVDAB is currently at 216.56, up 1.78% over 24 hours but still down 0.40% over 7 days. The intraday range is 210.65–217.98, with an amplitude of 3.5%.
【Market】
Quite a few people have been asking whether NVDAB is worth watching right now, so here’s a quick take.
First, a basic point: the intraday range of 210.65–217.98 is public information; it’s not something someone made up.
While the broader market is forming a bottom, NVDAB has still managed to stay in the green over 24 hours, suggesting that there’s independent buying support.
Around 210.65 was where this rally began, so a pullback to that level wouldn’t be a bad risk-reward opportunity.
Compared with BTC’s -0.56%, NVDAB is clearly outperforming the broader market.
【Macro】 U.S. stocks fell overnight: Nasdaq -0.21%, S&P 500 -0.52% (close on 2026-10-26). BTC ETFs saw net outflows of about $45.2 billion this month, U.S. CPI came in at 3.7% year over year, above expectations, and the probability of a rate hike at the 2026-10-27/28 meeting is around 47%.
The short-term outlook leans bullish.
【Bullish Case】
What’s the key level? 210.65. That level gives us a range, and the range gives us a rhythm.
The 7-day return is still down 0.40%, so for now, treat the 1.78% daily gain as a rebound from oversold conditions. Don’t rush to call a reversal.
Take it slowly; no need to rush.
The short-term rise has been quite rapid, so don’t ignore the risk of a sharp wick. It’s safer to wait for a pullback and confirmation before acting.
$NVDAB #NVDAB
3

·
--
🚀 NVDAB: AI & Crypto Market Watch! 📊🔥
The AI and technology sectors continue to attract attention, and $NVDAB is a token to keep on your radar! 👀
💡 What to Watch: 🔹 Market momentum and price action 🔹 Trading volume and liquidity 🔹 Community growth and market sentiment 🔹 Potential opportunities and risk levels
📈 Every market move matters! Stay informed, do your own research, and avoid making decisions based on hype alone.
💬 What do you think about NVDAB? Bullish 📈 or bearish 📉? Share your thoughts below!
#NVDAB #BinanceSquare #Crypto #Altcoins #CryptoCommunity

79

·
--
Let’s look at this project news from a market-funds perspective: $NVDAB
Sixpence launches a points campaign with a prize pool of 10,000 USDG
After good news breaks, there are often two kinds of money in the market: short-term money that comes in on the news, and money that was positioned early and is waiting to cash out. The market only has staying power when the short-term money outweighs the latter.
#NVDAB
Just take it as something to listen to—don’t buy based on it. Make your own judgment.
77

·
--
Data is more honest than any opinion: first, see whether volume and price are moving in sync.
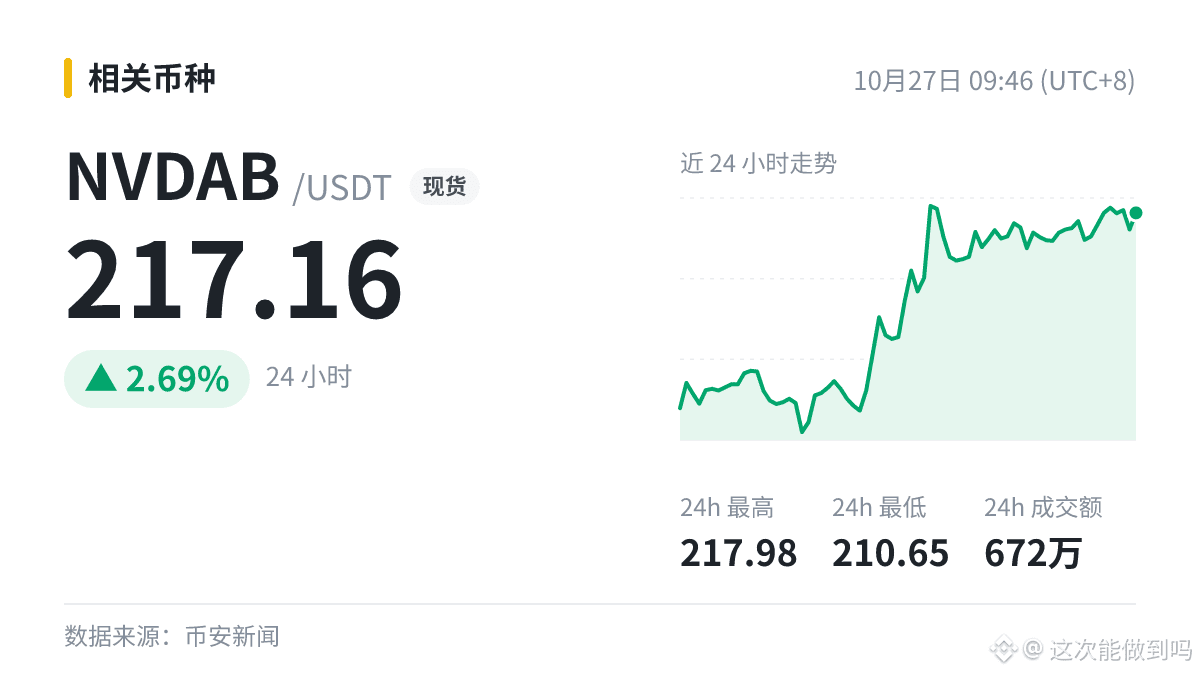
Take this one: Sixpence launches a points campaign with a prize pool of 10,000 USDG; $NVDAB is up 2.21% intraday, with 6.7 million in trading volume.
This gives the bulls a bit more confidence, but whether it delivers remains to be seen—follow the money.
#NVDAB
Take this one: Sixpence launches a points campaign with a prize pool of 10,000 USDG; $NVDAB is up 2.21% intraday, with 6.7 million in trading volume.
This gives the bulls a bit more confidence, but whether it delivers remains to be seen—follow the money.
#NVDAB
57

·
--
🐳 Ecosystem news and trading volume in focus: Sixpence launches a points campaign with a 10,000 USDG prize pool
$NVDAB 24h trading volume: $6.72 million. Will the positive news bring in new capital? Watch to see whether trading volume picks up.
#NVDAB
🐳 Ecosystem news and trading volume in focus: Sixpence launches a points campaign with a 10,000 USDG prize pool
$NVDAB 24h trading volume: $6.72 million. Will the positive news bring in new capital? Watch to see whether trading volume picks up.
#NVDAB
$NVDAB 24h trading volume: $6.72 million. Will the positive news bring in new capital? Watch to see whether trading volume picks up.
#NVDAB
61

·
--
A 30-second rundown
① Sixpence launches a points campaign with a 10,000 USDG prize pool
② Covered by 2 media outlets; sentiment is mildly positive
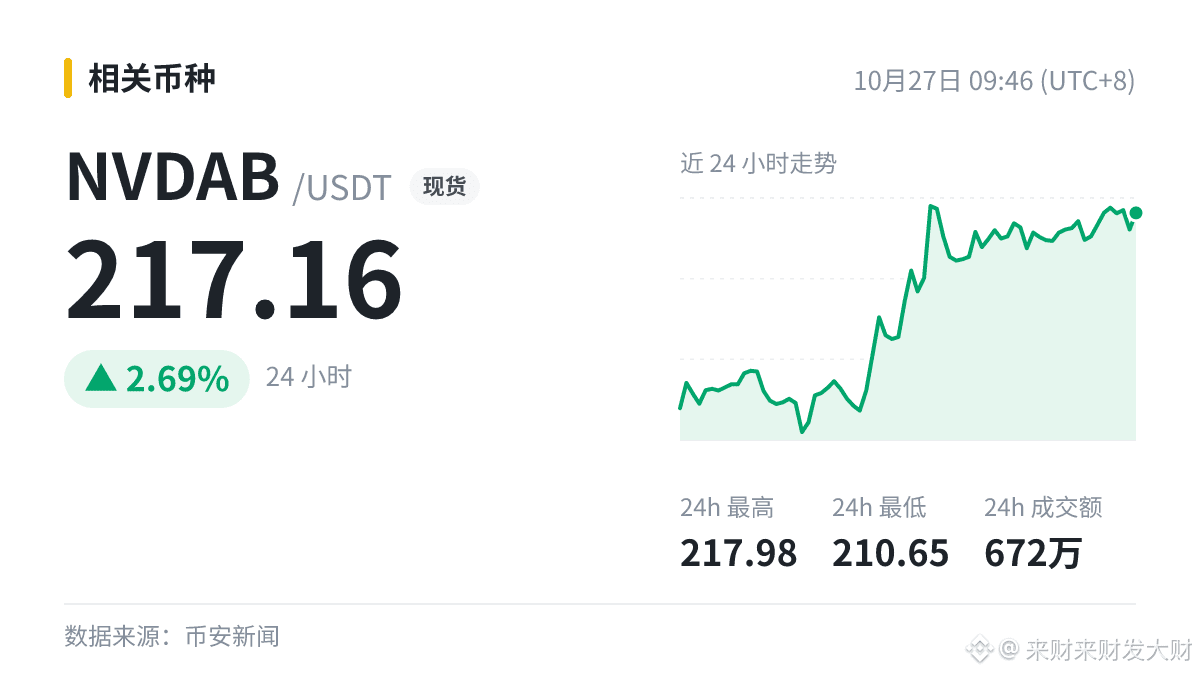
③ $NVDAB is currently at 217.16, up 2.69% over 24h
Let’s wait and see how the price moves after the event unfolds.
#NVDAB
This information may also be wrong, so don’t treat it as advice.
13

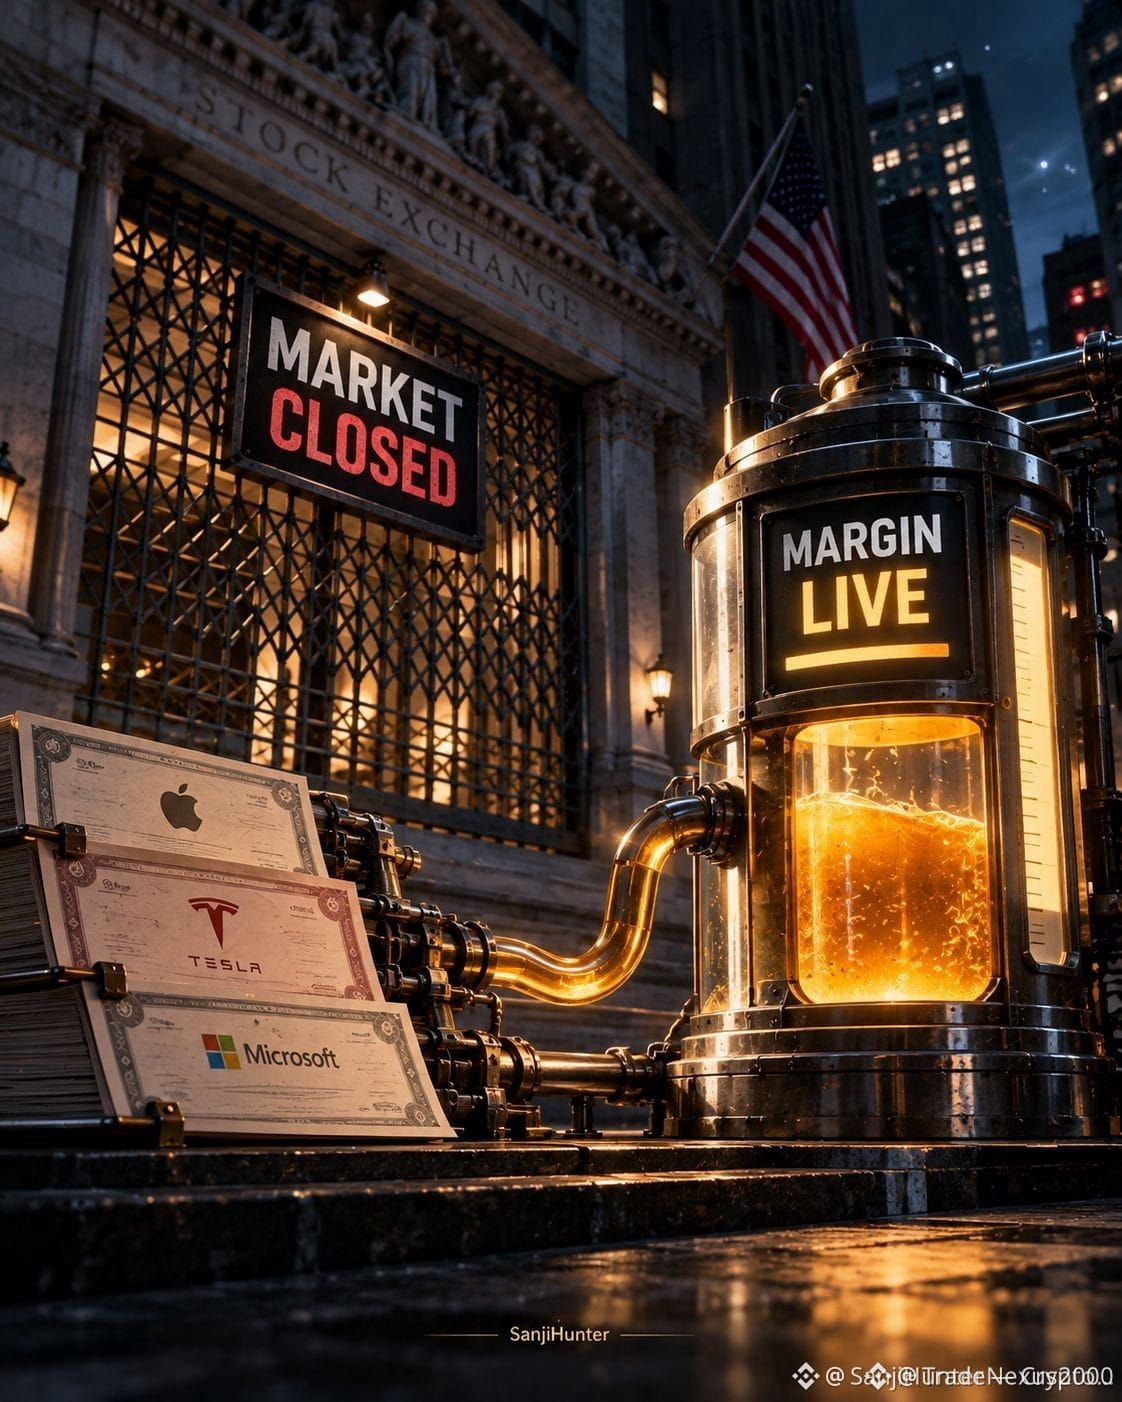
🚨 $NVDAB COLLATERAL VALUATION SHIFT WHILE MARKETS ARE CLOSED! 🦈
📊 Binance’s bStocks index now smooths 24/7 order‑book pricing with an EWMA filter, so the collateral figure can drift even when Wall Street sleeps. 📌 This subtle drift can nibble your margin level, turning a seemingly safe buffer into a hidden exposure. 🔍 Smart‑money operators watch the underlying equity moves; a sudden dip in the reference stock can trigger a liquidity sweep that erodes your uniMMR before the next market open.
💡 Keep an eye on the real‑time buffer rather than the last closing price – the true safety net lives in the live index. 🤔 How are you adjusting your collateral strategy to guard against off‑hour squeezes? 👇
⚠️ Not financial advice. Always manage your risk. 🛡️
🏷️ #NVDAB #BStocks #MarginRisk #SmartMoney #Crypto
🦈 🚀
4

·
--
When it comes to $NVDAB, this is today’s hottest topic—
NVIDIA’s fiscal Q2 2027 results surged, with its data center business standing out. The author is optimistic that demand for AI computing power will continue.
The numbers speak for themselves, and all the sentiment is there
What do you think? 👇
#市场观察 #NVDAB #Binance
When it comes to $NVDAB , this is today’s hottest topic—
NVIDIA’s fiscal Q2 2027 results surged, with its data center business standing out. The author is optimistic that demand for AI computing power will continue.
The numbers speak for themselves, and all the sentiment is there
What do you think? 👇
#市场观察 #NVDAB #Binance
NVIDIA’s fiscal Q2 2027 results surged, with its data center business standing out. The author is optimistic that demand for AI computing power will continue.
The numbers speak for themselves, and all the sentiment is there
What do you think? 👇
#市场观察 #NVDAB #Binance
1
Rumors that the RTX 5090 and 5080 are being discontinued have pushed up spot prices at retail, but the gains aren’t going to NVIDIA—they’re inventory premiums pocketed by middlemen.
First, distinguish where the money is going. When consumer cards are marked up on e-commerce and through retail channels, the money goes into the pockets of distributors and hoarders, not NVIDIA’s income statement. The company’s recognized revenue depends on shipment and delivery schedules. And in its current revenue mix, data centers are overwhelmingly dominant, accounting for around 90% in recent quarters. Even if gaming cards’ small share doubled in price through retail channels, it wouldn’t change the current-period figures. So the first implication of this rumor for NVDAB is straightforward: noise, not a signal. NVDAB is priced on data center shipments, not markups on JD or Xianyu.
The second layer is more interesting. If the rumor is true, what would discontinuing consumer cards free up? Wafer and advanced packaging capacity. The most direct beneficiaries of making room by cutting back on large-die, high-memory consumer cards like the 5090 and 5080 would be delivery of data center products. Read the same news as “graphics cards getting more expensive,” and it’s a consumer-side shortage story; read it as “capacity being reallocated,” and it becomes a supply-chain clue that matters to NVDAB. The way to tell these interpretations apart isn’t complicated: watch sequential data center revenue and management’s comments on supply in the next earnings season, not screenshots of markups.
The third layer is narrative momentum, and there’s a datapoint here that’s easy to overlook. The rumor has garnered only 3 likes and 0 comments in the community. It hasn’t spread into a cross-market narrative; it’s just a local topic within the community. An industry-level event wouldn’t get this level of engagement. Low buzz means it’s unlikely to bring sustained inflows into NVDAB; it’s probably a brief emotional spike, not a shift in capital flows.
So what matters on the tape isn’t graphics card prices, but three readings: first, whether the funding rate stays positive, and whether leverage is backing the sentiment; second, whether open interest rises along with the price—is new money coming in, or are shorts covering; third, how trading volume is distributed over time. If the entire volume spike is concentrated in the hour or two after the news spreads, then quickly subsides, it’s probably a brief spike rather than a trend. If only the price is moving while funding rates and open interest stay flat, the conclusion is already clear.
My view: consumer card price increases carry very little weight in NVDAB’s valuation. What really determines the direction is the pace of data center shipments and the supply-side commentary in the next earnings report. Whether the rumor is confirmed or debunked doesn’t change that hierarchy. The biggest risk in trading on this news is mistaking a retail-channel phenomenon for company fundamentals: markups can disappear overnight; shipment schedules won’t.
#股票财报季 #Crypto #NVDAB
10

·
--
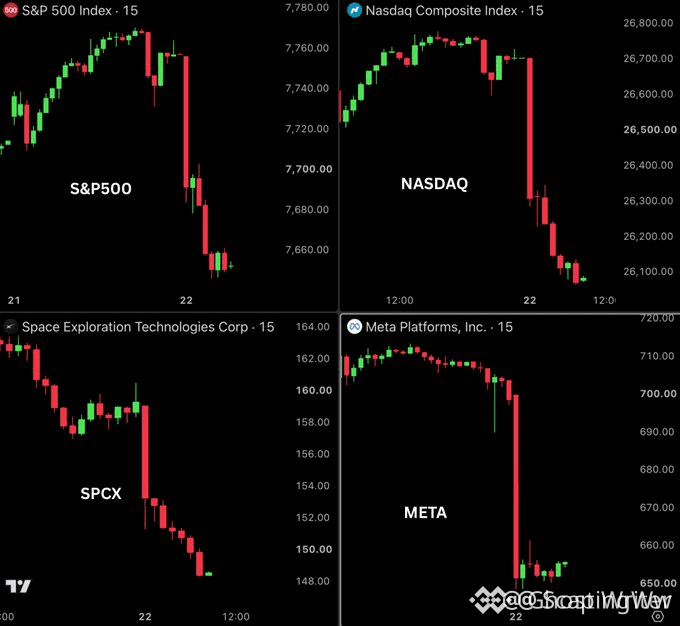
🔴 $NVDAB PLUNGES AS US SELLOFF RIPPLES THROUGH TECH 🦈
📊 The $200B wipeout on $NVDAB mirrors a brutal liquidity sweep across the tech corridor, with sellers flooding the order book as the S&P 500 slides into its steepest one‑day loss in three months. 📉 Volume spikes signal smart‑money exits, and the remaining demand block is now a thin line under pressure. 🧭 Expect the next wave to chase the next support level, where whales could rebalance or double‑down.
💬 Are you watching the liquidity pool for a potential rebound or riding the downside? 👇
⚠️ Not financial advice. Always manage your risk. 🛡️
🏷️ #NVDAB #Bearish #Selloff #Crypto
🔥 💎
6
Log in to explore more content
Join global crypto users on Binance Square
⚡️ Get latest and useful information about crypto.
💬 Trusted by the world’s largest crypto exchange.
👍 Discover real insights from verified creators.
Email / Phone number
Trending Topics
1
#EarningsSeason
6.6M views
33,223 Discussing
2
#USMidtermElections
89,341 views
1,171 Discussing
3
#StrategySTRCReaches$99.95ForFirstTimeIn165Days
1,036 views
39 Discussing
4
#BinanceWillListPredictPREDICT
14,603 views
414 Discussing
5
#SwitzerlandFirstSpotBitcoinETFExpectedToTradeInNovember
918 views
52 Discussing
6
#StrategyReports$21BQ3OperatingProfit
860 views
38 Discussing
7
#TwoAddressesHoldingAbout1.28BUSDTFrozen
5,407 views
214 Discussing
8
#FirstDigitalBlacklistsAttackerAddressHoldingAbout3.4MFDUSD
274 views
13 Discussing
9
#BitcoinDropsBelow$80K
62,963 views
162 Discussing
10
#BoEOpensConsultationOnTokenizedCollateralForClearing
2,240 views
50 Discussing