
#epicfail
epicfail
55,367 views
15 Discussing
Hot
Latest

·
--
Bullish
$EPIC
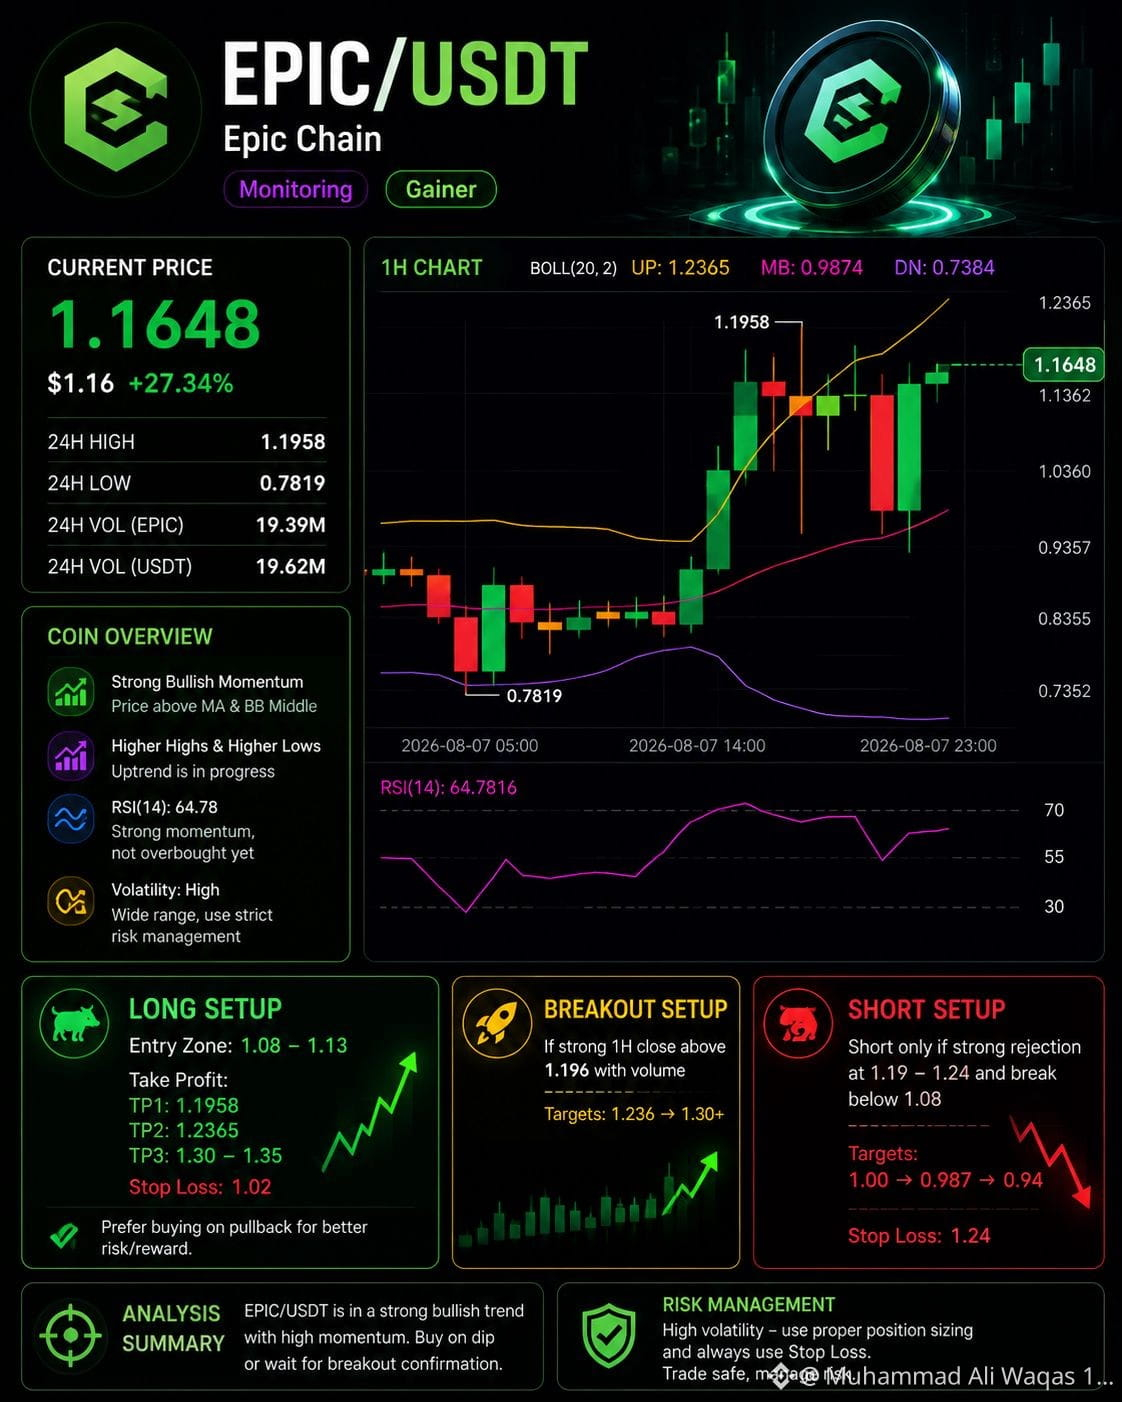
Current price: $1.1648
24H change: +27.34%
24H high: $1.1958
24H low: $0.7819
RSI(14): 64.78
Bollinger Bands: Upper $1.2365 | Middle $0.9874 | Lower $0.7384
🟢 Bias: LONG — preferably on a pullback
EPIC is showing a strong bullish structure on the 1H chart. Price is above the Bollinger middle band and making higher highs/higher lows. RSI at 64.8 confirms strong momentum without being deeply overbought yet.
However, price is close to the $1.1958 resistance/high, so chasing at $1.16+ has increased risk.
🔥 LONG Setup
Entry: $1.08 – $1.13
TP1: $1.195
TP2: $1.236
TP3: $1.30 – $1.35
Stop Loss: $1.02
Breakout setup: If EPIC gets a strong 1H close above $1.196 with good volume, a continuation toward $1.236–$1.30 becomes more likely.
🔴 When to consider SHORT
A short becomes interesting only if EPIC strongly rejects $1.19–$1.24 and then loses $1.08, especially with increasing selling volume.
Potential downside targets: $1.00 → $0.987 → $0.94.
🎯 Final view
LONG 🟢 > SHORT 🔴
I would not chase the current candle after a +27% move. The better risk/reward is a pullback toward $1.08–$1.13, or a confirmed breakout above $1.196.
Technical setup only—not financial advice. Use disciplined position sizing and a stop-loss.
{future}(EPICUSDT)
#epicfail
#EPICUSDT
$EPIC
Current price: $1.1648
24H change: +27.34%
24H high: $1.1958
24H low: $0.7819
RSI(14): 64.78
Bollinger Bands: Upper $1.2365 | Middle $0.9874 | Lower $0.7384
🟢 Bias: LONG — preferably on a pullback
EPIC is showing a strong bullish structure on the 1H chart. Price is above the Bollinger middle band and making higher highs/higher lows. RSI at 64.8 confirms strong momentum without being deeply overbought yet.
However, price is close to the $1.1958 resistance/high, so chasing at $1.16+ has increased risk.
🔥 LONG Setup
Entry: $1.08 – $1.13
TP1: $1.195
TP2: $1.236
TP3: $1.30 – $1.35
Stop Loss: $1.02
Breakout setup: If EPIC gets a strong 1H close above $1.196 with good volume, a continuation toward $1.236–$1.30 becomes more likely.
🔴 When to consider SHORT
A short becomes interesting only if EPIC strongly rejects $1.19–$1.24 and then loses $1.08, especially with increasing selling volume.
Potential downside targets: $1.00 → $0.987 → $0.94.
🎯 Final view
LONG 🟢 > SHORT 🔴
I would not chase the current candle after a +27% move. The better risk/reward is a pullback toward $1.08–$1.13, or a confirmed breakout above $1.196.
Technical setup only—not financial advice. Use disciplined position sizing and a stop-loss.
#epicfail
#EPICUSDT
Current price: $1.1648
24H change: +27.34%
24H high: $1.1958
24H low: $0.7819
RSI(14): 64.78
Bollinger Bands: Upper $1.2365 | Middle $0.9874 | Lower $0.7384
🟢 Bias: LONG — preferably on a pullback
EPIC is showing a strong bullish structure on the 1H chart. Price is above the Bollinger middle band and making higher highs/higher lows. RSI at 64.8 confirms strong momentum without being deeply overbought yet.
However, price is close to the $1.1958 resistance/high, so chasing at $1.16+ has increased risk.
🔥 LONG Setup
Entry: $1.08 – $1.13
TP1: $1.195
TP2: $1.236
TP3: $1.30 – $1.35
Stop Loss: $1.02
Breakout setup: If EPIC gets a strong 1H close above $1.196 with good volume, a continuation toward $1.236–$1.30 becomes more likely.
🔴 When to consider SHORT
A short becomes interesting only if EPIC strongly rejects $1.19–$1.24 and then loses $1.08, especially with increasing selling volume.
Potential downside targets: $1.00 → $0.987 → $0.94.
🎯 Final view
LONG 🟢 > SHORT 🔴
I would not chase the current candle after a +27% move. The better risk/reward is a pullback toward $1.08–$1.13, or a confirmed breakout above $1.196.
Technical setup only—not financial advice. Use disciplined position sizing and a stop-loss.
#epicfail
#EPICUSDT
107


·
--
Bearish
😱 Can You Believe This?! 🤯
Just 4 years ago, someone bought this picture 🖼️ (NFT) for a whopping $69 MILLION 💸💎
Today... it’s worth less than $100 💀📉
But seriously... how can someone spend money like THIS?! 🧐💭
#NFT #CryptoHistory #EpicFail #DigitalArt #TradersLeague
$BNB $BTC $ETH
😱 Can You Believe This?! 🤯
Just 4 years ago, someone bought this picture 🖼️ (NFT) for a whopping $69 MILLION 💸💎
Today... it’s worth less than $100 💀📉
But seriously... how can someone spend money like THIS?! 🧐💭
#NFT #CryptoHistory #EpicFail #DigitalArt #TradersLeague
$BNB $BTC $ETH
Just 4 years ago, someone bought this picture 🖼️ (NFT) for a whopping $69 MILLION 💸💎
Today... it’s worth less than $100 💀📉
But seriously... how can someone spend money like THIS?! 🧐💭
#NFT #CryptoHistory #EpicFail #DigitalArt #TradersLeague
$BNB $BTC $ETH

5
4
10
30.8k

$SNDK is showing strong momentum and remains an interesting asset to watch as semiconductor demand stays strong. $EPIC is also attracting attention as its RWA-focused ecosystem develops, but volatility remains high.$TSLA remains a high-volatility play, with the latest Cybercab developments creating both growth potential and regulatory risks.
#SNDK #Epic #TSLA #epicfail #tslauadt
{stock_us}(SNDK.US)
{spot}(EPICUSDT)
{stock_us}(TSLA.US)
$SNDK is showing strong momentum and remains an interesting asset to watch as semiconductor demand stays strong. $EPIC is also attracting attention as its RWA-focused ecosystem develops, but volatility remains high.$TSLA remains a high-volatility play, with the latest Cybercab developments creating both growth potential and regulatory risks.
#SNDK #Epic #TSLA #epicfail #tslauadt
#SNDK #Epic #TSLA #epicfail #tslauadt

1
1
1.4k

EPIC Surges Post-Support Test! Will the Layer 1 Payments Narrative Push Prices Past $0.85?
The Analysis: Epic Chain ($EPIC
{spot}(EPICUSDT)
) is putting on a powerful display of technical resilience, breaking away from its local corrective lows near $0.194 to trade aggressively around the $0.51–$0.64 horizontal node as buyers flood back into the network.
The Alpha: The fundamental and technical catalysts behind EPIC are scaling in tandem. Following a successful defense of its historical baseline, trading charts show a clean sequence of higher lows backed by a massive spike in 24-hour spot volume. With moving averages converging directly below the current price to act as a dynamic launchpad, a clean four-hour candle close above the $0.68 resistance block opens a clear structural runway toward $0.85 and $0.96.
The Trade: Avoid chasing vertical green candles. The professional play is to look for entries during a minor pullback toward the newly established structural floor at the $0.48–$0.52 entry window. Set defensive parameters strictly beneath the weekly support shelf.
EPIC is clearly front-running the broader market's payment sector momentum today. Are you riding the wave or watching from the sidelines? 👇
#epicfail #EpicChain #Layer1 #CryptoBreakout
EPIC Surges Post-Support Test! Will the Layer 1 Payments Narrative Push Prices Past $0.85?
The Analysis: Epic Chain ($EPIC
) is putting on a powerful display of technical resilience, breaking away from its local corrective lows near $0.194 to trade aggressively around the $0.51–$0.64 horizontal node as buyers flood back into the network.
The Alpha: The fundamental and technical catalysts behind EPIC are scaling in tandem. Following a successful defense of its historical baseline, trading charts show a clean sequence of higher lows backed by a massive spike in 24-hour spot volume. With moving averages converging directly below the current price to act as a dynamic launchpad, a clean four-hour candle close above the $0.68 resistance block opens a clear structural runway toward $0.85 and $0.96.
The Trade: Avoid chasing vertical green candles. The professional play is to look for entries during a minor pullback toward the newly established structural floor at the $0.48–$0.52 entry window. Set defensive parameters strictly beneath the weekly support shelf.
EPIC is clearly front-running the broader market's payment sector momentum today. Are you riding the wave or watching from the sidelines? 👇
#epicfail #EpicChain #Layer1 #CryptoBreakout
The Analysis: Epic Chain ($EPIC
) is putting on a powerful display of technical resilience, breaking away from its local corrective lows near $0.194 to trade aggressively around the $0.51–$0.64 horizontal node as buyers flood back into the network.
The Alpha: The fundamental and technical catalysts behind EPIC are scaling in tandem. Following a successful defense of its historical baseline, trading charts show a clean sequence of higher lows backed by a massive spike in 24-hour spot volume. With moving averages converging directly below the current price to act as a dynamic launchpad, a clean four-hour candle close above the $0.68 resistance block opens a clear structural runway toward $0.85 and $0.96.
The Trade: Avoid chasing vertical green candles. The professional play is to look for entries during a minor pullback toward the newly established structural floor at the $0.48–$0.52 entry window. Set defensive parameters strictly beneath the weekly support shelf.
EPIC is clearly front-running the broader market's payment sector momentum today. Are you riding the wave or watching from the sidelines? 👇
#epicfail #EpicChain #Layer1 #CryptoBreakout
1
68
Log in to explore more content
Join global crypto users on Binance Square
⚡️ Get latest and useful information about crypto.
💬 Trusted by the world’s largest crypto exchange.
👍 Discover real insights from verified creators.
Email / Phone number
Trending Topics
1
#BTCRebounds80K
456 views
101 Discussing
2
#Binance98PercentReplenished
2,401 views
208 Discussing
3
#USMidterms-WhatAreMarketsExpecting?
207,898 views
1,641 Discussing
4
#USOctoberNFP-AreRateCutsStillPossible
318,698 views
2,537 Discussing
5
#AMDBeatsExpectations-AINarrativeContinues
57,381 views
621 Discussing
6
#CircleQ3Revenue865M
10,848 views
317 Discussing
7
#BinanceIncidentReport
388,655 views
1,904 Discussing
8
#USStocksOpenHigherAsDowGains1.9%
588 views
40 Discussing
9
#ADPUSPrivateEmployersAdd86000JobsInOctober
241 views
22 Discussing
10
#FrenchAssemblyPassesSelfCustodiedCryptoReportingAmendment
310 views
12 Discussing