

#bitcoinspotetfsnetinflow
bitcoinspotetfsnetinflow
1,476 views
86 Discussing
Hot
Latest

If you are still treating daily ETF flow prints like immediate 5-minute scalping signals, stop now.
Most traders get chopped up obsessing over overnight numbers, buying every green print only to end up holding bags when market makers rebalance and front-run the retail crowd.
We watched the exact same playbook unfold with $BTC back during the early futures launch and previous cycle transitions. When spot desk demand heats up, liquidity rotates differently than during pure retail-driven frenzies. Instead of instant parabolic runs across every alt, institutional absorption tends to quietly suck liquidity from high-beta plays like $OP and $SUI before broader market expansion even begins.
The real difference today is structural. Institutional capital does not trade momentum the way crypto natives do, meaning sustained accumulation often looks painfully boring right up until supply thins out completely.
Are you positioning for structural rotation or still trying to front-run the daily ETF scoreboard?
#BitcoinSpotETFsNetInflow #BitcoinSpotETFsTurnNetPositiveYTD
If you are still treating daily ETF flow prints like immediate 5-minute scalping signals, stop now.
Most traders get chopped up obsessing over overnight numbers, buying every green print only to end up holding bags when market makers rebalance and front-run the retail crowd.
We watched the exact same playbook unfold with $BTC back during the early futures launch and previous cycle transitions. When spot desk demand heats up, liquidity rotates differently than during pure retail-driven frenzies. Instead of instant parabolic runs across every alt, institutional absorption tends to quietly suck liquidity from high-beta plays like $OP and $SUI before broader market expansion even begins.
The real difference today is structural. Institutional capital does not trade momentum the way crypto natives do, meaning sustained accumulation often looks painfully boring right up until supply thins out completely.
Are you positioning for structural rotation or still trying to front-run the daily ETF scoreboard?
#BitcoinSpotETFsNetInflow #BitcoinSpotETFsTurnNetPositiveYTD
Most traders get chopped up obsessing over overnight numbers, buying every green print only to end up holding bags when market makers rebalance and front-run the retail crowd.
We watched the exact same playbook unfold with $BTC back during the early futures launch and previous cycle transitions. When spot desk demand heats up, liquidity rotates differently than during pure retail-driven frenzies. Instead of instant parabolic runs across every alt, institutional absorption tends to quietly suck liquidity from high-beta plays like $OP and $SUI before broader market expansion even begins.
The real difference today is structural. Institutional capital does not trade momentum the way crypto natives do, meaning sustained accumulation often looks painfully boring right up until supply thins out completely.
Are you positioning for structural rotation or still trying to front-run the daily ETF scoreboard?
#BitcoinSpotETFsNetInflow #BitcoinSpotETFsTurnNetPositiveYTD

9
Have you noticed that Bitcoin spot ETFs have turned net positive year-to-date while everyone is still hunting for the next altcoin runner?
Traders keep losing money chasing pumps in names like $SUI because they ignore where real capital is actually moving. Greed sitting at 72 only makes the FOMO worse and the exits messier.
The flip in ETF flows is not some minor stat. Institutions have been buying $BTC consistently enough to put the entire year in the green after earlier outflows. This happens while retail stares at charts of whatever is trending that hour. The numbers are public and they have been flashing accumulation for weeks.
Watch the daily ETF inflow reports before you even open the price chart. Add to $BTC on those net positive days instead of waiting for a breakout that everyone else sees too late. Park some dry powder in $USDT so you can buy the dips that always follow when the greed index gets this elevated.
What's your take on how far this institutional buying can push things from here?
#BitcoinSpotETFsTurnNetPositiveYTD #BitcoinSpotETFsNetInflow
Have you noticed that Bitcoin spot ETFs have turned net positive year-to-date while everyone is still hunting for the next altcoin runner?
Traders keep losing money chasing pumps in names like $SUI because they ignore where real capital is actually moving. Greed sitting at 72 only makes the FOMO worse and the exits messier.
The flip in ETF flows is not some minor stat. Institutions have been buying $BTC consistently enough to put the entire year in the green after earlier outflows. This happens while retail stares at charts of whatever is trending that hour. The numbers are public and they have been flashing accumulation for weeks.
Watch the daily ETF inflow reports before you even open the price chart. Add to $BTC on those net positive days instead of waiting for a breakout that everyone else sees too late. Park some dry powder in $USDT so you can buy the dips that always follow when the greed index gets this elevated.
What's your take on how far this institutional buying can push things from here?
#BitcoinSpotETFsTurnNetPositiveYTD #BitcoinSpotETFsNetInflow
Traders keep losing money chasing pumps in names like $SUI because they ignore where real capital is actually moving. Greed sitting at 72 only makes the FOMO worse and the exits messier.
The flip in ETF flows is not some minor stat. Institutions have been buying $BTC consistently enough to put the entire year in the green after earlier outflows. This happens while retail stares at charts of whatever is trending that hour. The numbers are public and they have been flashing accumulation for weeks.
Watch the daily ETF inflow reports before you even open the price chart. Add to $BTC on those net positive days instead of waiting for a breakout that everyone else sees too late. Park some dry powder in $USDT so you can buy the dips that always follow when the greed index gets this elevated.
What's your take on how far this institutional buying can push things from here?
#BitcoinSpotETFsTurnNetPositiveYTD #BitcoinSpotETFsNetInflow

1
38

·
--
If you are still shorting every push because you think institutional demand has dried up, stop now.
Most traders keep losing money trying to front-run a macro reversal, only to miss clean trend entries while getting chopped up in choppy ranges.
The debate right now is completely divided. One side argues that retail exhaustion and capital rotating into altcoins like $OP and $SUI means the top is heavy and momentum will stall out. They view recent inflows as temporary rebalancing rather than genuine conviction.
I take the opposite view. Spot ETF flows flipping net positive year-to-date confirms that structural capital is consistently absorbing sell-side pressure on $BTC. When institutional backing establishes this kind of floor, relying on retail cycle timing to pick your exits usually ends up in missed upside.
Do you see this institutional inflow holding through the coming weeks, or are we just walking into another distribution trap?
#BitcoinSpotETFsTurnNetPositiveYTD #BitcoinSpotETFsNetInflow
If you are still shorting every push because you think institutional demand has dried up, stop now.
Most traders keep losing money trying to front-run a macro reversal, only to miss clean trend entries while getting chopped up in choppy ranges.
The debate right now is completely divided. One side argues that retail exhaustion and capital rotating into altcoins like $OP and $SUI means the top is heavy and momentum will stall out. They view recent inflows as temporary rebalancing rather than genuine conviction.
I take the opposite view. Spot ETF flows flipping net positive year-to-date confirms that structural capital is consistently absorbing sell-side pressure on $BTC . When institutional backing establishes this kind of floor, relying on retail cycle timing to pick your exits usually ends up in missed upside.
Do you see this institutional inflow holding through the coming weeks, or are we just walking into another distribution trap?
#BitcoinSpotETFsTurnNetPositiveYTD #BitcoinSpotETFsNetInflow
Most traders keep losing money trying to front-run a macro reversal, only to miss clean trend entries while getting chopped up in choppy ranges.
The debate right now is completely divided. One side argues that retail exhaustion and capital rotating into altcoins like $OP and $SUI means the top is heavy and momentum will stall out. They view recent inflows as temporary rebalancing rather than genuine conviction.
I take the opposite view. Spot ETF flows flipping net positive year-to-date confirms that structural capital is consistently absorbing sell-side pressure on $BTC . When institutional backing establishes this kind of floor, relying on retail cycle timing to pick your exits usually ends up in missed upside.
Do you see this institutional inflow holding through the coming weeks, or are we just walking into another distribution trap?
#BitcoinSpotETFsTurnNetPositiveYTD #BitcoinSpotETFsNetInflow

83

·
--
#BitcoinSpotETFsNetInflo $191M
💰 $191M ETF INFLOW - Institutional Money Flowing Into Bitcoin!
Wall Street is buying Bitcoin like never before! $191 Million in one day!
Institutional capital, pension funds, hedge funds - everyone is moving into $BTC.
This is just the start! 🚀
$BTC #BitcoinSpotETFsNetInflow $191M #ETF
#BitcoinSpotETFsNetInflo $191M
💰 $191M ETF INFLOW - Institutional Money Flowing Into Bitcoin!
Wall Street is buying Bitcoin like never before! $191 Million in one day!
Institutional capital, pension funds, hedge funds - everyone is moving into $BTC .
This is just the start! 🚀
$BTC #BitcoinSpotETFsNetInflow $191M #ETF
💰 $191M ETF INFLOW - Institutional Money Flowing Into Bitcoin!
Wall Street is buying Bitcoin like never before! $191 Million in one day!
Institutional capital, pension funds, hedge funds - everyone is moving into $BTC .
This is just the start! 🚀
$BTC #BitcoinSpotETFsNetInflow $191M #ETF

3
28

🚀 The influx of $191M into Bitcoin spot ETFs is a game changer! This surge signals institutional interest and could ignite a bullish sentiment for $BTC. Are we on the cusp of a major market shift? 💥 What do you think will be the next move? #BitcoinSpotETFsNetInflow$191M
❤️ Si te gustó, dale like y síguenos para el próximo análisis!
🚀 The influx of $191M into Bitcoin spot ETFs is a game changer! This surge signals institutional interest and could ignite a bullish sentiment for $BTC . Are we on the cusp of a major market shift? 💥 What do you think will be the next move? #BitcoinSpotETFsNetInflow$191M
❤️ Si te gustó, dale like y síguenos para el próximo análisis!
❤️ Si te gustó, dale like y síguenos para el próximo análisis!
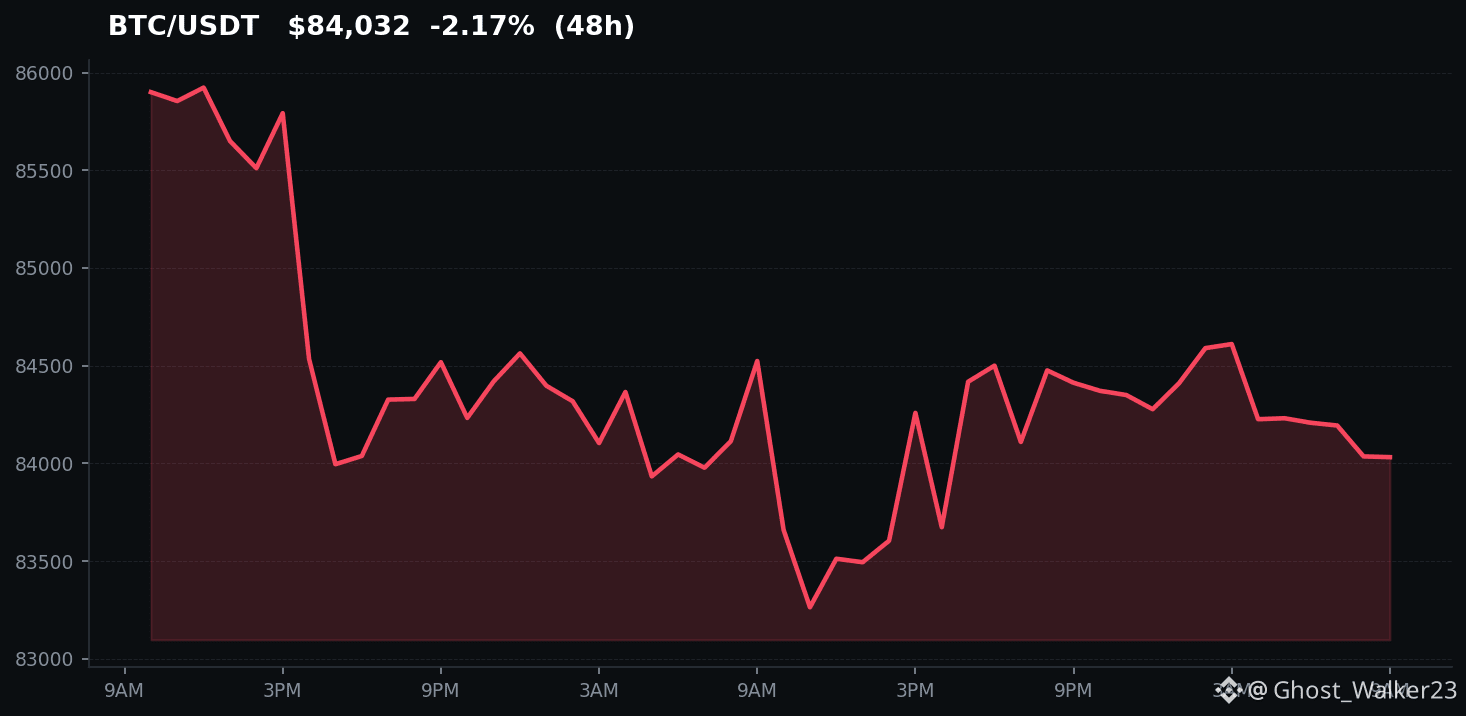

Bitcoin Spot ETFs experienced a significant net inflow of $191 million, signaling renewed investor confidence and demand for direct Bitcoin exposure through regulated products. This positive inflow suggests that despite market volatility, institutional and retail investors are actively participating, viewing these ETFs as a key gateway to the digital asset class. The trend indicates a potential strengthening of market sentiment and could influence Bitcoin's price trajectory as demand continues to build.
This inflow highlights the growing acceptance and integration of Bitcoin into traditional financial markets. The sustained interest in spot ETFs underscores their role in providing accessibility and legitimacy to Bitcoin investment.
Disclaimer: This content is for informational purposes only and does not constitute investment advice. Trading cryptocurrencies involves significant risk.
#BitcoinSpotETFsNetInflow$191M $BTC
Bitcoin Spot ETFs experienced a significant net inflow of $191 million, signaling renewed investor confidence and demand for direct Bitcoin exposure through regulated products. This positive inflow suggests that despite market volatility, institutional and retail investors are actively participating, viewing these ETFs as a key gateway to the digital asset class. The trend indicates a potential strengthening of market sentiment and could influence Bitcoin's price trajectory as demand continues to build.
This inflow highlights the growing acceptance and integration of Bitcoin into traditional financial markets. The sustained interest in spot ETFs underscores their role in providing accessibility and legitimacy to Bitcoin investment.
Disclaimer: This content is for informational purposes only and does not constitute investment advice. Trading cryptocurrencies involves significant risk.
#BitcoinSpotETFsNetInflow$191M $BTC
This inflow highlights the growing acceptance and integration of Bitcoin into traditional financial markets. The sustained interest in spot ETFs underscores their role in providing accessibility and legitimacy to Bitcoin investment.
Disclaimer: This content is for informational purposes only and does not constitute investment advice. Trading cryptocurrencies involves significant risk.
#BitcoinSpotETFsNetInflow$191M $BTC
25

·
--
BTC spot ETF saw net inflow of about $191 million in a single day|The new trading day’s fund flow table is still missing data|Around 83.8k I’ll defend first
My stance is not to chase a single-line narrative of “ETF inflows guarantee price goes up.” When #BitcoinSpotETFsNetInflow$191M appeared on Binance Square’s hot list, I checked Farside’s U.S. spot Bitcoin ETF daily table. As of September 24, total net inflow was $190.7 million: IBIT accounted for $162.6 million and FBTC $12.9 million. This is an estimate of funds based on each fund’s share subscription/redemption figures for that day; it cannot be said that at the same moment $190.7 million was directly swept from the exchange, and you also cannot apply it to September 25.
Especially pay attention to the data timestamp: as of when I’m writing, in Farside’s September 25 row, each fund still shows a dash, and the final auto-total is 0.0. A dash means it hasn’t been listed yet—not that there were “no inflows for the day,” and not that “funds suddenly went to zero.” Yesterday’s daily report can show that demand was present on the prior trading day, but whether it continues into the new trading day must wait until all parties’ data are filled in before judging. If the market treats the missing 0.0 as a real outflow or zero inflow, the trading plan will be built on wrong assumptions.
Why does this relate to BTC? ETFs provide a regulated exposure channel for traditional accounts. Continuous subscriptions can affect the creation of fund shares in the primary market and expectations for spot demand; however, volatility in the secondary market is also influenced by macro interest rates, the U.S. dollar, options expiration, and leveraged positioning. Right now Kraken’s latest BTC/USD is about $83,811, with an opening around $84,380 over the last 24 hours. The high is $85,247 and the low $83,164; relative to the open, price is weaker. The fact that the previous day’s net inflows and today’s pullback can both be true indicates you can’t use a single piece of good news to confirm price, and you can’t simply blame the pullback on the ETF.
If I were trading myself, I’m not participating. My bias is neutral for now, with position size at 0%. Only if the ETF data for September 25 is actually updated and still positive, and then BTC regains above 85,250 on a full set of 15-minute candles and doesn’t break back down, would I consider testing a long position with at most 2% of total funds. The initial target is 86,500; once hit, I halve. The remaining position would look toward 87,800 and then close the trade. If after entry price drops back below 84,200, I’ll stop out and close. If it first breaks below 83,150, the long thesis is invalidated and I’ll continue to stay flat with no position. If the fund-flow table updates to negative, even if price rebounds briefly, I won’t add based on “yesterday’s inflow,” and I also won’t use high leverage.
Source: Farside daily ETF fund flow table, Kraken BTC/USD spot quote. #BitcoinSpotETFsNetInflow$191M #BTC
The above is only my personal market observations and does not constitute investment advice.
BTC spot ETF saw net inflow of about $191 million in a single day|The new trading day’s fund flow table is still missing data|Around 83.8k I’ll defend first
My stance is not to chase a single-line narrative of “ETF inflows guarantee price goes up.” When #BitcoinSpotETFsNetInflow$191M appeared on Binance Square’s hot list, I checked Farside’s U.S. spot Bitcoin ETF daily table. As of September 24, total net inflow was $190.7 million: IBIT accounted for $162.6 million and FBTC $12.9 million. This is an estimate of funds based on each fund’s share subscription/redemption figures for that day; it cannot be said that at the same moment $190.7 million was directly swept from the exchange, and you also cannot apply it to September 25.
Especially pay attention to the data timestamp: as of when I’m writing, in Farside’s September 25 row, each fund still shows a dash, and the final auto-total is 0.0. A dash means it hasn’t been listed yet—not that there were “no inflows for the day,” and not that “funds suddenly went to zero.” Yesterday’s daily report can show that demand was present on the prior trading day, but whether it continues into the new trading day must wait until all parties’ data are filled in before judging. If the market treats the missing 0.0 as a real outflow or zero inflow, the trading plan will be built on wrong assumptions.
Why does this relate to BTC? ETFs provide a regulated exposure channel for traditional accounts. Continuous subscriptions can affect the creation of fund shares in the primary market and expectations for spot demand; however, volatility in the secondary market is also influenced by macro interest rates, the U.S. dollar, options expiration, and leveraged positioning. Right now Kraken’s latest BTC/USD is about $83,811, with an opening around $84,380 over the last 24 hours. The high is $85,247 and the low $83,164; relative to the open, price is weaker. The fact that the previous day’s net inflows and today’s pullback can both be true indicates you can’t use a single piece of good news to confirm price, and you can’t simply blame the pullback on the ETF.
If I were trading myself, I’m not participating. My bias is neutral for now, with position size at 0%. Only if the ETF data for September 25 is actually updated and still positive, and then BTC regains above 85,250 on a full set of 15-minute candles and doesn’t break back down, would I consider testing a long position with at most 2% of total funds. The initial target is 86,500; once hit, I halve. The remaining position would look toward 87,800 and then close the trade. If after entry price drops back below 84,200, I’ll stop out and close. If it first breaks below 83,150, the long thesis is invalidated and I’ll continue to stay flat with no position. If the fund-flow table updates to negative, even if price rebounds briefly, I won’t add based on “yesterday’s inflow,” and I also won’t use high leverage.
Source: Farside daily ETF fund flow table, Kraken BTC/USD spot quote. #BitcoinSpotETFsNetInflow$191M #BTC
The above is only my personal market observations and does not constitute investment advice.
My stance is not to chase a single-line narrative of “ETF inflows guarantee price goes up.” When #BitcoinSpotETFsNetInflow$191M appeared on Binance Square’s hot list, I checked Farside’s U.S. spot Bitcoin ETF daily table. As of September 24, total net inflow was $190.7 million: IBIT accounted for $162.6 million and FBTC $12.9 million. This is an estimate of funds based on each fund’s share subscription/redemption figures for that day; it cannot be said that at the same moment $190.7 million was directly swept from the exchange, and you also cannot apply it to September 25.
Especially pay attention to the data timestamp: as of when I’m writing, in Farside’s September 25 row, each fund still shows a dash, and the final auto-total is 0.0. A dash means it hasn’t been listed yet—not that there were “no inflows for the day,” and not that “funds suddenly went to zero.” Yesterday’s daily report can show that demand was present on the prior trading day, but whether it continues into the new trading day must wait until all parties’ data are filled in before judging. If the market treats the missing 0.0 as a real outflow or zero inflow, the trading plan will be built on wrong assumptions.
Why does this relate to BTC? ETFs provide a regulated exposure channel for traditional accounts. Continuous subscriptions can affect the creation of fund shares in the primary market and expectations for spot demand; however, volatility in the secondary market is also influenced by macro interest rates, the U.S. dollar, options expiration, and leveraged positioning. Right now Kraken’s latest BTC/USD is about $83,811, with an opening around $84,380 over the last 24 hours. The high is $85,247 and the low $83,164; relative to the open, price is weaker. The fact that the previous day’s net inflows and today’s pullback can both be true indicates you can’t use a single piece of good news to confirm price, and you can’t simply blame the pullback on the ETF.
If I were trading myself, I’m not participating. My bias is neutral for now, with position size at 0%. Only if the ETF data for September 25 is actually updated and still positive, and then BTC regains above 85,250 on a full set of 15-minute candles and doesn’t break back down, would I consider testing a long position with at most 2% of total funds. The initial target is 86,500; once hit, I halve. The remaining position would look toward 87,800 and then close the trade. If after entry price drops back below 84,200, I’ll stop out and close. If it first breaks below 83,150, the long thesis is invalidated and I’ll continue to stay flat with no position. If the fund-flow table updates to negative, even if price rebounds briefly, I won’t add based on “yesterday’s inflow,” and I also won’t use high leverage.
Source: Farside daily ETF fund flow table, Kraken BTC/USD spot quote. #BitcoinSpotETFsNetInflow$191M #BTC
The above is only my personal market observations and does not constitute investment advice.

8

·
--
Latest data shows that at a certain point, Bitcoin spot ETFs recorded a net inflow of $19.1 billion, reflecting a significant increase in market acceptance of crypto assets. I believe this trend will continue because institutional investors are gradually recognizing Bitcoin’s potential as a store of value and an investment portfolio diversification tool. In addition, the gradual easing of related regulations by the U.S. Securities and Exchange Commission (SEC) provides policy support for market growth. With more tools and capital flowing in, net inflows into Bitcoin spot ETFs are expected to remain strong. #BitcoinSpotETFsNetInflow
#BitcoinSpotETFsNetInflow$191M #BTC
Latest data shows that at a certain point, Bitcoin spot ETFs recorded a net inflow of $19.1 billion, reflecting a significant increase in market acceptance of crypto assets. I believe this trend will continue because institutional investors are gradually recognizing Bitcoin’s potential as a store of value and an investment portfolio diversification tool. In addition, the gradual easing of related regulations by the U.S. Securities and Exchange Commission (SEC) provides policy support for market growth. With more tools and capital flowing in, net inflows into Bitcoin spot ETFs are expected to remain strong. #BitcoinSpotETFsNetInflow
#BitcoinSpotETFsNetInflow$191M #BTC
#BitcoinSpotETFsNetInflow$191M #BTC

📰 ETF suddenly surges by $3.1 billion? Why hasn’t Bitcoin “caught the ride” yet—are these inflows a long-term signal?
In the first 18 days of September, U.S. Spot Bitcoin ETFs raked in a net inflow of $3.1 billion, setting a new historical record. Most of this money comes from international investors. It suggests that as institutional entry barriers have lowered, global capital is accelerating its allocation to Bitcoin. Although ETF holdings are still less than 5% of Bitcoin’s total market value, this pace is enough to support the BTC price in the short term and shift the flow of funds in parts of the market.
Why is this news important?
The real significance of these ETF inflows is that they change investment expectations. In the past, institutional allocation to crypto assets mainly relied on CME futures and over-the-counter derivatives, while ETFs provide transparency similar to S&P 500 index constituents. Currently, inflows of $1.8 billion have already far exceeded the pace during the same period after the first ETF approvals in January 2024 (when it was under $500 million). This implies that capital’s attitude toward crypto is shifting from a “speculative instrument” toward “alternative asset allocation.”
The cross-border nature of ETF flows is worth watching. The inflows mainly come from crypto-active markets such as South Korea and Singapore—regions where institutional investors are more adept at handling assets that trade 24/7 without market closures. South Korea is among the world’s most active crypto trading markets. Local capital withdrawing from other crypto assets and flowing into ETFs → directly supports BTC price.
Market impact
The impact on BTC can be viewed in two stages: short term and mid term. In the short term, ETF inflows will likely lift the BTC price directly through algorithmic trading. By early October, BTC may test the $83,000 resistance level. In the medium to long term, this process could accelerate the steps for Bitcoin to be included as a reserve asset by some sovereign nations—currently, Norway has asked its central bank to study the possibility of Bitcoin as a reserve currency.
A comparable historical event is the 2017 ETH ICO phase. At that time, institutional capital also entered gradually via over-the-counter derivatives, but the transparency of ETFs may make the current process more controllable. If a clear signal emerges in the future—such as the Fed including Bitcoin in a quantitative easing asset pool—then the scale of net ETF inflows could surpass $5 billion per month.
Trading approach
💡 Expect BTC to test $83,000 over the next 24 hours—this level is the key indicator of whether ETF funds can hold their ground. If it breaks through this resistance, ETF net inflows may keep accelerating, because it would mean more traditional funds have started allocating. If it falls below $82,500, then the long-term allocation significance of the ETFs would come into question. If the U.S. begins tightening overseas regulatory oversight of capital flows for cryptocurrencies, this assessment would be invalid.
【Conditions that void the assessment】If the U.S. begins tightening overseas regulatory oversight of capital flows for cryptocurrencies, this assessment would be invalid.
This article is not sponsored by any project. The author does not hold the assets mentioned.
⚠️ Not investment advice; forecasts are for reference only
#BitcoinSpotETFsNetInflow$159M
$ETH $BTC
📰 ETF suddenly surges by $3.1 billion? Why hasn’t Bitcoin “caught the ride” yet—are these inflows a long-term signal?
In the first 18 days of September, U.S. Spot Bitcoin ETFs raked in a net inflow of $3.1 billion, setting a new historical record. Most of this money comes from international investors. It suggests that as institutional entry barriers have lowered, global capital is accelerating its allocation to Bitcoin. Although ETF holdings are still less than 5% of Bitcoin’s total market value, this pace is enough to support the BTC price in the short term and shift the flow of funds in parts of the market.
Why is this news important?
The real significance of these ETF inflows is that they change investment expectations. In the past, institutional allocation to crypto assets mainly relied on CME futures and over-the-counter derivatives, while ETFs provide transparency similar to S&P 500 index constituents. Currently, inflows of $1.8 billion have already far exceeded the pace during the same period after the first ETF approvals in January 2024 (when it was under $500 million). This implies that capital’s attitude toward crypto is shifting from a “speculative instrument” toward “alternative asset allocation.”
The cross-border nature of ETF flows is worth watching. The inflows mainly come from crypto-active markets such as South Korea and Singapore—regions where institutional investors are more adept at handling assets that trade 24/7 without market closures. South Korea is among the world’s most active crypto trading markets. Local capital withdrawing from other crypto assets and flowing into ETFs → directly supports BTC price.
Market impact
The impact on BTC can be viewed in two stages: short term and mid term. In the short term, ETF inflows will likely lift the BTC price directly through algorithmic trading. By early October, BTC may test the $83,000 resistance level. In the medium to long term, this process could accelerate the steps for Bitcoin to be included as a reserve asset by some sovereign nations—currently, Norway has asked its central bank to study the possibility of Bitcoin as a reserve currency.
A comparable historical event is the 2017 ETH ICO phase. At that time, institutional capital also entered gradually via over-the-counter derivatives, but the transparency of ETFs may make the current process more controllable. If a clear signal emerges in the future—such as the Fed including Bitcoin in a quantitative easing asset pool—then the scale of net ETF inflows could surpass $5 billion per month.
Trading approach
💡 Expect BTC to test $83,000 over the next 24 hours—this level is the key indicator of whether ETF funds can hold their ground. If it breaks through this resistance, ETF net inflows may keep accelerating, because it would mean more traditional funds have started allocating. If it falls below $82,500, then the long-term allocation significance of the ETFs would come into question. If the U.S. begins tightening overseas regulatory oversight of capital flows for cryptocurrencies, this assessment would be invalid.
【Conditions that void the assessment】If the U.S. begins tightening overseas regulatory oversight of capital flows for cryptocurrencies, this assessment would be invalid.
This article is not sponsored by any project. The author does not hold the assets mentioned.
⚠️ Not investment advice; forecasts are for reference only
#BitcoinSpotETFsNetInflow$159M
$ETH $BTC
In the first 18 days of September, U.S. Spot Bitcoin ETFs raked in a net inflow of $3.1 billion, setting a new historical record. Most of this money comes from international investors. It suggests that as institutional entry barriers have lowered, global capital is accelerating its allocation to Bitcoin. Although ETF holdings are still less than 5% of Bitcoin’s total market value, this pace is enough to support the BTC price in the short term and shift the flow of funds in parts of the market.
Why is this news important?
The real significance of these ETF inflows is that they change investment expectations. In the past, institutional allocation to crypto assets mainly relied on CME futures and over-the-counter derivatives, while ETFs provide transparency similar to S&P 500 index constituents. Currently, inflows of $1.8 billion have already far exceeded the pace during the same period after the first ETF approvals in January 2024 (when it was under $500 million). This implies that capital’s attitude toward crypto is shifting from a “speculative instrument” toward “alternative asset allocation.”
The cross-border nature of ETF flows is worth watching. The inflows mainly come from crypto-active markets such as South Korea and Singapore—regions where institutional investors are more adept at handling assets that trade 24/7 without market closures. South Korea is among the world’s most active crypto trading markets. Local capital withdrawing from other crypto assets and flowing into ETFs → directly supports BTC price.
Market impact
The impact on BTC can be viewed in two stages: short term and mid term. In the short term, ETF inflows will likely lift the BTC price directly through algorithmic trading. By early October, BTC may test the $83,000 resistance level. In the medium to long term, this process could accelerate the steps for Bitcoin to be included as a reserve asset by some sovereign nations—currently, Norway has asked its central bank to study the possibility of Bitcoin as a reserve currency.
A comparable historical event is the 2017 ETH ICO phase. At that time, institutional capital also entered gradually via over-the-counter derivatives, but the transparency of ETFs may make the current process more controllable. If a clear signal emerges in the future—such as the Fed including Bitcoin in a quantitative easing asset pool—then the scale of net ETF inflows could surpass $5 billion per month.
Trading approach
💡 Expect BTC to test $83,000 over the next 24 hours—this level is the key indicator of whether ETF funds can hold their ground. If it breaks through this resistance, ETF net inflows may keep accelerating, because it would mean more traditional funds have started allocating. If it falls below $82,500, then the long-term allocation significance of the ETFs would come into question. If the U.S. begins tightening overseas regulatory oversight of capital flows for cryptocurrencies, this assessment would be invalid.
【Conditions that void the assessment】If the U.S. begins tightening overseas regulatory oversight of capital flows for cryptocurrencies, this assessment would be invalid.
This article is not sponsored by any project. The author does not hold the assets mentioned.
⚠️ Not investment advice; forecasts are for reference only
#BitcoinSpotETFsNetInflow$159M
$ETH $BTC




286
·
--
📰 Why are miners collectively increasing their positions? Behind the $433M inflow into Fidelity’s ETF is it institutional conviction or a short-term trade?
On Friday, Fidelity reported a net inflow of $433 million into its Bitcoin ETF, bringing the ETF’s total assets to an all-time high. In this round of ETF frenzy, besides strong Bitcoin performance, major crypto ETFs such as Ethereum, Solana, and Zcash also attracted significant inflows, while the XRP ETF actually saw modest outflows. Institutional funds returning to the crypto market suggests long-term interest in this space, but whether prices can sustain in the short term still needs further observation.
Why is this news important?
Fidelity’s move signals a real shift in how institutional investors allocate to crypto assets. ETF inflows directly reflect recognition of Bitcoin as an asset-allocation tool, not just speculative trading. A $433 million inflow is far from a one-off experiment—it indicates that institutional investors, after experiencing earlier market volatility, are reassessing the long-term value of crypto assets. Why? Because continued positive inflows into a Bitcoin ETF can create a positive feedback loop in the market: inflow → price increases → attracting more inflow. Once that cycle forms, BTC will be much harder to put under selling pressure in the short term.
Market impact
For BTC, what does a large ETF inflow like this mean? Simply put: a clear bullish signal from institutions. Around the $81,446 price level, if the ETF inflow trend continues, Bitcoin is unlikely to fall below the key support at $77,000 in the near term. Historical data show that after periods of large inflows into Bitcoin ETFs, prices typically have room for a 10%–15% rise in the short term. However, note that if expectations for U.S. rate hikes intensify or if global risk assets are collectively sold off, this logic would fall apart.
The impact on ETH is relatively lagged, but synchronized ETF inflows indicate that even amid controversies around Ethereum’s Layer 2 scaling, institutional capital is still willing to allocate to the major crypto asset. At $2,637.68, if ETF inflows can persist for more than a month, ETH could theoretically face pressure toward $2,800. But in the short term, ETH is mostly moving with the crowd and lacks independent momentum.
Trading approach
💡 This ETF inflow is most likely a tailwind, especially for BTC. I tend to believe that if BTC holds above $81,446 for two weeks, it could break through $85,000 in November. But if the Fed raises rates in September beyond expectations, or if the CPI data falls short of expectations and triggers a surge in the U.S. dollar index, then this view would be invalidated. If it breaks below $79,000, the ETF narrative would collapse.
【Conditions that invalidate the view】If the U.S. September CPI heats up beyond expectations, or if the Fed signals a 75-basis-point rate hike, then the bullish logic for this ETF is invalid.
【Proactive disclosure of stance】This article has no sponsorship from any project, and the author does not hold any of the assets mentioned
⚠️ Not investment advice; predictions are for reference only
#BitcoinSpotETFsNetInflow$159M
$ETH #XRP
📰 Why are miners collectively increasing their positions? Behind the $433M inflow into Fidelity’s ETF is it institutional conviction or a short-term trade?
On Friday, Fidelity reported a net inflow of $433 million into its Bitcoin ETF, bringing the ETF’s total assets to an all-time high. In this round of ETF frenzy, besides strong Bitcoin performance, major crypto ETFs such as Ethereum, Solana, and Zcash also attracted significant inflows, while the XRP ETF actually saw modest outflows. Institutional funds returning to the crypto market suggests long-term interest in this space, but whether prices can sustain in the short term still needs further observation.
Why is this news important?
Fidelity’s move signals a real shift in how institutional investors allocate to crypto assets. ETF inflows directly reflect recognition of Bitcoin as an asset-allocation tool, not just speculative trading. A $433 million inflow is far from a one-off experiment—it indicates that institutional investors, after experiencing earlier market volatility, are reassessing the long-term value of crypto assets. Why? Because continued positive inflows into a Bitcoin ETF can create a positive feedback loop in the market: inflow → price increases → attracting more inflow. Once that cycle forms, BTC will be much harder to put under selling pressure in the short term.
Market impact
For BTC, what does a large ETF inflow like this mean? Simply put: a clear bullish signal from institutions. Around the $81,446 price level, if the ETF inflow trend continues, Bitcoin is unlikely to fall below the key support at $77,000 in the near term. Historical data show that after periods of large inflows into Bitcoin ETFs, prices typically have room for a 10%–15% rise in the short term. However, note that if expectations for U.S. rate hikes intensify or if global risk assets are collectively sold off, this logic would fall apart.
The impact on ETH is relatively lagged, but synchronized ETF inflows indicate that even amid controversies around Ethereum’s Layer 2 scaling, institutional capital is still willing to allocate to the major crypto asset. At $2,637.68, if ETF inflows can persist for more than a month, ETH could theoretically face pressure toward $2,800. But in the short term, ETH is mostly moving with the crowd and lacks independent momentum.
Trading approach
💡 This ETF inflow is most likely a tailwind, especially for BTC. I tend to believe that if BTC holds above $81,446 for two weeks, it could break through $85,000 in November. But if the Fed raises rates in September beyond expectations, or if the CPI data falls short of expectations and triggers a surge in the U.S. dollar index, then this view would be invalidated. If it breaks below $79,000, the ETF narrative would collapse.
【Conditions that invalidate the view】If the U.S. September CPI heats up beyond expectations, or if the Fed signals a 75-basis-point rate hike, then the bullish logic for this ETF is invalid.
【Proactive disclosure of stance】This article has no sponsorship from any project, and the author does not hold any of the assets mentioned
⚠️ Not investment advice; predictions are for reference only
#BitcoinSpotETFsNetInflow$159M
$ETH #XRP
On Friday, Fidelity reported a net inflow of $433 million into its Bitcoin ETF, bringing the ETF’s total assets to an all-time high. In this round of ETF frenzy, besides strong Bitcoin performance, major crypto ETFs such as Ethereum, Solana, and Zcash also attracted significant inflows, while the XRP ETF actually saw modest outflows. Institutional funds returning to the crypto market suggests long-term interest in this space, but whether prices can sustain in the short term still needs further observation.
Why is this news important?
Fidelity’s move signals a real shift in how institutional investors allocate to crypto assets. ETF inflows directly reflect recognition of Bitcoin as an asset-allocation tool, not just speculative trading. A $433 million inflow is far from a one-off experiment—it indicates that institutional investors, after experiencing earlier market volatility, are reassessing the long-term value of crypto assets. Why? Because continued positive inflows into a Bitcoin ETF can create a positive feedback loop in the market: inflow → price increases → attracting more inflow. Once that cycle forms, BTC will be much harder to put under selling pressure in the short term.
Market impact
For BTC, what does a large ETF inflow like this mean? Simply put: a clear bullish signal from institutions. Around the $81,446 price level, if the ETF inflow trend continues, Bitcoin is unlikely to fall below the key support at $77,000 in the near term. Historical data show that after periods of large inflows into Bitcoin ETFs, prices typically have room for a 10%–15% rise in the short term. However, note that if expectations for U.S. rate hikes intensify or if global risk assets are collectively sold off, this logic would fall apart.
The impact on ETH is relatively lagged, but synchronized ETF inflows indicate that even amid controversies around Ethereum’s Layer 2 scaling, institutional capital is still willing to allocate to the major crypto asset. At $2,637.68, if ETF inflows can persist for more than a month, ETH could theoretically face pressure toward $2,800. But in the short term, ETH is mostly moving with the crowd and lacks independent momentum.
Trading approach
💡 This ETF inflow is most likely a tailwind, especially for BTC. I tend to believe that if BTC holds above $81,446 for two weeks, it could break through $85,000 in November. But if the Fed raises rates in September beyond expectations, or if the CPI data falls short of expectations and triggers a surge in the U.S. dollar index, then this view would be invalidated. If it breaks below $79,000, the ETF narrative would collapse.
【Conditions that invalidate the view】If the U.S. September CPI heats up beyond expectations, or if the Fed signals a 75-basis-point rate hike, then the bullish logic for this ETF is invalid.
【Proactive disclosure of stance】This article has no sponsorship from any project, and the author does not hold any of the assets mentioned
⚠️ Not investment advice; predictions are for reference only
#BitcoinSpotETFsNetInflow$159M
$ETH #XRP




1
·
--
JPMorgan buys a big chunk of Bitcoin ETF—why exactly?
In 20 trading days, the Bitcoin ETF managed by JPMorgan bought about $51.5 million worth of Bitcoin, with no outflows during the period.
Wall Street heavyweight JPMorgan has quietly bought about $51.5 million worth of Bitcoin over the past 20 days through its Bitcoin ETF (MSBT). The key point is that during this time, the ETF’s funds did not leave at all—there was no daily net outflow like other Bitcoin funds. BlockBeats also found that MSBT is one of the few Bitcoin funds this month that recorded no daily net capital outflows.
Market impact
In the short term, JPMorgan’s continued buying could boost market sentiment, because its involvement suggests institutional investors still view Bitcoin favorably. The lack of outflows also indicates that over-the-counter funds are actively allocating Bitcoin through this channel. In the long run, if more large financial institutions follow suit, it could change Bitcoin’s supply-demand dynamics and further push the industry toward greater standardization.
- Asset: BTC
- Direction: Bullish 📈 Predicting a rise
- Duration: 12 hours
$BTC $ETH #BTC #ETH
📊 Historical backtest
- After a similar “strategy re-buy of 520 Bitcoins, costing $35 million” (2026-06-22) was published, BTC’s 12h price change was -1.53%; the outlook was bullish ❌ wrong
⚠️ Not investment advice
#BitcoinSpotETFsNetInflow$159M
JPMorgan buys a big chunk of Bitcoin ETF—why exactly?
In 20 trading days, the Bitcoin ETF managed by JPMorgan bought about $51.5 million worth of Bitcoin, with no outflows during the period.
Wall Street heavyweight JPMorgan has quietly bought about $51.5 million worth of Bitcoin over the past 20 days through its Bitcoin ETF (MSBT). The key point is that during this time, the ETF’s funds did not leave at all—there was no daily net outflow like other Bitcoin funds. BlockBeats also found that MSBT is one of the few Bitcoin funds this month that recorded no daily net capital outflows.
Market impact
In the short term, JPMorgan’s continued buying could boost market sentiment, because its involvement suggests institutional investors still view Bitcoin favorably. The lack of outflows also indicates that over-the-counter funds are actively allocating Bitcoin through this channel. In the long run, if more large financial institutions follow suit, it could change Bitcoin’s supply-demand dynamics and further push the industry toward greater standardization.
- Asset: BTC
- Direction: Bullish 📈 Predicting a rise
- Duration: 12 hours
$BTC $ETH #BTC #ETH
📊 Historical backtest
- After a similar “strategy re-buy of 520 Bitcoins, costing $35 million” (2026-06-22) was published, BTC’s 12h price change was -1.53%; the outlook was bullish ❌ wrong
⚠️ Not investment advice
#BitcoinSpotETFsNetInflow$159M
In 20 trading days, the Bitcoin ETF managed by JPMorgan bought about $51.5 million worth of Bitcoin, with no outflows during the period.
Wall Street heavyweight JPMorgan has quietly bought about $51.5 million worth of Bitcoin over the past 20 days through its Bitcoin ETF (MSBT). The key point is that during this time, the ETF’s funds did not leave at all—there was no daily net outflow like other Bitcoin funds. BlockBeats also found that MSBT is one of the few Bitcoin funds this month that recorded no daily net capital outflows.
Market impact
In the short term, JPMorgan’s continued buying could boost market sentiment, because its involvement suggests institutional investors still view Bitcoin favorably. The lack of outflows also indicates that over-the-counter funds are actively allocating Bitcoin through this channel. In the long run, if more large financial institutions follow suit, it could change Bitcoin’s supply-demand dynamics and further push the industry toward greater standardization.
- Asset: BTC
- Direction: Bullish 📈 Predicting a rise
- Duration: 12 hours
$BTC $ETH #BTC #ETH
📊 Historical backtest
- After a similar “strategy re-buy of 520 Bitcoins, costing $35 million” (2026-06-22) was published, BTC’s 12h price change was -1.53%; the outlook was bullish ❌ wrong
⚠️ Not investment advice
#BitcoinSpotETFsNetInflow$159M




12
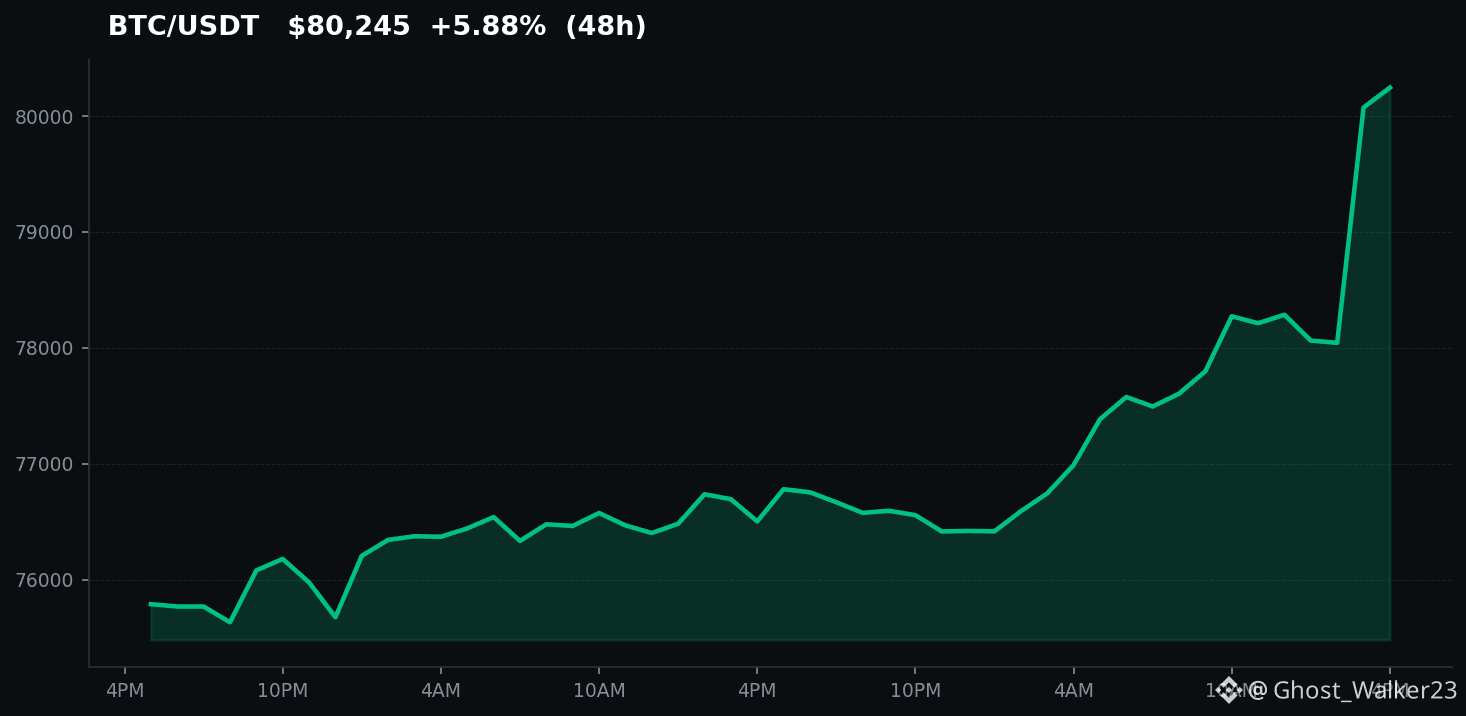
🚀 The recent surge of $159M in net inflows into Bitcoin Spot ETFs is fueling the $BTC rally, pushing it to $80,221.38 (+4.58%). As you can see below, this positive sentiment is also benefiting ETH, which rose to $2,557.40 (+3.84%). ¿Estás preparado para aprovechar estas tendencias? #BitcoinSpotETFsNetInflow$159M #crypto
💬 Únete y síguenos, seguimos analizando el mercado por ti.
🚀 The recent surge of $159M in net inflows into Bitcoin Spot ETFs is fueling the $BTC rally, pushing it to $80,221.38 (+4.58%). As you can see below, this positive sentiment is also benefiting ETH, which rose to $2,557.40 (+3.84%). ¿Estás preparado para aprovechar estas tendencias? #BitcoinSpotETFsNetInflow$159M #crypto
💬 Únete y síguenos, seguimos analizando el mercado por ti.
💬 Únete y síguenos, seguimos analizando el mercado por ti.
20
Bitcoin Spot ETFs experienced a significant net inflow of $159 million, indicating renewed investor confidence and demand for direct exposure to the digital asset. This inflow suggests that institutional and retail investors are actively participating in the market, potentially driving further price appreciation for $BTC. The positive sentiment surrounding these ETFs could signal a broader market recovery and increased adoption of crypto-based investment products.
Disclaimer: This is not financial advice. Please do your own research.
#BitcoinSpotETFsNetInflow$159M
Bitcoin Spot ETFs experienced a significant net inflow of $159 million, indicating renewed investor confidence and demand for direct exposure to the digital asset. This inflow suggests that institutional and retail investors are actively participating in the market, potentially driving further price appreciation for $BTC . The positive sentiment surrounding these ETFs could signal a broader market recovery and increased adoption of crypto-based investment products.
Disclaimer: This is not financial advice. Please do your own research.
#BitcoinSpotETFsNetInflow$159M
Disclaimer: This is not financial advice. Please do your own research.
#BitcoinSpotETFsNetInflow$159M
17
·
--
Recently, spot Bitcoin ETFs have seen strong growth. According to the latest data, Net Inflow reached $159 million, reflecting investors’ increasing interest in crypto assets. For example, major institutions such as Fidelity and ARK Invest have successfully launched their own spot Bitcoin ETFs and quickly attracted substantial inflows. This trend is driven not only by the overall rise in the crypto market, but also by a gradually clearer regulatory environment, making it easier for traditional investors to participate. Although the market still remains volatile, the ongoing net inflows into spot Bitcoin ETFs suggest that crypto assets’ importance in mainstream investing is continuing to rise. #BitcoinSpotETFsNetInflow
Recently, spot Bitcoin ETFs have seen strong growth. According to the latest data, Net Inflow reached $159 million, reflecting investors’ increasing interest in crypto assets. For example, major institutions such as Fidelity and ARK Invest have successfully launched their own spot Bitcoin ETFs and quickly attracted substantial inflows. This trend is driven not only by the overall rise in the crypto market, but also by a gradually clearer regulatory environment, making it easier for traditional investors to participate. Although the market still remains volatile, the ongoing net inflows into spot Bitcoin ETFs suggest that crypto assets’ importance in mainstream investing is continuing to rise. #BitcoinSpotETFsNetInflow
77


Bitcoin Spot ETFs experienced a significant net inflow of $160 million, signaling renewed investor interest in the digital asset. This influx suggests a positive sentiment building around Bitcoin, potentially driven by the perceived stability and accessibility offered by these regulated investment vehicles. The market is watching closely to see if this trend continues and what impact it will have on Bitcoin's price trajectory in the coming weeks. Such inflows often correlate with increased buying pressure, which could support or drive price appreciation.
Disclaimer: This is not investment advice.
#BitcoinSpotETFsNetInflow$160M $BTC
Bitcoin Spot ETFs experienced a significant net inflow of $160 million, signaling renewed investor interest in the digital asset. This influx suggests a positive sentiment building around Bitcoin, potentially driven by the perceived stability and accessibility offered by these regulated investment vehicles. The market is watching closely to see if this trend continues and what impact it will have on Bitcoin's price trajectory in the coming weeks. Such inflows often correlate with increased buying pressure, which could support or drive price appreciation.
Disclaimer: This is not investment advice.
#BitcoinSpotETFsNetInflow$160M $BTC
Disclaimer: This is not investment advice.
#BitcoinSpotETFsNetInflow$160M $BTC
58

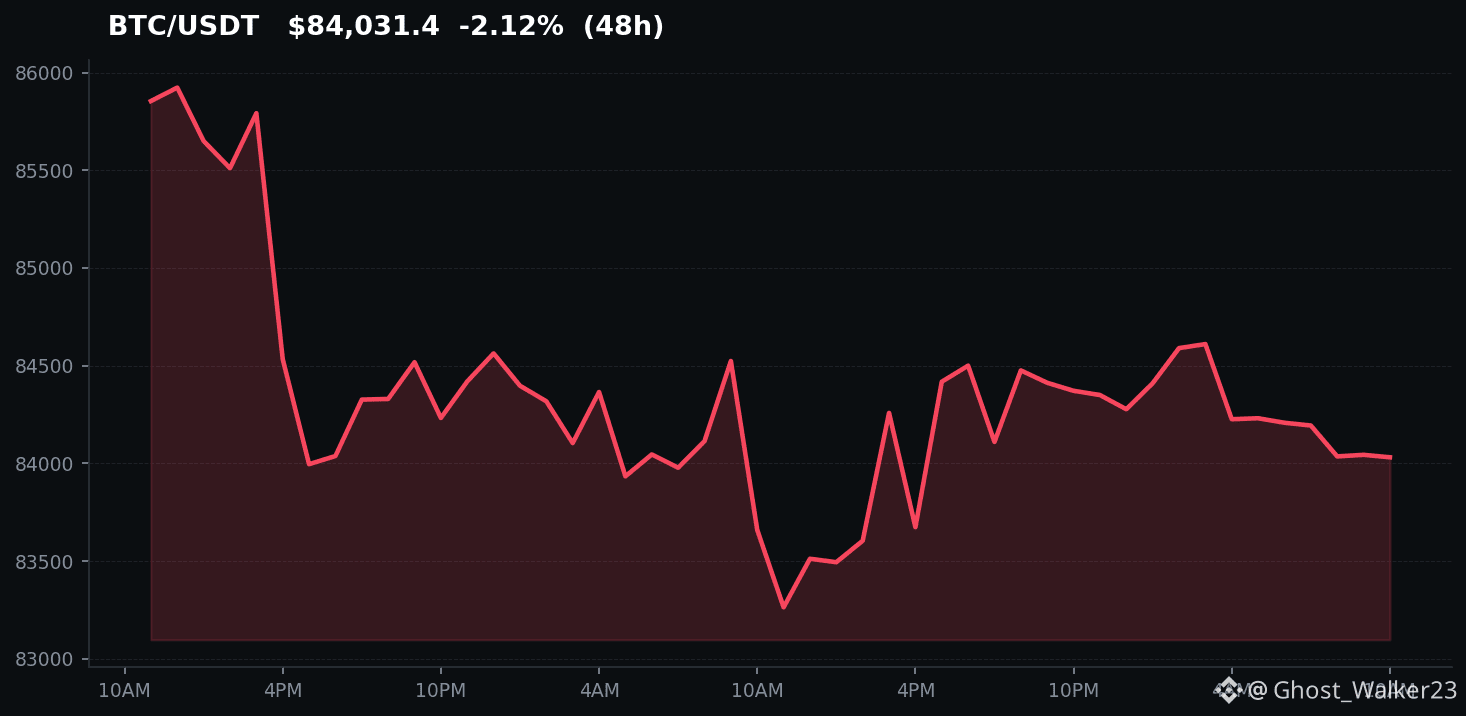
🚀 The recent #BitcoinSpotETFsNetInflow$191M is driving excitement in the market! As you can see below, Bitcoin ($BTC) is currently at $84,031.42, down slightly by 0.62%. This influx indicates growing institutional interest, impacting sentiment positively. 💰
With the increase in funds, do you think we’ll see a rebound soon? 💭
💬 Join and follow us—we’ll keep analyzing the market for you.
🚀 The recent #BitcoinSpotETFsNetInflow$191M is driving excitement in the market! As you can see below, Bitcoin ($BTC ) is currently at $84,031.42, down slightly by 0.62%. This influx indicates growing institutional interest, impacting sentiment positively. 💰
With the increase in funds, do you think we’ll see a rebound soon? 💭
💬 Join and follow us—we’ll keep analyzing the market for you.
With the increase in funds, do you think we’ll see a rebound soon? 💭
💬 Join and follow us—we’ll keep analyzing the market for you.
13
·
--
📰 ETF inflows up by over 2.8M; after SOL broke through $110, it suddenly hit resistance—why this spike higher might just be a fakeout?
I mentioned this a couple of days ago, and now there are new developments. The fact that Solana ETFs have seen inflows for 12 straight weeks is a major signal: money is quietly withdrawing from Bitcoin and shifting toward emerging smart-contract chains. But right after SOL broke above $110, there was a sudden surge in volume followed by a stall—this very likely indicates that profit-takers are escaping.
The core reason for the sustained inflows into Solana ETFs is that traditional finance is beginning to accept crypto assets through ETF channels. Bitcoin’s “old big brother” appeal is being weakened, while new opportunities from high-performance chains like Solana are emerging. This is similar to the logic during the Fed’s rate-hike cycle, when capital rotates from large-cap stocks to smaller ones—seeking better value.
Impact on the market
The impact on BTC is far-reaching. Over the past 12 weeks, ETF net inflows have been about $280 million. If this portion of capital continues to flow out of Bitcoin, in theory it could weigh on BTC’s price. In the short term, SOL’s stalled rally could trigger a pullback across the entire L2 sector. But in the long run, this capital rotation suggests the market is forming a landscape where multiple chains coexist.
💡 My view is that SOL has strong support around $110.8. If the Fed announces a rate cut, this stalled move might turn out to be only a pullback. If there’s large-scale selling from whales, then this view would be invalidated.
This article has no sponsorship from any project, and the author does not hold the assets mentioned
$BTC $ETH #BTC #ETH
⚠️ Not investment advice; forecasts are for reference only
#BitcoinSpotETFsNetInflow$159M
📰 ETF inflows up by over 2.8M; after SOL broke through $110, it suddenly hit resistance—why this spike higher might just be a fakeout?
I mentioned this a couple of days ago, and now there are new developments. The fact that Solana ETFs have seen inflows for 12 straight weeks is a major signal: money is quietly withdrawing from Bitcoin and shifting toward emerging smart-contract chains. But right after SOL broke above $110, there was a sudden surge in volume followed by a stall—this very likely indicates that profit-takers are escaping.
The core reason for the sustained inflows into Solana ETFs is that traditional finance is beginning to accept crypto assets through ETF channels. Bitcoin’s “old big brother” appeal is being weakened, while new opportunities from high-performance chains like Solana are emerging. This is similar to the logic during the Fed’s rate-hike cycle, when capital rotates from large-cap stocks to smaller ones—seeking better value.
Impact on the market
The impact on BTC is far-reaching. Over the past 12 weeks, ETF net inflows have been about $280 million. If this portion of capital continues to flow out of Bitcoin, in theory it could weigh on BTC’s price. In the short term, SOL’s stalled rally could trigger a pullback across the entire L2 sector. But in the long run, this capital rotation suggests the market is forming a landscape where multiple chains coexist.
💡 My view is that SOL has strong support around $110.8. If the Fed announces a rate cut, this stalled move might turn out to be only a pullback. If there’s large-scale selling from whales, then this view would be invalidated.
This article has no sponsorship from any project, and the author does not hold the assets mentioned
$BTC $ETH #BTC #ETH
⚠️ Not investment advice; forecasts are for reference only
#BitcoinSpotETFsNetInflow$159M
I mentioned this a couple of days ago, and now there are new developments. The fact that Solana ETFs have seen inflows for 12 straight weeks is a major signal: money is quietly withdrawing from Bitcoin and shifting toward emerging smart-contract chains. But right after SOL broke above $110, there was a sudden surge in volume followed by a stall—this very likely indicates that profit-takers are escaping.
The core reason for the sustained inflows into Solana ETFs is that traditional finance is beginning to accept crypto assets through ETF channels. Bitcoin’s “old big brother” appeal is being weakened, while new opportunities from high-performance chains like Solana are emerging. This is similar to the logic during the Fed’s rate-hike cycle, when capital rotates from large-cap stocks to smaller ones—seeking better value.
Impact on the market
The impact on BTC is far-reaching. Over the past 12 weeks, ETF net inflows have been about $280 million. If this portion of capital continues to flow out of Bitcoin, in theory it could weigh on BTC’s price. In the short term, SOL’s stalled rally could trigger a pullback across the entire L2 sector. But in the long run, this capital rotation suggests the market is forming a landscape where multiple chains coexist.
💡 My view is that SOL has strong support around $110.8. If the Fed announces a rate cut, this stalled move might turn out to be only a pullback. If there’s large-scale selling from whales, then this view would be invalidated.
This article has no sponsorship from any project, and the author does not hold the assets mentioned
$BTC $ETH #BTC #ETH
⚠️ Not investment advice; forecasts are for reference only
#BitcoinSpotETFsNetInflow$159M




243
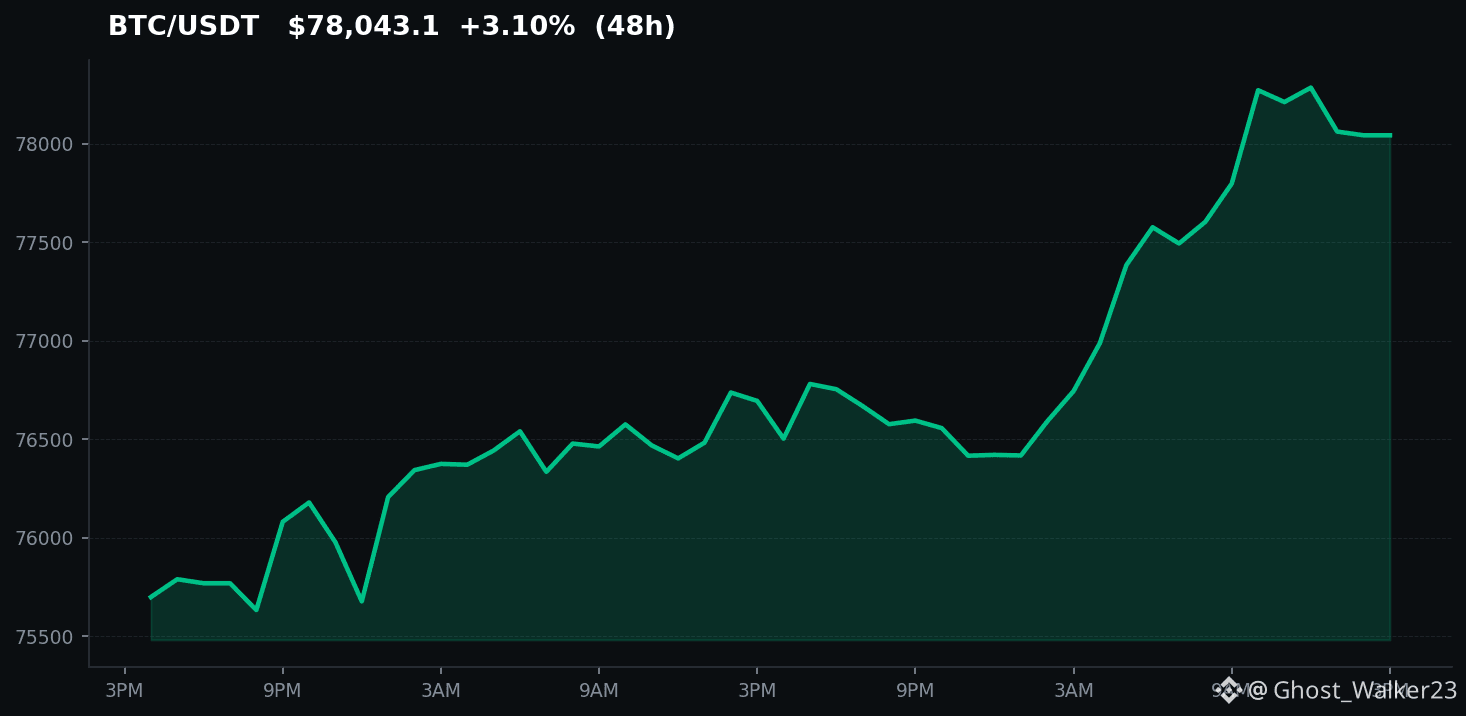
🚀 The surge in #BitcoinSpotETFsNetInflow$159M signals a turning point for $BTC! With altcoins like NEAR and UNI skyrocketing, could this mean a new wave of institutional interest? 💰 What are your thoughts on the future of Bitcoin amidst these inflows?
❤️ If you liked it, leave a like and follow us for the next analysis!
🚀 The surge in #BitcoinSpotETFsNetInflow$159M signals a turning point for $BTC ! With altcoins like NEAR and UNI skyrocketing, could this mean a new wave of institutional interest? 💰 What are your thoughts on the future of Bitcoin amidst these inflows?
❤️ If you liked it, leave a like and follow us for the next analysis!
❤️ If you liked it, leave a like and follow us for the next analysis!
2
·
--
Here's what happened when Grayscale's Zcash ETF started getting airtime last week.
Traders treated the headline like a green light and chased $ZEC without a plan for what happens if the product never lists, lists at a discount, or draws the wrong kind of regulatory attention. That's how you buy a narrative and lose the exit.
This is a case study in how ETF language gets misread. Grayscale wrapping $ZEC looks familiar because Bitcoin spot products finally turned net positive this year. The comparison breaks down fast. Privacy coins still sit in a different bucket. Shielded transactions, exchange listing risk, and the same compliance questions that have followed mixers for years do not vanish because an issuer files paperwork. Most of the timeline skipped that part.
What can go wrong is not theoretical. Delayed or denied products, persistent NAV discounts, fee drag, and a sudden shift in how tokenized or privacy-linked assets get treated. Greed sits at 72 right now, and idle $USDT finds these headlines first. That is exactly when people stop reading the structure and start reading the ticker. $BTC had a multi-year path. $ZEC is being asked to skip it.
The part most people missed is that an ETF is a distribution layer, not a regulatory shield. If the underlying stays politically awkward, the product just concentrates that awkwardness in a listed vehicle.
Where do you think this goes from here if the filing stalls?
#GrayscaleZcashETFHits #BitcoinSpotETFsNetInflow #CFTCUpdatesGuidanceOnTokenizedAssets
Here's what happened when Grayscale's Zcash ETF started getting airtime last week.
Traders treated the headline like a green light and chased $ZEC without a plan for what happens if the product never lists, lists at a discount, or draws the wrong kind of regulatory attention. That's how you buy a narrative and lose the exit.
This is a case study in how ETF language gets misread. Grayscale wrapping $ZEC looks familiar because Bitcoin spot products finally turned net positive this year. The comparison breaks down fast. Privacy coins still sit in a different bucket. Shielded transactions, exchange listing risk, and the same compliance questions that have followed mixers for years do not vanish because an issuer files paperwork. Most of the timeline skipped that part.
What can go wrong is not theoretical. Delayed or denied products, persistent NAV discounts, fee drag, and a sudden shift in how tokenized or privacy-linked assets get treated. Greed sits at 72 right now, and idle $USDT finds these headlines first. That is exactly when people stop reading the structure and start reading the ticker. $BTC had a multi-year path. $ZEC is being asked to skip it.
The part most people missed is that an ETF is a distribution layer, not a regulatory shield. If the underlying stays politically awkward, the product just concentrates that awkwardness in a listed vehicle.
Where do you think this goes from here if the filing stalls?
#GrayscaleZcashETFHits #BitcoinSpotETFsNetInflow #CFTCUpdatesGuidanceOnTokenizedAssets
Traders treated the headline like a green light and chased $ZEC without a plan for what happens if the product never lists, lists at a discount, or draws the wrong kind of regulatory attention. That's how you buy a narrative and lose the exit.
This is a case study in how ETF language gets misread. Grayscale wrapping $ZEC looks familiar because Bitcoin spot products finally turned net positive this year. The comparison breaks down fast. Privacy coins still sit in a different bucket. Shielded transactions, exchange listing risk, and the same compliance questions that have followed mixers for years do not vanish because an issuer files paperwork. Most of the timeline skipped that part.
What can go wrong is not theoretical. Delayed or denied products, persistent NAV discounts, fee drag, and a sudden shift in how tokenized or privacy-linked assets get treated. Greed sits at 72 right now, and idle $USDT finds these headlines first. That is exactly when people stop reading the structure and start reading the ticker. $BTC had a multi-year path. $ZEC is being asked to skip it.
The part most people missed is that an ETF is a distribution layer, not a regulatory shield. If the underlying stays politically awkward, the product just concentrates that awkwardness in a listed vehicle.
Where do you think this goes from here if the filing stalls?
#GrayscaleZcashETFHits #BitcoinSpotETFsNetInflow #CFTCUpdatesGuidanceOnTokenizedAssets

43
Log in to explore more content
Join global crypto users on Binance Square
⚡️ Get latest and useful information about crypto.
💬 Trusted by the world’s largest crypto exchange.
👍 Discover real insights from verified creators.
Email / Phone number
Trending Topics
1
#CircleMints500MUSDCOnSolana
108,355 views
2,271 Discussing
2
#PolymarketBankFailureBetsDrawFDICConcern
102,696 views
1,967 Discussing
3
#BlackRockBuildsTokenizedPortfoliosForOndo
97,672 views
1,403 Discussing
4
#BitwiseFilesToListNEARETFOnNYSEArca
73,634 views
1,141 Discussing
5
#SECCommissionerPeirceToLeaveOct2
77,308 views
933 Discussing
6
#SECSaysBuybacksUpgradesDontMakeTokenSecurity
60,260 views
665 Discussing
7
#StrategyProposesDailyDividendsForPreferreds
14,703 views
246 Discussing
8
#CircleTetherFreezeBitgetHackerWallet
14,542 views
144 Discussing
9
#CoinMarketCapCompletesCoinglassAcquisition
16,075 views
195 Discussing
10
#QNTRises39%
124,022 views
1,732 Discussing