
#bitcoinrecoversto$64100
bitcoinrecoversto$64100
25,877 views
234 Discussing
Hot
Latest

·
--
Bitcoin forecast $BTC (#BTC ) for the next
+- 12 hours.
High: 63780 USDT. 64100 USDT is possible.
Low: 62970 USDT. 62140 USDT is possible.
The situation looks bullish, but there are
no acceptable entry points for positions yet.
Time to make decisions:
14-15; 17; 19 hours UTC.
Not financial advice.
Bitcoin forecast $BTC (#BTC ) for the next
+- 12 hours.
High: 63780 USDT. 64100 USDT is possible.
Low: 62970 USDT. 62140 USDT is possible.
The situation looks bullish, but there are
no acceptable entry points for positions yet.
Time to make decisions:
14-15; 17; 19 hours UTC.
Not financial advice.
+- 12 hours.
High: 63780 USDT. 64100 USDT is possible.
Low: 62970 USDT. 62140 USDT is possible.
The situation looks bullish, but there are
no acceptable entry points for positions yet.
Time to make decisions:
14-15; 17; 19 hours UTC.
Not financial advice.
1
201

·
--
#BitcoinRecoversTo$64100
Bitcoin ($BTC ) reclaiming the $64,100 mark represents a notable shift in short-term market momentum.
Market Dynamics Behind the Move
Liquidity Reclaim: Moving back above $64,000 reclaims a critical structural zone, effectively sweeping short-side liquidity that stacked up during the prior consolidation phase.
Support Confirmation: $64,100 acts as an immediate micro-support level on shorter timeframes (4H/1D). Holding above this boundary suggests buyers are absorbing sell-side pressure and attempting to establish a higher low.
Volume & Volatility: A clean move through this level shifts immediate attention toward overhead resistance liquidity around the $65,200 – $66,000 range.
Key Technical Zones to Watch
Immediate Support: $63,500 – $64,000
Immediate Resistance: $65,200 – $65,800
Critical Pivot: A daily close sustained above $64,000 favors further upside expansion, while a rejection back below $63,200 would signal local exhaustion and risk retesting lower demand blocks.
{spot}(BTCUSDT)
#BTC #bitcoin #BinanceSquare
#BitcoinRecoversTo$64100
Bitcoin ($BTC ) reclaiming the $64,100 mark represents a notable shift in short-term market momentum.
Market Dynamics Behind the Move
Liquidity Reclaim: Moving back above $64,000 reclaims a critical structural zone, effectively sweeping short-side liquidity that stacked up during the prior consolidation phase.
Support Confirmation: $64,100 acts as an immediate micro-support level on shorter timeframes (4H/1D). Holding above this boundary suggests buyers are absorbing sell-side pressure and attempting to establish a higher low.
Volume & Volatility: A clean move through this level shifts immediate attention toward overhead resistance liquidity around the $65,200 – $66,000 range.
Key Technical Zones to Watch
Immediate Support: $63,500 – $64,000
Immediate Resistance: $65,200 – $65,800
Critical Pivot: A daily close sustained above $64,000 favors further upside expansion, while a rejection back below $63,200 would signal local exhaustion and risk retesting lower demand blocks.
#BTC #bitcoin #BinanceSquare
Bitcoin ($BTC ) reclaiming the $64,100 mark represents a notable shift in short-term market momentum.
Market Dynamics Behind the Move
Liquidity Reclaim: Moving back above $64,000 reclaims a critical structural zone, effectively sweeping short-side liquidity that stacked up during the prior consolidation phase.
Support Confirmation: $64,100 acts as an immediate micro-support level on shorter timeframes (4H/1D). Holding above this boundary suggests buyers are absorbing sell-side pressure and attempting to establish a higher low.
Volume & Volatility: A clean move through this level shifts immediate attention toward overhead resistance liquidity around the $65,200 – $66,000 range.
Key Technical Zones to Watch
Immediate Support: $63,500 – $64,000
Immediate Resistance: $65,200 – $65,800
Critical Pivot: A daily close sustained above $64,000 favors further upside expansion, while a rejection back below $63,200 would signal local exhaustion and risk retesting lower demand blocks.
#BTC #bitcoin #BinanceSquare

236

·
--
Bullish
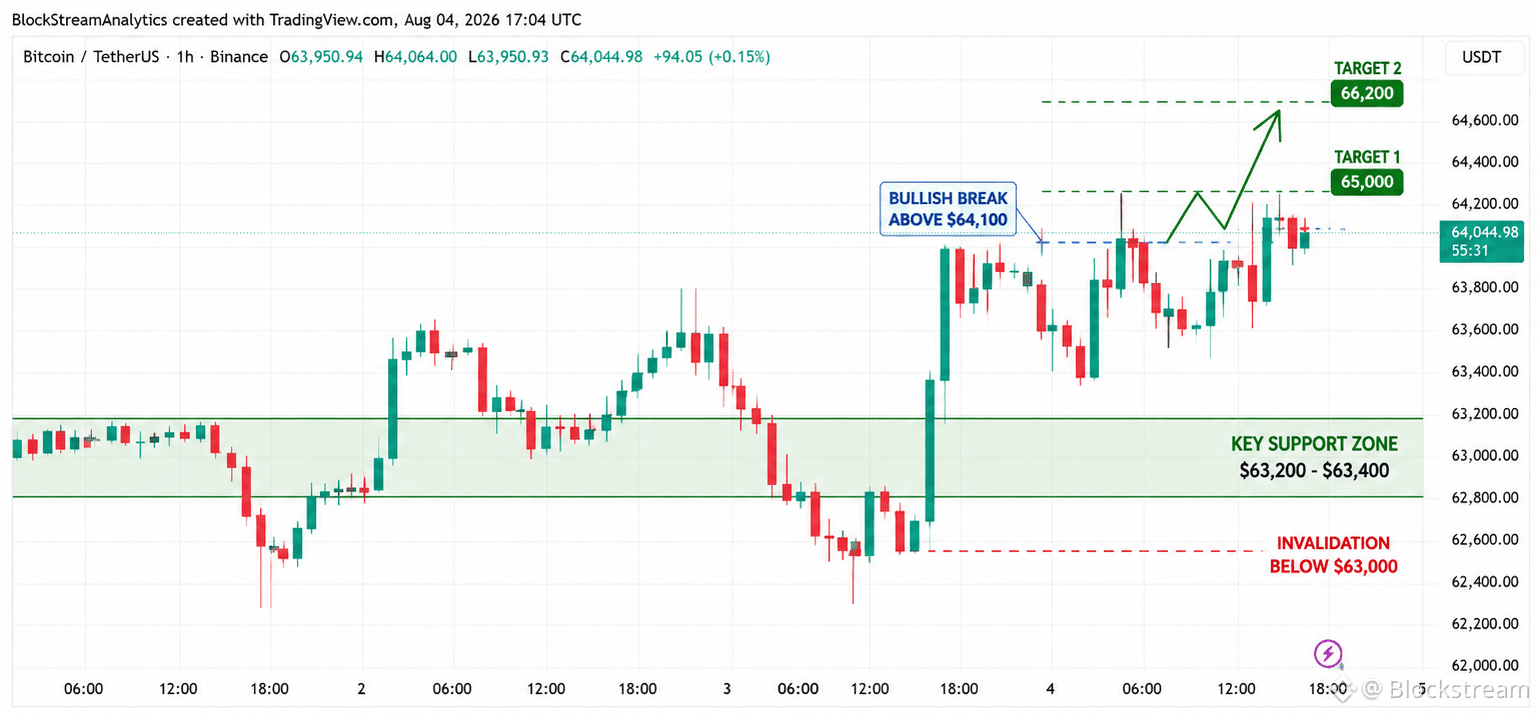
🚨 BTC Reclaims $64K — Is $65K Next?
Bitcoin has reclaimed the $64,000 level, and buyers are defending the recent breakout.
📍 Current Price: ~$64,045
Key Levels I'm Watching:
🟢 Support: $63,200–$63,400
⚡ Bullish Trigger: Sustained move above $64,100
🎯 Targets:
• $65,000
• $66,200
❌ Invalidation: A break below $63,000 would weaken the current bullish structure.
Momentum is improving, but the next move depends on whether bulls can hold this breakout.
Trade the structure, not the emotion.
$BTC #BitcoinRecoversTo$64100
— Block Stream Analytics
{spot}(BTCUSDT)
🚨 BTC Reclaims $64K — Is $65K Next?
Bitcoin has reclaimed the $64,000 level, and buyers are defending the recent breakout.
📍 Current Price: ~$64,045
Key Levels I'm Watching:
🟢 Support: $63,200–$63,400
⚡ Bullish Trigger: Sustained move above $64,100
🎯 Targets:
• $65,000
• $66,200
❌ Invalidation: A break below $63,000 would weaken the current bullish structure.
Momentum is improving, but the next move depends on whether bulls can hold this breakout.
Trade the structure, not the emotion.
$BTC #BitcoinRecoversTo$64100
— Block Stream Analytics
Bitcoin has reclaimed the $64,000 level, and buyers are defending the recent breakout.
📍 Current Price: ~$64,045
Key Levels I'm Watching:
🟢 Support: $63,200–$63,400
⚡ Bullish Trigger: Sustained move above $64,100
🎯 Targets:
• $65,000
• $66,200
❌ Invalidation: A break below $63,000 would weaken the current bullish structure.
Momentum is improving, but the next move depends on whether bulls can hold this breakout.
Trade the structure, not the emotion.
$BTC #BitcoinRecoversTo$64100
— Block Stream Analytics
3
2
224

*Bitcoin Quick Analysis - Aug 4, 2026*$BITCOIN Quick Analysis - Aug 4, 2026
### Current Snapshot
- Price: $64,128
- 24h Change: +$316, +0.49%
- Day Range: $63,322 - $64,243 f722
### What's Driving BTC Now
1. Bearish 2026 so far: BTC is down over 20% YTD. It fell below $60K in June after hitting >$120K late last year.
2. Recent pressure:
- Security scare: $89M hack from Coldcard wallets on July 30 hurt sentiment
- Big seller: Strategy sold 1,638 BTC for $104.7M between July 27 - Aug 2 at ∼$63,957
3. Short-term view: Price bounced 0.7% to $63,812 but still below last week's average. Key support now around $63,300. 96daf722
### Levels to Watch
- Support: $63,300 - $59,303
- Resistance: $64,655, then $66,614
- 52-Week High: $99,221 | 52-Week Low: $59,303.50 f7222bd1
Analysts are split. Some see a bounce to $68K-$80K if it holds support. Others warn of risk down to $46K-$59K before year-end recovery. 96da
Here’s a visual of today’s BTC setup:
Not financial advice. Crypto is risky and volatile.
Want me to make a daily BTC update for you, or focus on news vs technicals?#BitcoinRecoversTo$64100 #USIranDealOrNoDeal {spot}(BTCUSDT)
*Bitcoin Quick Analysis - Aug 4, 2026*
$BITCOIN Quick Analysis - Aug 4, 2026
### Current Snapshot
- Price: $64,128
- 24h Change: +$316, +0.49%
- Day Range: $63,322 - $64,243 f722
### What's Driving BTC Now
1. Bearish 2026 so far: BTC is down over 20% YTD. It fell below $60K in June after hitting >$120K late last year.
2. Recent pressure:
- Security scare: $89M hack from Coldcard wallets on July 30 hurt sentiment
- Big seller: Strategy sold 1,638 BTC for $104.7M between July 27 - Aug 2 at ∼$63,957
3. Short-term view: Price bounced 0.7% to $63,812 but still below last week's average. Key support now around $63,300. 96daf722
### Levels to Watch
- Support: $63,300 - $59,303
- Resistance: $64,655, then $66,614
- 52-Week High: $99,221 | 52-Week Low: $59,303.50 f7222bd1
Analysts are split. Some see a bounce to $68K-$80K if it holds support. Others warn of risk down to $46K-$59K before year-end recovery. 96da
Here’s a visual of today’s BTC setup:
Not financial advice. Crypto is risky and volatile.
Want me to make a daily BTC update for you, or focus on news vs technicals?#BitcoinRecoversTo$64100 #USIranDealOrNoDeal
### Current Snapshot
- Price: $64,128
- 24h Change: +$316, +0.49%
- Day Range: $63,322 - $64,243 f722
### What's Driving BTC Now
1. Bearish 2026 so far: BTC is down over 20% YTD. It fell below $60K in June after hitting >$120K late last year.
2. Recent pressure:
- Security scare: $89M hack from Coldcard wallets on July 30 hurt sentiment
- Big seller: Strategy sold 1,638 BTC for $104.7M between July 27 - Aug 2 at ∼$63,957
3. Short-term view: Price bounced 0.7% to $63,812 but still below last week's average. Key support now around $63,300. 96daf722
### Levels to Watch
- Support: $63,300 - $59,303
- Resistance: $64,655, then $66,614
- 52-Week High: $99,221 | 52-Week Low: $59,303.50 f7222bd1
Analysts are split. Some see a bounce to $68K-$80K if it holds support. Others warn of risk down to $46K-$59K before year-end recovery. 96da
Here’s a visual of today’s BTC setup:
Not financial advice. Crypto is risky and volatile.
Want me to make a daily BTC update for you, or focus on news vs technicals?#BitcoinRecoversTo$64100 #USIranDealOrNoDeal
2
1
195

·
--
Bullish
#BitcoinRecoversTo$64100
🎯 $BTC 1H Setup
🚀🚀🚀Primary bias: LONG (bullish while holding above $63,700) — higher-low structure from $62,226 + liquidity pools above at $64,575–64,889 favor the bulls.
{future}(BTCUSDT)
💥Setup Long — Retest (preferred):
💥Entry: $63,700–64,000 (200W MA zone + pullback)
💥Stop Loss: $63,400 (below the $63,303 liq cluster — 1H close below = invalid)
💥TP1: $64,466 (Aug 4 high) → TP2: $64,889 (whale liq — squeeze target) → TP3: $65,300
Bottom line: BTC is at ~$63,954 — it has recovered right into the $64,100 zone after the dip to $62,226 (Aug 3), but hasn't broken out yet. The 1H structure is bullish (higher lows) but it's hitting the $64,466 resistance right at the $64,575–64,889 liquidity knot — where a $102M whale short (40x) sits at $64,202 with a liquidation at $64,889 . The $63,000–64,900 band is the battleground.
$ETH $SOL #AMDFalls8%AfterHours #SpaceXFallsOnAISpendingAfterDebutEarnings #USIranDealOrNoDeal #SpaceXFirstLockupExpiresAug6
#BitcoinRecoversTo$64100
🎯 $BTC 1H Setup
🚀🚀🚀Primary bias: LONG (bullish while holding above $63,700) — higher-low structure from $62,226 + liquidity pools above at $64,575–64,889 favor the bulls.
💥Setup Long — Retest (preferred):
💥Entry: $63,700–64,000 (200W MA zone + pullback)
💥Stop Loss: $63,400 (below the $63,303 liq cluster — 1H close below = invalid)
💥TP1: $64,466 (Aug 4 high) → TP2: $64,889 (whale liq — squeeze target) → TP3: $65,300
Bottom line: BTC is at ~$63,954 — it has recovered right into the $64,100 zone after the dip to $62,226 (Aug 3), but hasn't broken out yet. The 1H structure is bullish (higher lows) but it's hitting the $64,466 resistance right at the $64,575–64,889 liquidity knot — where a $102M whale short (40x) sits at $64,202 with a liquidation at $64,889 . The $63,000–64,900 band is the battleground.
$ETH $SOL #AMDFalls8%AfterHours #SpaceXFallsOnAISpendingAfterDebutEarnings #USIranDealOrNoDeal #SpaceXFirstLockupExpiresAug6
🎯 $BTC 1H Setup
🚀🚀🚀Primary bias: LONG (bullish while holding above $63,700) — higher-low structure from $62,226 + liquidity pools above at $64,575–64,889 favor the bulls.
💥Setup Long — Retest (preferred):
💥Entry: $63,700–64,000 (200W MA zone + pullback)
💥Stop Loss: $63,400 (below the $63,303 liq cluster — 1H close below = invalid)
💥TP1: $64,466 (Aug 4 high) → TP2: $64,889 (whale liq — squeeze target) → TP3: $65,300
Bottom line: BTC is at ~$63,954 — it has recovered right into the $64,100 zone after the dip to $62,226 (Aug 3), but hasn't broken out yet. The 1H structure is bullish (higher lows) but it's hitting the $64,466 resistance right at the $64,575–64,889 liquidity knot — where a $102M whale short (40x) sits at $64,202 with a liquidation at $64,889 . The $63,000–64,900 band is the battleground.
$ETH $SOL #AMDFalls8%AfterHours #SpaceXFallsOnAISpendingAfterDebutEarnings #USIranDealOrNoDeal #SpaceXFirstLockupExpiresAug6

3
95

·
--
⚡ #BitcoinRecoversTo$64100 Reclaimed! Breakout or Trap? ⚡
$BTC
{future}(BTCUSDT)
IT has officially flipped key resistance into immediate support, surging back to $64,100. Institutional buying pressure is ramping up, and market volatility is signaling a major expansion phase.
📊 Technical Setup & Key Levels
Bullish Trigger: Clean daily close above $64,100 opens the path to $66,500 ➡️ $68,200.
Support Base: High liquidity defense sits at $62,800. Loss of this level invalidates short-term bullish momentum.
Volume Delta: Spiking buy-volume indicates strong accumulation, not just short squeezes.
🎯 High-Confluence Coins to Trade
$ETH
{spot}(ETHUSDT)
Gaining momentum; primed for a delayed breakout.
$BNB
{spot}(BNBUSDT)
Showing strong relative strength & low drawdown risk.
💡 Trader's Playbook: Avoid chasing green candles blindly. Wait for a healthy retest of $64,000 with confirmed lower-timeframe absorption before opening long positions. Manage risk strictly!
What's your bias right now? 🟢 Longing the breakout? | 🔴 Expecting a retest?
Drop your charts & trade setups below! 👇 #BitcoinRecoversTo$64100 #USIranDealOrNoDeal #SpaceXFirstLockupExpiresAug6 #ACTSeeksSamsung$32BBuyback
⚡ #BitcoinRecoversTo$64100 Reclaimed! Breakout or Trap? ⚡
$BTC
IT has officially flipped key resistance into immediate support, surging back to $64,100. Institutional buying pressure is ramping up, and market volatility is signaling a major expansion phase.
📊 Technical Setup & Key Levels
Bullish Trigger: Clean daily close above $64,100 opens the path to $66,500 ➡️ $68,200.
Support Base: High liquidity defense sits at $62,800. Loss of this level invalidates short-term bullish momentum.
Volume Delta: Spiking buy-volume indicates strong accumulation, not just short squeezes.
🎯 High-Confluence Coins to Trade
$ETH
Gaining momentum; primed for a delayed breakout.
$BNB
Showing strong relative strength & low drawdown risk.
💡 Trader's Playbook: Avoid chasing green candles blindly. Wait for a healthy retest of $64,000 with confirmed lower-timeframe absorption before opening long positions. Manage risk strictly!
What's your bias right now? 🟢 Longing the breakout? | 🔴 Expecting a retest?
Drop your charts & trade setups below! 👇 #BitcoinRecoversTo$64100 #USIranDealOrNoDeal #SpaceXFirstLockupExpiresAug6 #ACTSeeksSamsung$32BBuyback
$BTC
IT has officially flipped key resistance into immediate support, surging back to $64,100. Institutional buying pressure is ramping up, and market volatility is signaling a major expansion phase.
📊 Technical Setup & Key Levels
Bullish Trigger: Clean daily close above $64,100 opens the path to $66,500 ➡️ $68,200.
Support Base: High liquidity defense sits at $62,800. Loss of this level invalidates short-term bullish momentum.
Volume Delta: Spiking buy-volume indicates strong accumulation, not just short squeezes.
🎯 High-Confluence Coins to Trade
$ETH
Gaining momentum; primed for a delayed breakout.
$BNB
Showing strong relative strength & low drawdown risk.
💡 Trader's Playbook: Avoid chasing green candles blindly. Wait for a healthy retest of $64,000 with confirmed lower-timeframe absorption before opening long positions. Manage risk strictly!
What's your bias right now? 🟢 Longing the breakout? | 🔴 Expecting a retest?
Drop your charts & trade setups below! 👇 #BitcoinRecoversTo$64100 #USIranDealOrNoDeal #SpaceXFirstLockupExpiresAug6 #ACTSeeksSamsung$32BBuyback

2
2
222

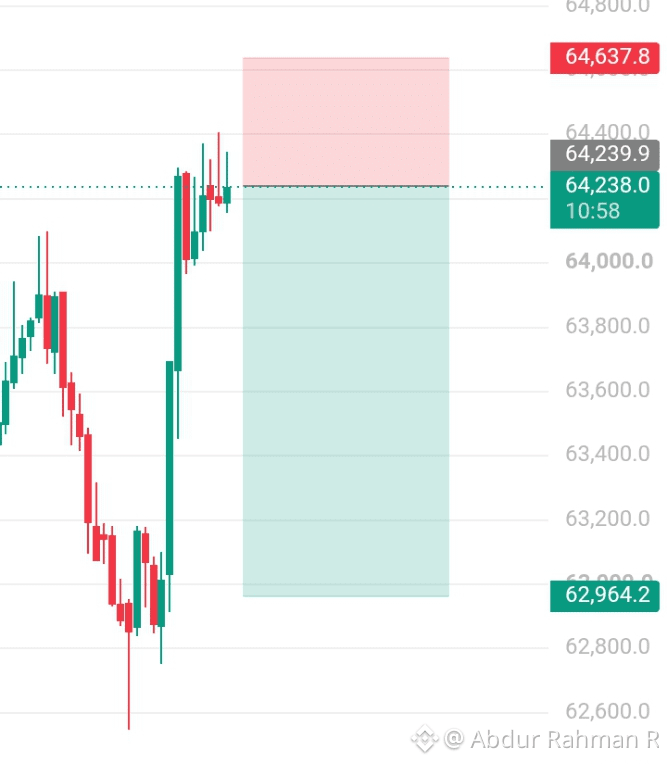

i'm going to short btc ❗❗❗
entry: 63800-64100
1st: 61800
2nd: 60500
3rd: 59200
sl:64600
use marging 50x
3 to 5% wallet
#wales #cryptoholders #toptraders
#bigwales #binance
i'm going to short btc ❗❗❗
entry: 63800-64100
1st: 61800
2nd: 60500
3rd: 59200
sl:64600
use marging 50x
3 to 5% wallet
#wales #cryptoholders #toptraders
#bigwales #binance
entry: 63800-64100
1st: 61800
2nd: 60500
3rd: 59200
sl:64600
use marging 50x
3 to 5% wallet
#wales #cryptoholders #toptraders
#bigwales #binance
3
155

·
--
Bullish
#BitcoinRecoversTo$64100 🚨 Bitcoin Just Changed the Market! Are the Bears Running Out of Time?
🍋Bitcoin is now over $64,000 again.. The price is not the most interesting thing here. The real story is what is happening behind the charts.Over the day people had to close $165 million in crypto positions.
🍋 Almost 65% of these were people betting against Bitcoin. So people who were betting against Bitcoin had to buy their positions as the market went up.
🍋This is why it matters when people who bet against Bitcoin have to buy, When many people think the price will go down even a small increase can make a lot of people buy back.
💥Here is the question.
Can this alone make Bitcoin go up a lot?
No, not always.
For Bitcoin to keep going up it still needs people to buy it and support the price after the people who bet against it are gone.
📊 Things to watch:
• If Bitcoin goes above $65,000 it could make people more positive, about it.
• If Bitcoin goes below $62,500 people might start to think the bears are right again.
The market got rid of a lot of debt. Now people will see if real buyers come in or if this rally slows down.
💬 What do you think?
Is this the start of Bitcoins big move or just another time when people who bet against it have to buy back before the price goes down again?
#bitcoin #BTC #Khan62 #MarketAnalysis
$BTC
{spot}(BTCUSDT)
$ETH
{spot}(ETHUSDT)
$BNB
{spot}(BNBUSDT)
#BitcoinRecoversTo$64100 🚨 Bitcoin Just Changed the Market! Are the Bears Running Out of Time?
🍋Bitcoin is now over $64,000 again.. The price is not the most interesting thing here. The real story is what is happening behind the charts.Over the day people had to close $165 million in crypto positions.
🍋 Almost 65% of these were people betting against Bitcoin. So people who were betting against Bitcoin had to buy their positions as the market went up.
🍋This is why it matters when people who bet against Bitcoin have to buy, When many people think the price will go down even a small increase can make a lot of people buy back.
💥Here is the question.
Can this alone make Bitcoin go up a lot?
No, not always.
For Bitcoin to keep going up it still needs people to buy it and support the price after the people who bet against it are gone.
📊 Things to watch:
• If Bitcoin goes above $65,000 it could make people more positive, about it.
• If Bitcoin goes below $62,500 people might start to think the bears are right again.
The market got rid of a lot of debt. Now people will see if real buyers come in or if this rally slows down.
💬 What do you think?
Is this the start of Bitcoins big move or just another time when people who bet against it have to buy back before the price goes down again?
#bitcoin #BTC #Khan62 #MarketAnalysis
$BTC
$ETH
$BNB
🍋Bitcoin is now over $64,000 again.. The price is not the most interesting thing here. The real story is what is happening behind the charts.Over the day people had to close $165 million in crypto positions.
🍋 Almost 65% of these were people betting against Bitcoin. So people who were betting against Bitcoin had to buy their positions as the market went up.
🍋This is why it matters when people who bet against Bitcoin have to buy, When many people think the price will go down even a small increase can make a lot of people buy back.
💥Here is the question.
Can this alone make Bitcoin go up a lot?
No, not always.
For Bitcoin to keep going up it still needs people to buy it and support the price after the people who bet against it are gone.
📊 Things to watch:
• If Bitcoin goes above $65,000 it could make people more positive, about it.
• If Bitcoin goes below $62,500 people might start to think the bears are right again.
The market got rid of a lot of debt. Now people will see if real buyers come in or if this rally slows down.
💬 What do you think?
Is this the start of Bitcoins big move or just another time when people who bet against it have to buy back before the price goes down again?
#bitcoin #BTC #Khan62 #MarketAnalysis
$BTC
$ETH
$BNB

274

·
--
Bullish
#BitcoinRecoversTo$64100
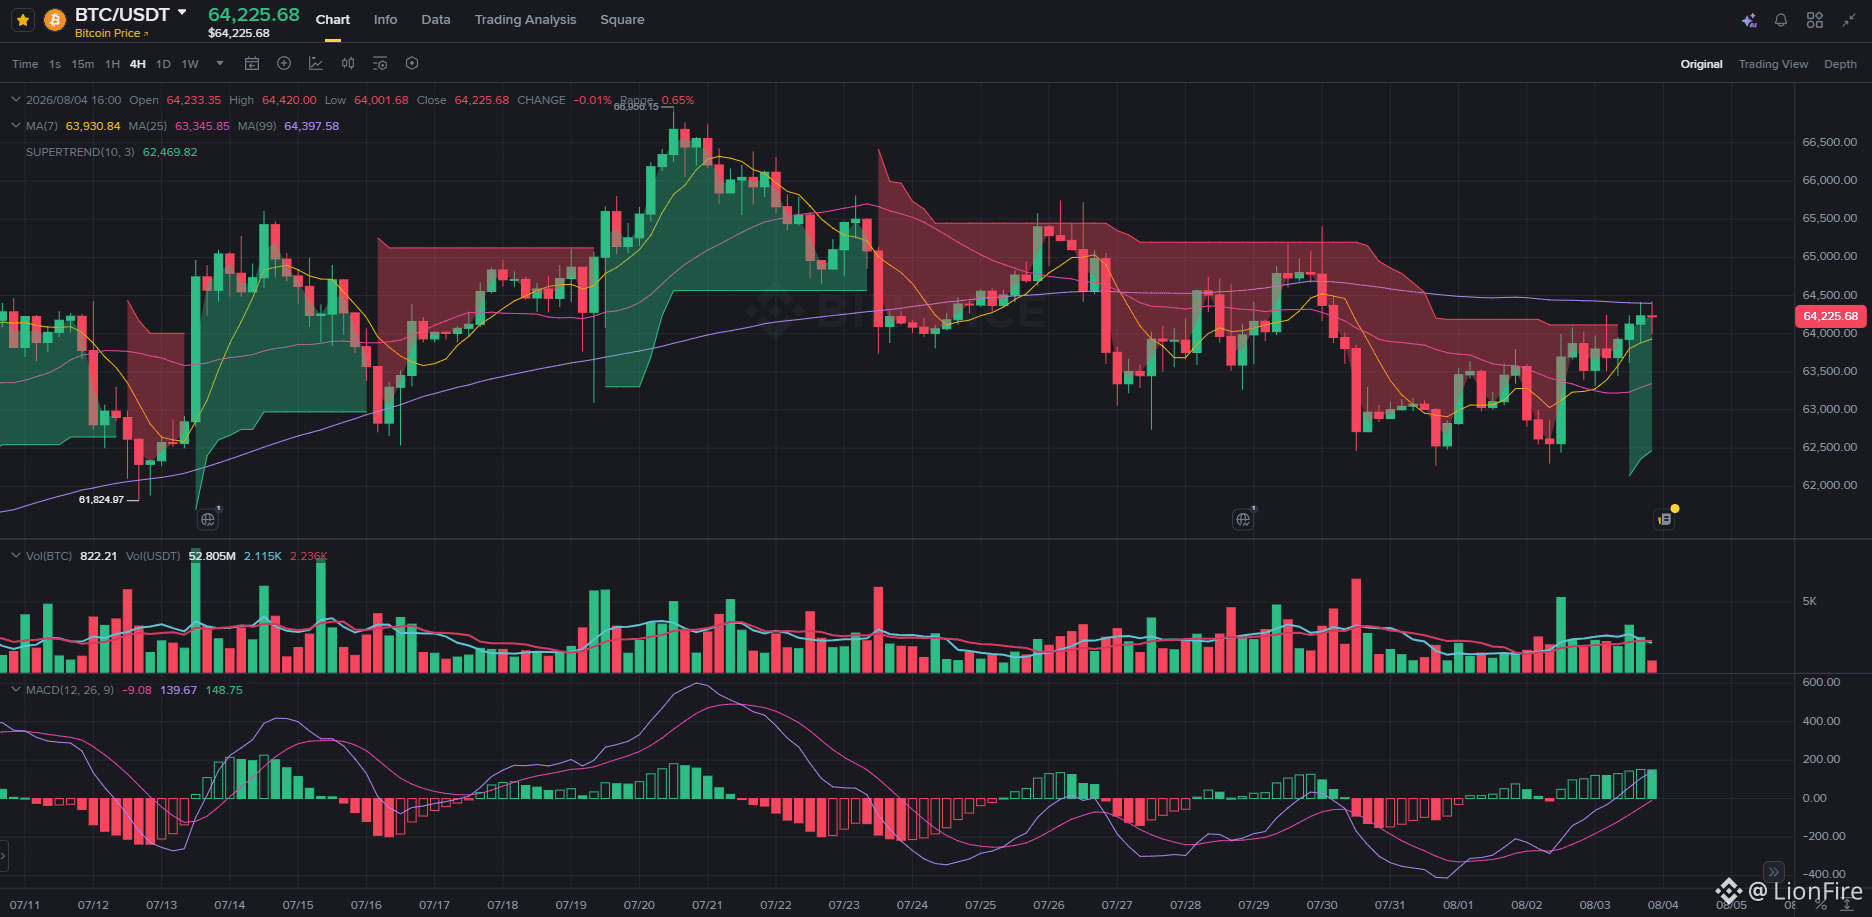
🚨 BITCOIN PAUSES: Is the momentum over, or is it just taking a breather? ⏳📊
If we take a closer look at the chart, we’ll notice that the fifth 4-hour candle is struggling to maintain the bullish streak. Trading around $64,225, it currently shows an almost neutral body (-0.01%), temporarily losing the green from the previous 16 hours.
But before sounding bearish alarms, let’s look at the market context:
⏳ The clock is still ticking: There are still 2 full hours left until this candle’s final close. In crypto, 120 minutes is an eternity, and the buying side still has room to reverse this slight pullback and close in the green.
🛡️ Selling pressure subdued: What stands out in this chart isn’t the pause itself, but the complete absence of panic. After a sustained rally, it’s common to see aggressive profit-taking from the bears. However, sell volume is anemic; the market is simply absorbing supply without stepping back.
📈 Structural consolidation: The MACD continues to project strength in positive territory, and the Supertrend keeps a solid dynamic support. Moving sideways in the $64.2K area is the ideal technical behavior to lay down a strong base before going after the next resistance.
💡 Not every candle can be a parabolic explosion. A technical pause where sellers can’t push the price lower is a sign of strength, not weakness. Smart money is consolidating positions. Pay close attention to the next two hours to confirm the close!
#BitcoinRecoversTo$64100
🚨 BITCOIN PAUSES: Is the momentum over, or is it just taking a breather? ⏳📊
If we take a closer look at the chart, we’ll notice that the fifth 4-hour candle is struggling to maintain the bullish streak. Trading around $64,225, it currently shows an almost neutral body (-0.01%), temporarily losing the green from the previous 16 hours.
But before sounding bearish alarms, let’s look at the market context:
⏳ The clock is still ticking: There are still 2 full hours left until this candle’s final close. In crypto, 120 minutes is an eternity, and the buying side still has room to reverse this slight pullback and close in the green.
🛡️ Selling pressure subdued: What stands out in this chart isn’t the pause itself, but the complete absence of panic. After a sustained rally, it’s common to see aggressive profit-taking from the bears. However, sell volume is anemic; the market is simply absorbing supply without stepping back.
📈 Structural consolidation: The MACD continues to project strength in positive territory, and the Supertrend keeps a solid dynamic support. Moving sideways in the $64.2K area is the ideal technical behavior to lay down a strong base before going after the next resistance.
💡 Not every candle can be a parabolic explosion. A technical pause where sellers can’t push the price lower is a sign of strength, not weakness. Smart money is consolidating positions. Pay close attention to the next two hours to confirm the close!
🚨 BITCOIN PAUSES: Is the momentum over, or is it just taking a breather? ⏳📊
If we take a closer look at the chart, we’ll notice that the fifth 4-hour candle is struggling to maintain the bullish streak. Trading around $64,225, it currently shows an almost neutral body (-0.01%), temporarily losing the green from the previous 16 hours.
But before sounding bearish alarms, let’s look at the market context:
⏳ The clock is still ticking: There are still 2 full hours left until this candle’s final close. In crypto, 120 minutes is an eternity, and the buying side still has room to reverse this slight pullback and close in the green.
🛡️ Selling pressure subdued: What stands out in this chart isn’t the pause itself, but the complete absence of panic. After a sustained rally, it’s common to see aggressive profit-taking from the bears. However, sell volume is anemic; the market is simply absorbing supply without stepping back.
📈 Structural consolidation: The MACD continues to project strength in positive territory, and the Supertrend keeps a solid dynamic support. Moving sideways in the $64.2K area is the ideal technical behavior to lay down a strong base before going after the next resistance.
💡 Not every candle can be a parabolic explosion. A technical pause where sellers can’t push the price lower is a sign of strength, not weakness. Smart money is consolidating positions. Pay close attention to the next two hours to confirm the close!
235

·
--
Bullish
#BitcoinRecoversTo$64100 — BUT WHO IS GETTING TRAPPED?
BTC bounced from $63,400 and recovered the $64,100 area. Bulls are already calling for $65K. Bears are opening shorts directly into the #rebound
Both sides may be early.
The current structure:
— $63K–$63.4K remains the local support
— $64.4K–$65K holds liquidity above the market
— open interest remains elevated
— fresh leverage is rebuilding inside a narrow range
This is not a clean breakout yet. It is a trap zone.
Buying now without a confirmed breakout means chasing directly under resistance. Shorting the first recovery means guessing the top while short liquidations are sitting above.
🎯 The cleaner setups
A breakout above the range with controlled OI growth can continue the squeeze.
A rejection followed by a structure break can trap late longs and push BTC back toward the lower liquidity.
Trap Radar at Crypto Resources is built around this exact mechanic: price displacement, open interest, liquidations, volume and premium index. It does not chase candles. It shows where the crowd is becoming vulnerable.
The move to $64,100 is real. The direction after it still needs confirmation.
#BTC #bitcoin #Openinterest
#BitcoinRecoversTo$64100 — BUT WHO IS GETTING TRAPPED?
BTC bounced from $63,400 and recovered the $64,100 area. Bulls are already calling for $65K. Bears are opening shorts directly into the #rebound
Both sides may be early.
The current structure:
— $63K–$63.4K remains the local support
— $64.4K–$65K holds liquidity above the market
— open interest remains elevated
— fresh leverage is rebuilding inside a narrow range
This is not a clean breakout yet. It is a trap zone.
Buying now without a confirmed breakout means chasing directly under resistance. Shorting the first recovery means guessing the top while short liquidations are sitting above.
🎯 The cleaner setups
A breakout above the range with controlled OI growth can continue the squeeze.
A rejection followed by a structure break can trap late longs and push BTC back toward the lower liquidity.
Trap Radar at Crypto Resources is built around this exact mechanic: price displacement, open interest, liquidations, volume and premium index. It does not chase candles. It shows where the crowd is becoming vulnerable.
The move to $64,100 is real. The direction after it still needs confirmation.
#BTC #bitcoin #Openinterest
BTC bounced from $63,400 and recovered the $64,100 area. Bulls are already calling for $65K. Bears are opening shorts directly into the #rebound
Both sides may be early.
The current structure:
— $63K–$63.4K remains the local support
— $64.4K–$65K holds liquidity above the market
— open interest remains elevated
— fresh leverage is rebuilding inside a narrow range
This is not a clean breakout yet. It is a trap zone.
Buying now without a confirmed breakout means chasing directly under resistance. Shorting the first recovery means guessing the top while short liquidations are sitting above.
🎯 The cleaner setups
A breakout above the range with controlled OI growth can continue the squeeze.
A rejection followed by a structure break can trap late longs and push BTC back toward the lower liquidity.
Trap Radar at Crypto Resources is built around this exact mechanic: price displacement, open interest, liquidations, volume and premium index. It does not chase candles. It shows where the crowd is becoming vulnerable.
The move to $64,100 is real. The direction after it still needs confirmation.
#BTC #bitcoin #Openinterest

3
122

·
--
Bullish
The final attacking position of the short sellers; breaking through means the short sellers’ strength is fading
The final attacking position of the short sellers; breaking through means the short sellers’ strength is fading
NNightmares
·
--
$BTC The market has arrived at the most critical 7 hours. The 4:00 close and the 8:00 close. Can it break through the resistance zone? Has the selling pressure begun to cancel orders?
1
236

·
--
Bullish
#BitcoinRecoversTo$64100
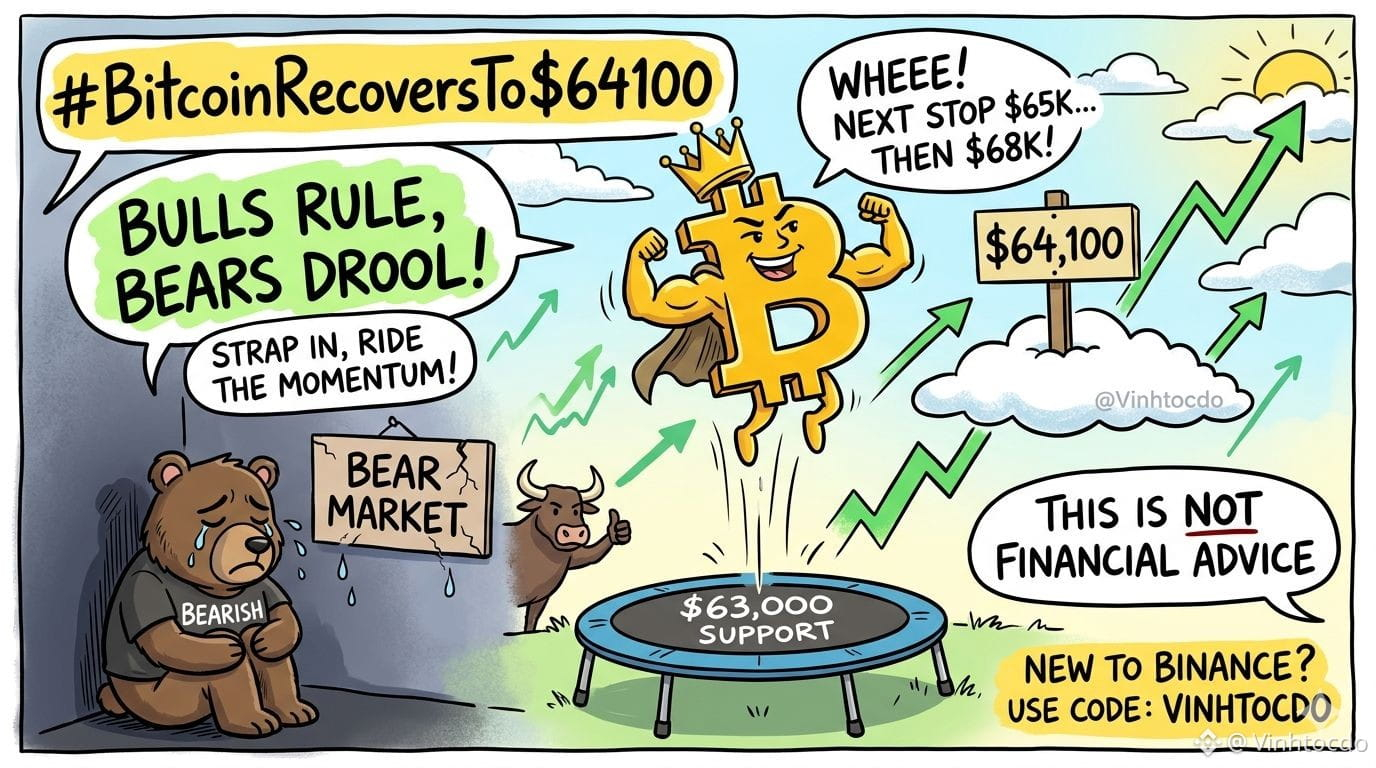
🚀The king is back, bouncing straight to $64,100! With the $63k support holding like a boss, bulls are eyes on $65,000, and next stop? $68,000! 🛸💨 Bears are crying in the corner right now.
What should traders do? Strap in, don't let FOMO blindly drive you, but definitely ride this bullish momentum. Watch that crucial $63,000 level during the US session! 📈🏄♂️
⚠️ NFA (Not Financial Advice)! Always DYOR, fam!
👉 New to Binance? Drop everything and use my code: VINHTOCDO to launch your trading journey today! Let's get this bread! 🤝
#BTCBullRun #CryptoTrading #BitcoinPump #VINHTOCDO
$BTC
{future}(BTCUSDT)
$ETH
{future}(ETHUSDT)
$BNB
{future}(BNBUSDT)
#BitcoinRecoversTo$64100
🚀The king is back, bouncing straight to $64,100! With the $63k support holding like a boss, bulls are eyes on $65,000, and next stop? $68,000! 🛸💨 Bears are crying in the corner right now.
What should traders do? Strap in, don't let FOMO blindly drive you, but definitely ride this bullish momentum. Watch that crucial $63,000 level during the US session! 📈🏄♂️
⚠️ NFA (Not Financial Advice)! Always DYOR, fam!
👉 New to Binance? Drop everything and use my code: VINHTOCDO to launch your trading journey today! Let's get this bread! 🤝
#BTCBullRun #CryptoTrading #BitcoinPump #VINHTOCDO
$BTC
$ETH
$BNB
🚀The king is back, bouncing straight to $64,100! With the $63k support holding like a boss, bulls are eyes on $65,000, and next stop? $68,000! 🛸💨 Bears are crying in the corner right now.
What should traders do? Strap in, don't let FOMO blindly drive you, but definitely ride this bullish momentum. Watch that crucial $63,000 level during the US session! 📈🏄♂️
⚠️ NFA (Not Financial Advice)! Always DYOR, fam!
👉 New to Binance? Drop everything and use my code: VINHTOCDO to launch your trading journey today! Let's get this bread! 🤝
#BTCBullRun #CryptoTrading #BitcoinPump #VINHTOCDO
$BTC
$ETH
$BNB
9
7
807

·
--
Bullish
1 year in crypto: still looking fresh and hopeful.
2 years in crypto: the bags, the dumps, the cope… we age in dog years.
This is literally us after the last cycle.
Meanwhile Bitcoin just recovered to $64,100.
Still here. Still holding. Just a little more tired.
#BitcoinRecoversTo$64100 $BTC #BaronTrump
1 year in crypto: still looking fresh and hopeful.
2 years in crypto: the bags, the dumps, the cope… we age in dog years.
This is literally us after the last cycle.
Meanwhile Bitcoin just recovered to $64,100.
Still here. Still holding. Just a little more tired.
#BitcoinRecoversTo$64100 $BTC #BaronTrump
2 years in crypto: the bags, the dumps, the cope… we age in dog years.
This is literally us after the last cycle.
Meanwhile Bitcoin just recovered to $64,100.
Still here. Still holding. Just a little more tired.
#BitcoinRecoversTo$64100 $BTC #BaronTrump

17
9.9k

·
--
Bullish
$BTC
{future}(BTCUSDT)
🚨#Bitcoin price rebounded above $64,000 as Qatar reported progress in efforts to restart US-Iran🇮🇷 negotiations, while technical charts pointed to a possible breakout from a descending channel.#BitcoinRecoversTo$64100
$BTC
🚨#Bitcoin price rebounded above $64,000 as Qatar reported progress in efforts to restart US-Iran🇮🇷 negotiations, while technical charts pointed to a possible breakout from a descending channel.#BitcoinRecoversTo$64100
🚨#Bitcoin price rebounded above $64,000 as Qatar reported progress in efforts to restart US-Iran🇮🇷 negotiations, while technical charts pointed to a possible breakout from a descending channel.#BitcoinRecoversTo$64100

246

·
--
Article
Bitcoin Climbs Its Rising Channel — Can BTC/USDT Clear $64,576?$BTC
{future}(BTCUSDT)
1H Technical Outlook | August 4, 2026
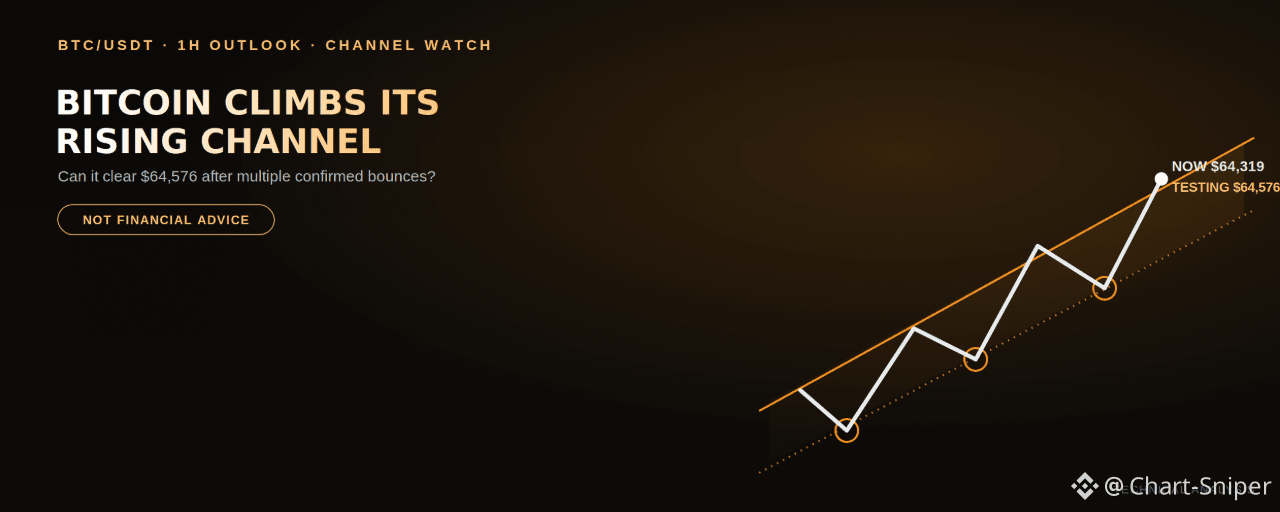
Bitcoin has spent the past several days building one of the more disciplined ascending channels seen recently — a series of confirmed Higher Lows and Lower Highs bouncing cleanly between two parallel rising trendlines. Price is now pushing up to $64,319.33 (+0.64% today), testing the top of that channel right at the $64,576.48 resistance level.
This article is for educational and informational purposes only. It is not financial advice. Even well-respected channels eventually break. Confirm a real move through resistance before assuming continuation.
Market Structure: A Well-Tested Rising Channel
Since the Higher Low near $62,000 on August 1, Bitcoin has bounced cleanly off its rising channel support on multiple occasions, each Higher Low a little above the last: $62,009.70, then $62,459.97, then $62,947.32. On the upper side, the channel resistance has capped rallies at Lower Highs before finally being cleared on the move to today's high near $64,576.
That's a genuinely well-tested structure — multiple confirmed touches on both boundaries — which gives this channel more credibility than a line drawn through just two points.
Momentum Backs the Push
The RSI (14) is at 64.55, above both the neutral 50 line and its moving average of 56.45. That's a constructive reading, consistent with the channel's upper boundary being tested with real strength rather than a weak, fading push.
The Zone That Matters: $64,576.48
This is the top of the channel and the immediate resistance. A confirmed close above it — especially one that holds and extends — would be the clearest sign yet that Bitcoin is breaking free of the channel to the upside rather than just testing its ceiling again.
Resistance Levels to Watch
$64,576.48 — the channel top and current resistance, the level in play right nowBeyond this level, the channel's upward slope projects toward roughly $65,200 over the coming days if the current pace continues
Support Levels to Watch
$64,002.71 — the nearer support, an FVG level just below current price$63,590.29 — a stronger support, close to the rising channel's support trendline$62,947.32 and $62,459.97 — deeper Higher Lows from earlier in the channel
Potential Trade Setups (Illustrative Only — Not Financial Advice)
🟢 Setup 1 — Buy the channel continuation
Entry zone: $64,002 – $64,320 (on a pullback that holds above support)Invalidation / Stop-loss: Below $63,590Target 1: $64,576Target 2: Channel projection toward $65,200, trailing stops as new highs form
🔴 Setup 2 — Fade a rejection at the channel top
Trigger: Rejection candle near $64,576Entry zone: Top of the rejectionInvalidation / Stop-loss: Above $64,700Target 1: $64,002Target 2: $63,590
🟢 Setup 3 — Bullish breakout
Trigger: A confirmed 1H close above $64,576 with follow-throughEntry zone: $64,580 – $64,700 on confirmationInvalidation / Stop-loss: Below $64,002Target: Open-ended above the channel; treat prior resistance levels as reference points as the move develops
⚠️ Channel breakdown (bearish invalidation)
A confirmed close below the rising channel support and $62,947.32 would break this well-tested structure and be the first real sign the uptrend is losing its footing.
Bottom Line
Bitcoin's rising channel has held up through multiple tests on both sides, and the current push to $64,576 is backed by supportive RSI rather than fading momentum. Clear this level with a confirmed close and the channel's upward path points toward $65,200 and beyond; a rejection here would fit the pattern of the channel simply doing what it's done before — bouncing between its boundaries.
Disclaimer: This content is for informational and educational purposes only and does not constitute financial, investment, or trading advice. Cryptocurrency trading involves significant risk, including the potential loss of principal. Past performance and chart patterns are not indicative of future results. Always conduct your own research and consult a licensed financial advisor before making trading decisions.
@Binance_Square_Official @bitcoin #BitcoinRecoversTo$64100 #USIranDealOrNoDeal #SpaceXFirstLockupExpiresAug6 #Binance #ChartSniper
Bitcoin Climbs Its Rising Channel — Can BTC/USDT Clear $64,576?
$BTC
1H Technical Outlook | August 4, 2026
Bitcoin has spent the past several days building one of the more disciplined ascending channels seen recently — a series of confirmed Higher Lows and Lower Highs bouncing cleanly between two parallel rising trendlines. Price is now pushing up to $64,319.33 (+0.64% today), testing the top of that channel right at the $64,576.48 resistance level.
This article is for educational and informational purposes only. It is not financial advice. Even well-respected channels eventually break. Confirm a real move through resistance before assuming continuation.
Market Structure: A Well-Tested Rising Channel
Since the Higher Low near $62,000 on August 1, Bitcoin has bounced cleanly off its rising channel support on multiple occasions, each Higher Low a little above the last: $62,009.70, then $62,459.97, then $62,947.32. On the upper side, the channel resistance has capped rallies at Lower Highs before finally being cleared on the move to today's high near $64,576.
That's a genuinely well-tested structure — multiple confirmed touches on both boundaries — which gives this channel more credibility than a line drawn through just two points.
Momentum Backs the Push
The RSI (14) is at 64.55, above both the neutral 50 line and its moving average of 56.45. That's a constructive reading, consistent with the channel's upper boundary being tested with real strength rather than a weak, fading push.
The Zone That Matters: $64,576.48
This is the top of the channel and the immediate resistance. A confirmed close above it — especially one that holds and extends — would be the clearest sign yet that Bitcoin is breaking free of the channel to the upside rather than just testing its ceiling again.
Resistance Levels to Watch
$64,576.48 — the channel top and current resistance, the level in play right nowBeyond this level, the channel's upward slope projects toward roughly $65,200 over the coming days if the current pace continues
Support Levels to Watch
$64,002.71 — the nearer support, an FVG level just below current price$63,590.29 — a stronger support, close to the rising channel's support trendline$62,947.32 and $62,459.97 — deeper Higher Lows from earlier in the channel
Potential Trade Setups (Illustrative Only — Not Financial Advice)
🟢 Setup 1 — Buy the channel continuation
Entry zone: $64,002 – $64,320 (on a pullback that holds above support)Invalidation / Stop-loss: Below $63,590Target 1: $64,576Target 2: Channel projection toward $65,200, trailing stops as new highs form
🔴 Setup 2 — Fade a rejection at the channel top
Trigger: Rejection candle near $64,576Entry zone: Top of the rejectionInvalidation / Stop-loss: Above $64,700Target 1: $64,002Target 2: $63,590
🟢 Setup 3 — Bullish breakout
Trigger: A confirmed 1H close above $64,576 with follow-throughEntry zone: $64,580 – $64,700 on confirmationInvalidation / Stop-loss: Below $64,002Target: Open-ended above the channel; treat prior resistance levels as reference points as the move develops
⚠️ Channel breakdown (bearish invalidation)
A confirmed close below the rising channel support and $62,947.32 would break this well-tested structure and be the first real sign the uptrend is losing its footing.
Bottom Line
Bitcoin's rising channel has held up through multiple tests on both sides, and the current push to $64,576 is backed by supportive RSI rather than fading momentum. Clear this level with a confirmed close and the channel's upward path points toward $65,200 and beyond; a rejection here would fit the pattern of the channel simply doing what it's done before — bouncing between its boundaries.
Disclaimer: This content is for informational and educational purposes only and does not constitute financial, investment, or trading advice. Cryptocurrency trading involves significant risk, including the potential loss of principal. Past performance and chart patterns are not indicative of future results. Always conduct your own research and consult a licensed financial advisor before making trading decisions.
@Binance Square Official @Bitcoin #BitcoinRecoversTo$64100 #USIranDealOrNoDeal #SpaceXFirstLockupExpiresAug6 #Binance #ChartSniper
1H Technical Outlook | August 4, 2026
Bitcoin has spent the past several days building one of the more disciplined ascending channels seen recently — a series of confirmed Higher Lows and Lower Highs bouncing cleanly between two parallel rising trendlines. Price is now pushing up to $64,319.33 (+0.64% today), testing the top of that channel right at the $64,576.48 resistance level.
This article is for educational and informational purposes only. It is not financial advice. Even well-respected channels eventually break. Confirm a real move through resistance before assuming continuation.
Market Structure: A Well-Tested Rising Channel
Since the Higher Low near $62,000 on August 1, Bitcoin has bounced cleanly off its rising channel support on multiple occasions, each Higher Low a little above the last: $62,009.70, then $62,459.97, then $62,947.32. On the upper side, the channel resistance has capped rallies at Lower Highs before finally being cleared on the move to today's high near $64,576.
That's a genuinely well-tested structure — multiple confirmed touches on both boundaries — which gives this channel more credibility than a line drawn through just two points.
Momentum Backs the Push
The RSI (14) is at 64.55, above both the neutral 50 line and its moving average of 56.45. That's a constructive reading, consistent with the channel's upper boundary being tested with real strength rather than a weak, fading push.
The Zone That Matters: $64,576.48
This is the top of the channel and the immediate resistance. A confirmed close above it — especially one that holds and extends — would be the clearest sign yet that Bitcoin is breaking free of the channel to the upside rather than just testing its ceiling again.
Resistance Levels to Watch
$64,576.48 — the channel top and current resistance, the level in play right nowBeyond this level, the channel's upward slope projects toward roughly $65,200 over the coming days if the current pace continues
Support Levels to Watch
$64,002.71 — the nearer support, an FVG level just below current price$63,590.29 — a stronger support, close to the rising channel's support trendline$62,947.32 and $62,459.97 — deeper Higher Lows from earlier in the channel
Potential Trade Setups (Illustrative Only — Not Financial Advice)
🟢 Setup 1 — Buy the channel continuation
Entry zone: $64,002 – $64,320 (on a pullback that holds above support)Invalidation / Stop-loss: Below $63,590Target 1: $64,576Target 2: Channel projection toward $65,200, trailing stops as new highs form
🔴 Setup 2 — Fade a rejection at the channel top
Trigger: Rejection candle near $64,576Entry zone: Top of the rejectionInvalidation / Stop-loss: Above $64,700Target 1: $64,002Target 2: $63,590
🟢 Setup 3 — Bullish breakout
Trigger: A confirmed 1H close above $64,576 with follow-throughEntry zone: $64,580 – $64,700 on confirmationInvalidation / Stop-loss: Below $64,002Target: Open-ended above the channel; treat prior resistance levels as reference points as the move develops
⚠️ Channel breakdown (bearish invalidation)
A confirmed close below the rising channel support and $62,947.32 would break this well-tested structure and be the first real sign the uptrend is losing its footing.
Bottom Line
Bitcoin's rising channel has held up through multiple tests on both sides, and the current push to $64,576 is backed by supportive RSI rather than fading momentum. Clear this level with a confirmed close and the channel's upward path points toward $65,200 and beyond; a rejection here would fit the pattern of the channel simply doing what it's done before — bouncing between its boundaries.
Disclaimer: This content is for informational and educational purposes only and does not constitute financial, investment, or trading advice. Cryptocurrency trading involves significant risk, including the potential loss of principal. Past performance and chart patterns are not indicative of future results. Always conduct your own research and consult a licensed financial advisor before making trading decisions.
@Binance Square Official @Bitcoin #BitcoinRecoversTo$64100 #USIranDealOrNoDeal #SpaceXFirstLockupExpiresAug6 #Binance #ChartSniper
207

·
--
Article
BTC Reclaims $64K but VWAP Battle Decides EverythingBitcoin has clawed back above the critical $64,016 horizontal after a brutal multi-day downtrend — but VWAP and EMA are converging just below, and one rejection candle ends this recovery cold.
The Immediate Battlefield
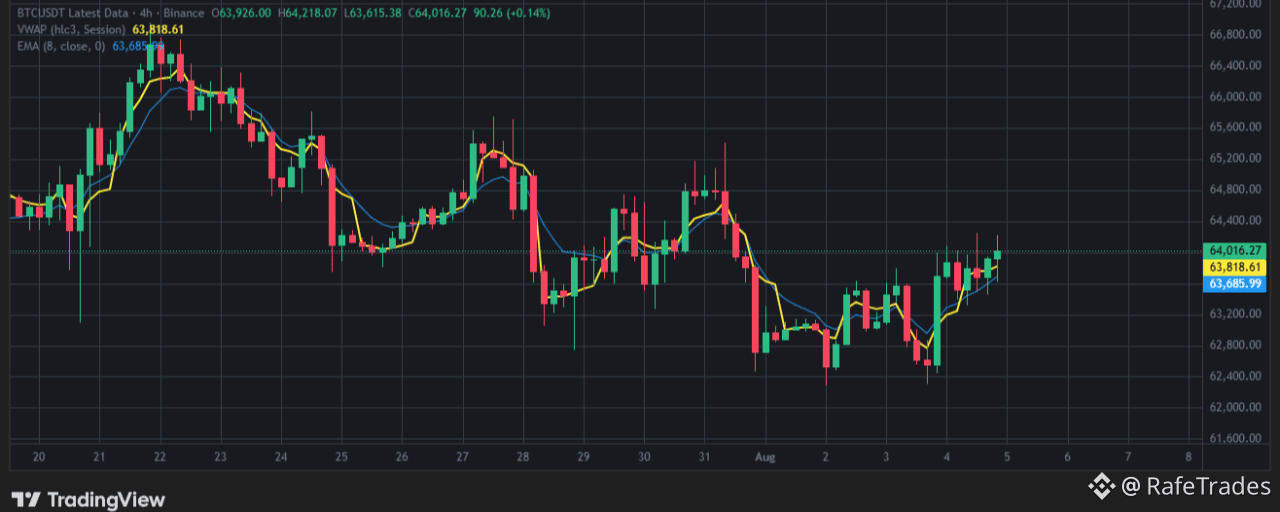
$BTC is printing $64,016.27 on the 4H Binance chart, up +0.14% — clinging to the upper edge of the visible dotted horizontal resistance zone that has capped price repeatedly since July 25 and again on July 30–31.
The immediate bias is cautiously bullish but structurally fragile: price has reclaimed the key $64,000 psychological level for the first time since August 1, but the recovery is happening on thin momentum with both VWAP and EMA still positioned below current price and actively converging upward beneath the rally.
The Technical Confluence
The VWAP ($63,818.61) and EMA(8) ($63,685.99) are separated by just $132.62 and both are rising in tandem directly beneath current price — that convergence is not coincidental, it's a classic post-recovery compression signal.
When VWAP and EMA rise in parallel while price pushes into a horizontal resistance ceiling, the two anchors are acting as a dynamic launchpad from below AND a pressure test from the resistance above — $BTC is caught in a vice between its own recovery momentum and a supply ceiling that has rejected price four times over the past two weeks, and the resolution of this compression will define the next $2,000 move in either direction.
📌 VWAP: $63,818.61 — institutional session anchor rising in recovery mode📌 EMA(8): $63,685.99 — momentum ribbon, converging with VWAP from below📌 Current Price: $64,016.27 — above both anchors and pressing into horizontal resistance📌 Key Horizontal: $64,000–$64,218 — the dotted ceiling zone that has defined the entire bearish range structure since July 25
The VWAP-EMA gap of $132 is tightening — when these two fuse completely while price is above them, the upside trigger becomes explosive; if price drops back into the gap, the downside flush is equally violent.
The Liquidation Map
Upside Walls:
🔴 $64,218 → Today's session high — immediate intraday ceiling and first supply test🔴 $64,800 → Major structural resistance from the July 30–31 distribution zone🔴 $65,200 → Secondary supply block from the July 27–28 breakdown origin🔴 $65,600 → Prior consolidation ceiling from the July 23–24 range🔴 $66,400–$66,800 → The macro session highs from July 22 — +4.1% to +4.7% from current price, full recovery target
Downside Risk Floors:
🟢 $63,818 → VWAP — first dynamic support on any pullback🟢 $63,685 → EMA(8) — momentum floor and secondary cushion🟢 $63,200 → Minor structural demand from the August 1–2 consolidation base🟢 $62,800 → The August 2–3 structural low — critical demand floor🟢 $62,400 → The absolute session low from August 2 — -2.5% from current price, macro last stand🟢 $61,600 → The catastrophic breakdown floor visible at the bottom of the chart grid
Tactical Execution Plan
⚡ Long Trigger:
Entry only on a confirmed 4H candle CLOSE above $64,218 (breaks today's session high and clears the horizontal resistance ceiling decisively)Target 1: $64,800 | Target 2: $65,200 | Target 3: $65,600Stop-Loss: Hard 4H close back below $63,818 (VWAP lost)Risk/Reward: ~1:3.2 on the T2 target
💀 Short Trigger:
Entry on a confirmed 4H candle CLOSE below $63,685 (breaks beneath EMA and VWAP stack simultaneously)Target 1: $63,200 | Target 2: $62,800Stop-Loss: Any 4H reclaim above $64,016Risk/Reward: ~1:2.4 on the T2 target
🚫 No Man's Land — Stay Completely Flat:
The $63,685–$64,218 band is a $533 institutional trap corridor right now$BTC has been oscillating inside this compression range for the past 36 hours with neither bulls nor bears achieving a clean directional closeTrading inside this zone without a confirmed trigger candle is fighting market makers on their home turf — wait for the break, not the noise
The BTC setup is the most consequential chart on the board right now — a recovering price pressing into a four-time rejected horizontal ceiling with VWAP and EMA converging in a rising wedge directly below, and $62,400 open air beneath if the structure collapses again.
Are you positioned long targeting the $64,218 breakout and riding it toward $65,200, or are you watching for the VWAP-EMA breakdown below $63,685 to short the flush back toward $62,800? Give me your exact entry level and target in the comments. 👇
{spot}(BTCUSDT)
#Write2Earn #BTC #BitcoinRecoversTo$64100
⚠️ Disclaimer: This article is for informational purposes only and is not financial advice. Always do your own research (DYOR).
BTC Reclaims $64K but VWAP Battle Decides Everything
Bitcoin has clawed back above the critical $64,016 horizontal after a brutal multi-day downtrend — but VWAP and EMA are converging just below, and one rejection candle ends this recovery cold.
The Immediate Battlefield
$BTC is printing $64,016.27 on the 4H Binance chart, up +0.14% — clinging to the upper edge of the visible dotted horizontal resistance zone that has capped price repeatedly since July 25 and again on July 30–31.
The immediate bias is cautiously bullish but structurally fragile: price has reclaimed the key $64,000 psychological level for the first time since August 1, but the recovery is happening on thin momentum with both VWAP and EMA still positioned below current price and actively converging upward beneath the rally.
The Technical Confluence
The VWAP ($63,818.61) and EMA(8) ($63,685.99) are separated by just $132.62 and both are rising in tandem directly beneath current price — that convergence is not coincidental, it's a classic post-recovery compression signal.
When VWAP and EMA rise in parallel while price pushes into a horizontal resistance ceiling, the two anchors are acting as a dynamic launchpad from below AND a pressure test from the resistance above — $BTC is caught in a vice between its own recovery momentum and a supply ceiling that has rejected price four times over the past two weeks, and the resolution of this compression will define the next $2,000 move in either direction.
📌 VWAP: $63,818.61 — institutional session anchor rising in recovery mode📌 EMA(8): $63,685.99 — momentum ribbon, converging with VWAP from below📌 Current Price: $64,016.27 — above both anchors and pressing into horizontal resistance📌 Key Horizontal: $64,000–$64,218 — the dotted ceiling zone that has defined the entire bearish range structure since July 25
The VWAP-EMA gap of $132 is tightening — when these two fuse completely while price is above them, the upside trigger becomes explosive; if price drops back into the gap, the downside flush is equally violent.
The Liquidation Map
Upside Walls:
🔴 $64,218 → Today's session high — immediate intraday ceiling and first supply test🔴 $64,800 → Major structural resistance from the July 30–31 distribution zone🔴 $65,200 → Secondary supply block from the July 27–28 breakdown origin🔴 $65,600 → Prior consolidation ceiling from the July 23–24 range🔴 $66,400–$66,800 → The macro session highs from July 22 — +4.1% to +4.7% from current price, full recovery target
Downside Risk Floors:
🟢 $63,818 → VWAP — first dynamic support on any pullback🟢 $63,685 → EMA(8) — momentum floor and secondary cushion🟢 $63,200 → Minor structural demand from the August 1–2 consolidation base🟢 $62,800 → The August 2–3 structural low — critical demand floor🟢 $62,400 → The absolute session low from August 2 — -2.5% from current price, macro last stand🟢 $61,600 → The catastrophic breakdown floor visible at the bottom of the chart grid
Tactical Execution Plan
⚡ Long Trigger:
Entry only on a confirmed 4H candle CLOSE above $64,218 (breaks today's session high and clears the horizontal resistance ceiling decisively)Target 1: $64,800 | Target 2: $65,200 | Target 3: $65,600Stop-Loss: Hard 4H close back below $63,818 (VWAP lost)Risk/Reward: ~1:3.2 on the T2 target
💀 Short Trigger:
Entry on a confirmed 4H candle CLOSE below $63,685 (breaks beneath EMA and VWAP stack simultaneously)Target 1: $63,200 | Target 2: $62,800Stop-Loss: Any 4H reclaim above $64,016Risk/Reward: ~1:2.4 on the T2 target
🚫 No Man's Land — Stay Completely Flat:
The $63,685–$64,218 band is a $533 institutional trap corridor right now$BTC has been oscillating inside this compression range for the past 36 hours with neither bulls nor bears achieving a clean directional closeTrading inside this zone without a confirmed trigger candle is fighting market makers on their home turf — wait for the break, not the noise
The BTC setup is the most consequential chart on the board right now — a recovering price pressing into a four-time rejected horizontal ceiling with VWAP and EMA converging in a rising wedge directly below, and $62,400 open air beneath if the structure collapses again.
Are you positioned long targeting the $64,218 breakout and riding it toward $65,200, or are you watching for the VWAP-EMA breakdown below $63,685 to short the flush back toward $62,800? Give me your exact entry level and target in the comments. 👇
#Write2Earn #BTC #BitcoinRecoversTo$64100
⚠️ Disclaimer: This article is for informational purposes only and is not financial advice. Always do your own research (DYOR).
The Immediate Battlefield
$BTC is printing $64,016.27 on the 4H Binance chart, up +0.14% — clinging to the upper edge of the visible dotted horizontal resistance zone that has capped price repeatedly since July 25 and again on July 30–31.
The immediate bias is cautiously bullish but structurally fragile: price has reclaimed the key $64,000 psychological level for the first time since August 1, but the recovery is happening on thin momentum with both VWAP and EMA still positioned below current price and actively converging upward beneath the rally.
The Technical Confluence
The VWAP ($63,818.61) and EMA(8) ($63,685.99) are separated by just $132.62 and both are rising in tandem directly beneath current price — that convergence is not coincidental, it's a classic post-recovery compression signal.
When VWAP and EMA rise in parallel while price pushes into a horizontal resistance ceiling, the two anchors are acting as a dynamic launchpad from below AND a pressure test from the resistance above — $BTC is caught in a vice between its own recovery momentum and a supply ceiling that has rejected price four times over the past two weeks, and the resolution of this compression will define the next $2,000 move in either direction.
📌 VWAP: $63,818.61 — institutional session anchor rising in recovery mode📌 EMA(8): $63,685.99 — momentum ribbon, converging with VWAP from below📌 Current Price: $64,016.27 — above both anchors and pressing into horizontal resistance📌 Key Horizontal: $64,000–$64,218 — the dotted ceiling zone that has defined the entire bearish range structure since July 25
The VWAP-EMA gap of $132 is tightening — when these two fuse completely while price is above them, the upside trigger becomes explosive; if price drops back into the gap, the downside flush is equally violent.
The Liquidation Map
Upside Walls:
🔴 $64,218 → Today's session high — immediate intraday ceiling and first supply test🔴 $64,800 → Major structural resistance from the July 30–31 distribution zone🔴 $65,200 → Secondary supply block from the July 27–28 breakdown origin🔴 $65,600 → Prior consolidation ceiling from the July 23–24 range🔴 $66,400–$66,800 → The macro session highs from July 22 — +4.1% to +4.7% from current price, full recovery target
Downside Risk Floors:
🟢 $63,818 → VWAP — first dynamic support on any pullback🟢 $63,685 → EMA(8) — momentum floor and secondary cushion🟢 $63,200 → Minor structural demand from the August 1–2 consolidation base🟢 $62,800 → The August 2–3 structural low — critical demand floor🟢 $62,400 → The absolute session low from August 2 — -2.5% from current price, macro last stand🟢 $61,600 → The catastrophic breakdown floor visible at the bottom of the chart grid
Tactical Execution Plan
⚡ Long Trigger:
Entry only on a confirmed 4H candle CLOSE above $64,218 (breaks today's session high and clears the horizontal resistance ceiling decisively)Target 1: $64,800 | Target 2: $65,200 | Target 3: $65,600Stop-Loss: Hard 4H close back below $63,818 (VWAP lost)Risk/Reward: ~1:3.2 on the T2 target
💀 Short Trigger:
Entry on a confirmed 4H candle CLOSE below $63,685 (breaks beneath EMA and VWAP stack simultaneously)Target 1: $63,200 | Target 2: $62,800Stop-Loss: Any 4H reclaim above $64,016Risk/Reward: ~1:2.4 on the T2 target
🚫 No Man's Land — Stay Completely Flat:
The $63,685–$64,218 band is a $533 institutional trap corridor right now$BTC has been oscillating inside this compression range for the past 36 hours with neither bulls nor bears achieving a clean directional closeTrading inside this zone without a confirmed trigger candle is fighting market makers on their home turf — wait for the break, not the noise
The BTC setup is the most consequential chart on the board right now — a recovering price pressing into a four-time rejected horizontal ceiling with VWAP and EMA converging in a rising wedge directly below, and $62,400 open air beneath if the structure collapses again.
Are you positioned long targeting the $64,218 breakout and riding it toward $65,200, or are you watching for the VWAP-EMA breakdown below $63,685 to short the flush back toward $62,800? Give me your exact entry level and target in the comments. 👇
#Write2Earn #BTC #BitcoinRecoversTo$64100
⚠️ Disclaimer: This article is for informational purposes only and is not financial advice. Always do your own research (DYOR).
127


·
--

Article
🚨 Checking in on Bob Soly & The Market Community 🚨"I only wanted reassurance about our friend and the analyst @BOB-Soly and about all the brothers trading in this market as well. We all know that current volatility, market pressures, the approaching Fear Index, and the shots from critical levels (Extreme Fear at 25) put everyone under significant nervous and psychological strain. [3]
Hey young people, always remember that markets come and go, but mental health and personal safety are the true, irreplaceable capital. Don’t let screens and numbers isolate you from your life or cause you frustration.
🚨 Checking in on Bob Soly & The Market Community 🚨
"I only wanted reassurance about our friend and the analyst @BOB-Soly and about all the brothers trading in this market as well. We all know that current volatility, market pressures, the approaching Fear Index, and the shots from critical levels (Extreme Fear at 25) put everyone under significant nervous and psychological strain. [3]
Hey young people, always remember that markets come and go, but mental health and personal safety are the true, irreplaceable capital. Don’t let screens and numbers isolate you from your life or cause you frustration.
Hey young people, always remember that markets come and go, but mental health and personal safety are the true, irreplaceable capital. Don’t let screens and numbers isolate you from your life or cause you frustration.
514
7
514

Log in to explore more content
Join global crypto users on Binance Square
⚡️ Get latest and useful information about crypto.
💬 Trusted by the world’s largest crypto exchange.
👍 Discover real insights from verified creators.
Email / Phone number
Trending Topics
1
#AIStocksWhatNext
233,044 views
2,414 Discussing
2
#BitcoinBreaksAboveMayHighNears$86K
8,170 views
138 Discussing
3
#DogecoinRises15%
20,652 views
730 Discussing
4
#$14BBitcoinOptionsExpireFriday
1,398 views
64 Discussing
5
#BNBMarketCapPassesBNYMellon
14,188 views
553 Discussing
6
#CryptoMarketCapReclaims$3Trillion
1,904 views
55 Discussing
7
#MuseOvertakesChatGPTAsTopFreeIOSApp
9,882 views
434 Discussing
8
#TokenizedStockPlatformsCouldLaunchNextQuarter
15,354 views
499 Discussing
9
#StrategyAdds950Bitcoin
20,486 views
557 Discussing
10
#CardanoAddedToX402KitForADAPayments
21,660 views
604 Discussing