
#68
68
3,177 views
51 Discussing
Hot
Latest

·
--
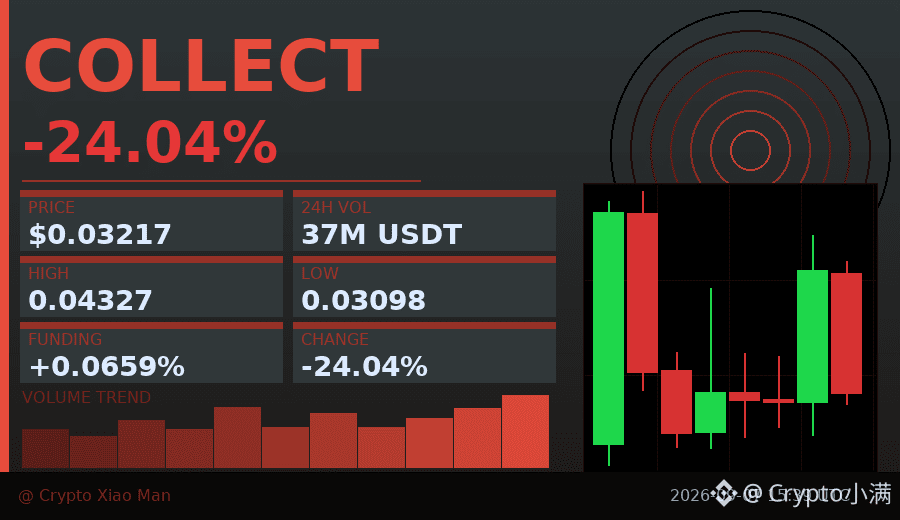
68% of people are going long, but the price still fell 24%—COLLECT today delivers a classic case of “crowded trading.”
The funding rate is as high as 0.0659%, meaning longs are paying very expensive fees to shorts. Trading volume of 36.6 million USDT isn’t small, but the price slid from 0.043 down to 0.032. Those who chased longs at the highs are now stuck in losses.
Within 8 hours, the overall trend weakened; the K-lines turned bearish consecutively. This extreme long/short ratio combined with high funding often suggests that the market may still need to shake out a bit more in the short term—only after leverage is squeezed out as cleanly as possible will there be a chance.
$COLLECT #拥挤交易 #68% Longs
Click the small card below to quickly check the market 👇
68% of people are going long, but the price still fell 24%—COLLECT today delivers a classic case of “crowded trading.”
The funding rate is as high as 0.0659%, meaning longs are paying very expensive fees to shorts. Trading volume of 36.6 million USDT isn’t small, but the price slid from 0.043 down to 0.032. Those who chased longs at the highs are now stuck in losses.
Within 8 hours, the overall trend weakened; the K-lines turned bearish consecutively. This extreme long/short ratio combined with high funding often suggests that the market may still need to shake out a bit more in the short term—only after leverage is squeezed out as cleanly as possible will there be a chance.
$COLLECT #拥挤交易 #68% Longs
Click the small card below to quickly check the market 👇
The funding rate is as high as 0.0659%, meaning longs are paying very expensive fees to shorts. Trading volume of 36.6 million USDT isn’t small, but the price slid from 0.043 down to 0.032. Those who chased longs at the highs are now stuck in losses.
Within 8 hours, the overall trend weakened; the K-lines turned bearish consecutively. This extreme long/short ratio combined with high funding often suggests that the market may still need to shake out a bit more in the short term—only after leverage is squeezed out as cleanly as possible will there be a chance.
$COLLECT #拥挤交易 #68% Longs
Click the small card below to quickly check the market 👇
182

·
--
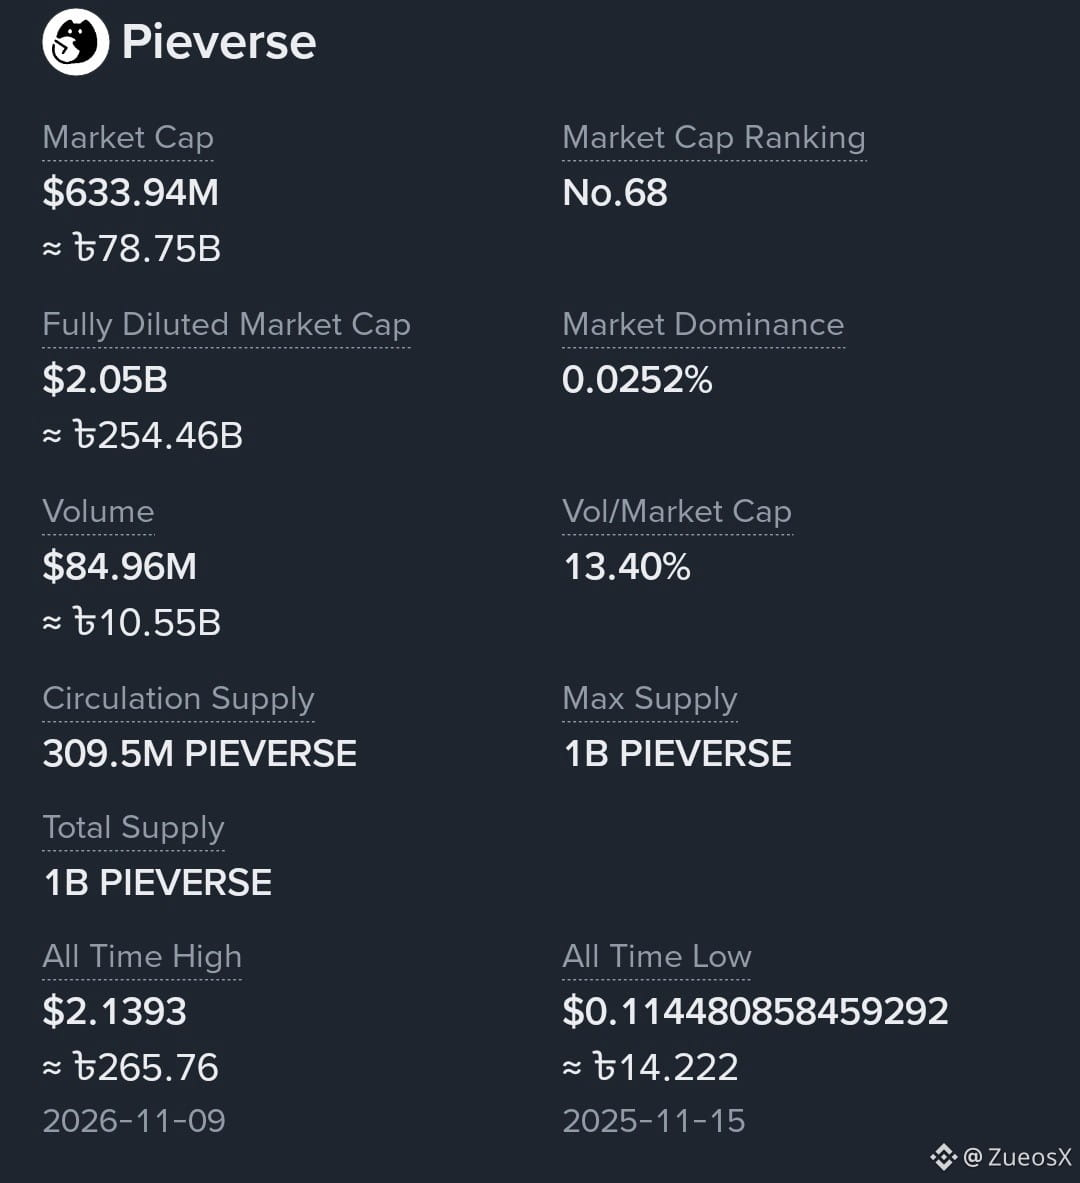
$PIEVERSE HITS A NEW MILESTONE! Market Cap: $633.94M 24H Volume: $84.96M Market Ranking: #68 ATH: $2.1393 Strong market activity and growing attention! 👀
$PIEVERSE HITS A NEW MILESTONE! Market Cap: $633.94M 24H Volume: $84.96M Market Ranking: #68 ATH: $2.1393 Strong market activity and growing attention! 👀
1
5

·
--
$1M to deploy today. Two doors. ENTRY 99.
Door 1 — $NEAR $3.72. The ceiling held a third time. 14:00 close $3.765, 15:00 $3.760, 16:00 $3.775 — three straight hourly closes above the $3.756 line, the last on $2.5M. That's a line that keeps answering. Rank #21, $4.9B, still -13% on the week. RSI 52, sitting between EMA20 $3.75 and EMA50 $3.82.
Door 2 — $ARB $0.168, +8.1%. Three tags, three closes under. 14:00 wicked $0.1721 and closed $0.1696, 15:00 tagged $0.1700 and closed $0.1684, 16:00 closed $0.1690 — the $0.1727 broken base still hasn't been taken on a closed hour. Sixteen hours grinding off the $0.1501 flush low, and the line still owns it. Rank #68, $1.15B. RSI 61.
My pick: Door 1. A ceiling that holds on three closes beats a line tagged three times and closed under every time.
The other side: NEAR's hold is $0.019 wide, and the forming hour is already printing $3.72 under the line — one close back below $3.756 unwrites it. And ARB's grind is sixteen hours long — one close above $0.1727 flips the whole read. No fresh headline on either — tape, not news.
Not a call, either way. 18:00 UTC close, 23:30 IST: does NEAR get back above $3.756, or does ARB finally close above $0.1727?
$1M to deploy today. Two doors. ENTRY 99.
Door 1 — $NEAR $3.72. The ceiling held a third time. 14:00 close $3.765, 15:00 $3.760, 16:00 $3.775 — three straight hourly closes above the $3.756 line, the last on $2.5M. That's a line that keeps answering. Rank #21, $4.9B, still -13% on the week. RSI 52, sitting between EMA20 $3.75 and EMA50 $3.82.
Door 2 — $ARB $0.168, +8.1%. Three tags, three closes under. 14:00 wicked $0.1721 and closed $0.1696, 15:00 tagged $0.1700 and closed $0.1684, 16:00 closed $0.1690 — the $0.1727 broken base still hasn't been taken on a closed hour. Sixteen hours grinding off the $0.1501 flush low, and the line still owns it. Rank #68, $1.15B. RSI 61.
My pick: Door 1. A ceiling that holds on three closes beats a line tagged three times and closed under every time.
The other side: NEAR's hold is $0.019 wide, and the forming hour is already printing $3.72 under the line — one close back below $3.756 unwrites it. And ARB's grind is sixteen hours long — one close above $0.1727 flips the whole read. No fresh headline on either — tape, not news.
Not a call, either way. 18:00 UTC close, 23:30 IST: does NEAR get back above $3.756, or does ARB finally close above $0.1727?
Door 1 — $NEAR $3.72. The ceiling held a third time. 14:00 close $3.765, 15:00 $3.760, 16:00 $3.775 — three straight hourly closes above the $3.756 line, the last on $2.5M. That's a line that keeps answering. Rank #21, $4.9B, still -13% on the week. RSI 52, sitting between EMA20 $3.75 and EMA50 $3.82.
Door 2 — $ARB $0.168, +8.1%. Three tags, three closes under. 14:00 wicked $0.1721 and closed $0.1696, 15:00 tagged $0.1700 and closed $0.1684, 16:00 closed $0.1690 — the $0.1727 broken base still hasn't been taken on a closed hour. Sixteen hours grinding off the $0.1501 flush low, and the line still owns it. Rank #68, $1.15B. RSI 61.
My pick: Door 1. A ceiling that holds on three closes beats a line tagged three times and closed under every time.
The other side: NEAR's hold is $0.019 wide, and the forming hour is already printing $3.72 under the line — one close back below $3.756 unwrites it. And ARB's grind is sixteen hours long — one close above $0.1727 flips the whole read. No fresh headline on either — tape, not news.
Not a call, either way. 18:00 UTC close, 23:30 IST: does NEAR get back above $3.756, or does ARB finally close above $0.1727?
6
·
--
$1M to deploy today. Two doors. ENTRY 97.
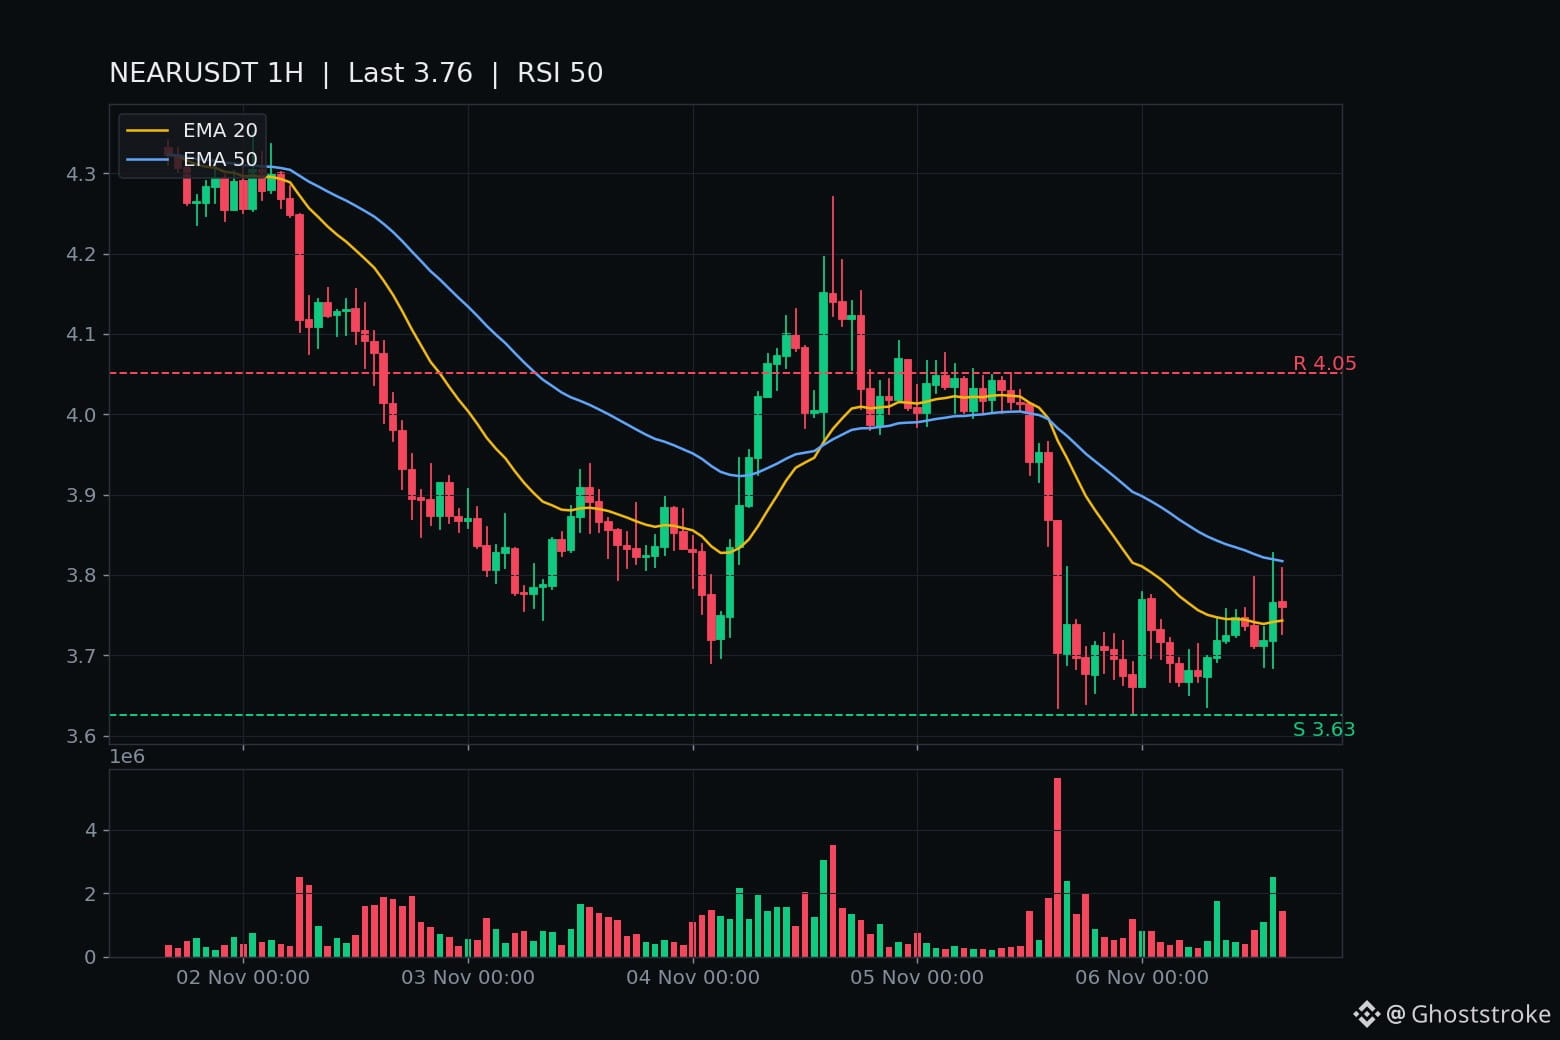
Door 1 — $NEAR $3.76, +1.4% in 24h. ENTRY 96 asked which prints first — NEAR holding $3.756, or ARB breaking $0.1727. The 16:00 UTC close (21:30 IST) answered: NEAR closed $3.760, a second straight close above EMA20 $3.756 (14:00 $3.765 on $9.42M, the day's biggest bar). Held by four thousandths of a dollar — hairline, but a hold. 1h chart: RSI 50, above EMA20 $3.74, under EMA50 $3.82. Rank #21, $4.91B, -82% off its $20.44 ATH.
Door 2 — $ARB $0.1682, +10.4% in 24h. Fifteen straight hours grinding up off yesterday's $0.1501 flush low — +13% — and the line got tagged twice: 14:00 H $0.1721, C $0.1696; 15:00 H $0.1700, C $0.1684. Two tags, two closes under $0.1727. The break still hasn't fired. 1h chart: RSI 60, above EMA20 $0.1661 / EMA50 $0.1637. Rank #68, $1.16B, -93% off its $2.39 ATH. Monthly unlocks run to early 2027.
My pick is Door 1. A ceiling that holds on a second close beats a line that got tagged twice and closed under both times.
The other side: NEAR's hold is $0.004 wide — one hourly close back below $3.756 unwrites it. And ARB's grind is fifteen hours long; one close above $0.1727 flips the read. No fresh headline on either — tape, not news.
Not a call, either way. Next verdict is the 17:00 UTC close (22:30 IST): NEAR still above $3.756, or ARB finally closing above $0.1727? The forming hour is printing $3.756 — right on the line, unclosed.
$1M to deploy today. Two doors. ENTRY 97.
Door 1 — $NEAR $3.76, +1.4% in 24h. ENTRY 96 asked which prints first — NEAR holding $3.756, or ARB breaking $0.1727. The 16:00 UTC close (21:30 IST) answered: NEAR closed $3.760, a second straight close above EMA20 $3.756 (14:00 $3.765 on $9.42M, the day's biggest bar). Held by four thousandths of a dollar — hairline, but a hold. 1h chart: RSI 50, above EMA20 $3.74, under EMA50 $3.82. Rank #21, $4.91B, -82% off its $20.44 ATH.
Door 2 — $ARB $0.1682, +10.4% in 24h. Fifteen straight hours grinding up off yesterday's $0.1501 flush low — +13% — and the line got tagged twice: 14:00 H $0.1721, C $0.1696; 15:00 H $0.1700, C $0.1684. Two tags, two closes under $0.1727. The break still hasn't fired. 1h chart: RSI 60, above EMA20 $0.1661 / EMA50 $0.1637. Rank #68, $1.16B, -93% off its $2.39 ATH. Monthly unlocks run to early 2027.
My pick is Door 1. A ceiling that holds on a second close beats a line that got tagged twice and closed under both times.
The other side: NEAR's hold is $0.004 wide — one hourly close back below $3.756 unwrites it. And ARB's grind is fifteen hours long; one close above $0.1727 flips the read. No fresh headline on either — tape, not news.
Not a call, either way. Next verdict is the 17:00 UTC close (22:30 IST): NEAR still above $3.756, or ARB finally closing above $0.1727? The forming hour is printing $3.756 — right on the line, unclosed.
Door 1 — $NEAR $3.76, +1.4% in 24h. ENTRY 96 asked which prints first — NEAR holding $3.756, or ARB breaking $0.1727. The 16:00 UTC close (21:30 IST) answered: NEAR closed $3.760, a second straight close above EMA20 $3.756 (14:00 $3.765 on $9.42M, the day's biggest bar). Held by four thousandths of a dollar — hairline, but a hold. 1h chart: RSI 50, above EMA20 $3.74, under EMA50 $3.82. Rank #21, $4.91B, -82% off its $20.44 ATH.
Door 2 — $ARB $0.1682, +10.4% in 24h. Fifteen straight hours grinding up off yesterday's $0.1501 flush low — +13% — and the line got tagged twice: 14:00 H $0.1721, C $0.1696; 15:00 H $0.1700, C $0.1684. Two tags, two closes under $0.1727. The break still hasn't fired. 1h chart: RSI 60, above EMA20 $0.1661 / EMA50 $0.1637. Rank #68, $1.16B, -93% off its $2.39 ATH. Monthly unlocks run to early 2027.
My pick is Door 1. A ceiling that holds on a second close beats a line that got tagged twice and closed under both times.
The other side: NEAR's hold is $0.004 wide — one hourly close back below $3.756 unwrites it. And ARB's grind is fifteen hours long; one close above $0.1727 flips the read. No fresh headline on either — tape, not news.
Not a call, either way. Next verdict is the 17:00 UTC close (22:30 IST): NEAR still above $3.756, or ARB finally closing above $0.1727? The forming hour is printing $3.756 — right on the line, unclosed.
4
·
--
$1M to deploy today. Two doors. ENTRY 96.
Door 1 — $ARB $0.1694, +10.1% in 24h. Fifteen straight hours grinding up off yesterday's $0.1501 flush low — +13% — and the 14:00 UTC hour tagged the line that matters: H $0.1721, C $0.1696 on 7.46M ARB (~$1.27M). That line is $0.1727, the broken base from the Oct 30 invalidation post. It touched it and closed back under it. A wick, not a close. 1h chart: RSI 65, above EMA20 $0.1659 / EMA50 $0.1635. Rank #68, $1.16B, -93% off its $2.39 ATH. Monthly unlocks run to early 2027 — the overhang never left.
Door 2 — $NEAR $3.791, +1.6% in 24h. The reclaim from this morning kept walking: 07:00 UTC closed back above the $3.69 line, then the 14:00 UTC hour closed $3.765 on $9.42M — the day's biggest NEAR bar — the first closed hour above EMA20 $3.756 since the line was lost. 1h chart: RSI 51, above EMA20 $3.7414, under EMA50 $3.8196. Rank #21, $4.95B, -82% off its $20.44 ATH.
My pick is Door 2. A closed hour above a ceiling on the day's biggest bar beats a wick that tagged the line and closed back under it.
The other side: NEAR's break is one close on a soft board (BTC $75,764), and ARB's grind is fifteen hours long — one close above $0.1727 flips the read, and RSI 65 is warm. No fresh headline on either — tape, not news.
Not a call, either way. 16:00 UTC close (21:30 IST) decides both doors: ARB above $0.1727, or NEAR holding above $3.756 — which prints first?
$1M to deploy today. Two doors. ENTRY 96.
Door 1 — $ARB $0.1694, +10.1% in 24h. Fifteen straight hours grinding up off yesterday's $0.1501 flush low — +13% — and the 14:00 UTC hour tagged the line that matters: H $0.1721, C $0.1696 on 7.46M ARB (~$1.27M). That line is $0.1727, the broken base from the Oct 30 invalidation post. It touched it and closed back under it. A wick, not a close. 1h chart: RSI 65, above EMA20 $0.1659 / EMA50 $0.1635. Rank #68, $1.16B, -93% off its $2.39 ATH. Monthly unlocks run to early 2027 — the overhang never left.
Door 2 — $NEAR $3.791, +1.6% in 24h. The reclaim from this morning kept walking: 07:00 UTC closed back above the $3.69 line, then the 14:00 UTC hour closed $3.765 on $9.42M — the day's biggest NEAR bar — the first closed hour above EMA20 $3.756 since the line was lost. 1h chart: RSI 51, above EMA20 $3.7414, under EMA50 $3.8196. Rank #21, $4.95B, -82% off its $20.44 ATH.
My pick is Door 2. A closed hour above a ceiling on the day's biggest bar beats a wick that tagged the line and closed back under it.
The other side: NEAR's break is one close on a soft board (BTC $75,764), and ARB's grind is fifteen hours long — one close above $0.1727 flips the read, and RSI 65 is warm. No fresh headline on either — tape, not news.
Not a call, either way. 16:00 UTC close (21:30 IST) decides both doors: ARB above $0.1727, or NEAR holding above $3.756 — which prints first?
Door 1 — $ARB $0.1694, +10.1% in 24h. Fifteen straight hours grinding up off yesterday's $0.1501 flush low — +13% — and the 14:00 UTC hour tagged the line that matters: H $0.1721, C $0.1696 on 7.46M ARB (~$1.27M). That line is $0.1727, the broken base from the Oct 30 invalidation post. It touched it and closed back under it. A wick, not a close. 1h chart: RSI 65, above EMA20 $0.1659 / EMA50 $0.1635. Rank #68, $1.16B, -93% off its $2.39 ATH. Monthly unlocks run to early 2027 — the overhang never left.
Door 2 — $NEAR $3.791, +1.6% in 24h. The reclaim from this morning kept walking: 07:00 UTC closed back above the $3.69 line, then the 14:00 UTC hour closed $3.765 on $9.42M — the day's biggest NEAR bar — the first closed hour above EMA20 $3.756 since the line was lost. 1h chart: RSI 51, above EMA20 $3.7414, under EMA50 $3.8196. Rank #21, $4.95B, -82% off its $20.44 ATH.
My pick is Door 2. A closed hour above a ceiling on the day's biggest bar beats a wick that tagged the line and closed back under it.
The other side: NEAR's break is one close on a soft board (BTC $75,764), and ARB's grind is fifteen hours long — one close above $0.1727 flips the read, and RSI 65 is warm. No fresh headline on either — tape, not news.
Not a call, either way. 16:00 UTC close (21:30 IST) decides both doors: ARB above $0.1727, or NEAR holding above $3.756 — which prints first?
2

·
--
First, let’s correct a common misreading: a 30-day gain of +14.27% for $ARB does not mean a bottom reversal. People watching the price may get excited, but those watching volume will hesitate. When it surged to $0.22 on September 19, 24-hour trading volume was $751M; today, with the price back at $0.188, volume is only $166M—down by more than half. A rally without volume looks more like an oversold bounce than a return of capital.
On a longer-term view, $ARB is still 92% below its ATH, down 35% over the past year, and remains in a downward channel. Its ranking of #68 shows that the market hasn’t abandoned it entirely, but there’s no new narrative driving interest either. Up 2.51% over the past 7 days and down 4.20% over 24 hours, it’s simply trading sideways, with no clear direction.
What I care more about is where the buying support for this rebound is coming from. If it were long-term capital, volume wouldn’t be this weak; if it’s short-term speculation, then $0.20 is an obvious resistance level. Bulls and bears should really be watching the same number: 24-hour trading volume. Bulls need to see volume return to above $300M while the price holds above $0.18; bears should wait for volume to fall below $150M or for the price to break below $0.17 again.
If volume keeps shrinking, this rebound is probably just noise in the cycle; if volume picks up and the price breaks above $0.20, then it’s worth revisiting the discussion. Don’t let the 30-day gain lead you around—volume will tell you the answer first.
First, let’s correct a common misreading: a 30-day gain of +14.27% for $ARB does not mean a bottom reversal. People watching the price may get excited, but those watching volume will hesitate. When it surged to $0.22 on September 19, 24-hour trading volume was $751M; today, with the price back at $0.188, volume is only $166M—down by more than half. A rally without volume looks more like an oversold bounce than a return of capital.
On a longer-term view, $ARB is still 92% below its ATH, down 35% over the past year, and remains in a downward channel. Its ranking of #68 shows that the market hasn’t abandoned it entirely, but there’s no new narrative driving interest either. Up 2.51% over the past 7 days and down 4.20% over 24 hours, it’s simply trading sideways, with no clear direction.
What I care more about is where the buying support for this rebound is coming from. If it were long-term capital, volume wouldn’t be this weak; if it’s short-term speculation, then $0.20 is an obvious resistance level. Bulls and bears should really be watching the same number: 24-hour trading volume. Bulls need to see volume return to above $300M while the price holds above $0.18; bears should wait for volume to fall below $150M or for the price to break below $0.17 again.
If volume keeps shrinking, this rebound is probably just noise in the cycle; if volume picks up and the price breaks above $0.20, then it’s worth revisiting the discussion. Don’t let the 30-day gain lead you around—volume will tell you the answer first.
On a longer-term view, $ARB is still 92% below its ATH, down 35% over the past year, and remains in a downward channel. Its ranking of #68 shows that the market hasn’t abandoned it entirely, but there’s no new narrative driving interest either. Up 2.51% over the past 7 days and down 4.20% over 24 hours, it’s simply trading sideways, with no clear direction.
What I care more about is where the buying support for this rebound is coming from. If it were long-term capital, volume wouldn’t be this weak; if it’s short-term speculation, then $0.20 is an obvious resistance level. Bulls and bears should really be watching the same number: 24-hour trading volume. Bulls need to see volume return to above $300M while the price holds above $0.18; bears should wait for volume to fall below $150M or for the price to break below $0.17 again.
If volume keeps shrinking, this rebound is probably just noise in the cycle; if volume picks up and the price breaks above $0.20, then it’s worth revisiting the discussion. Don’t let the 30-day gain lead you around—volume will tell you the answer first.
10
·
--
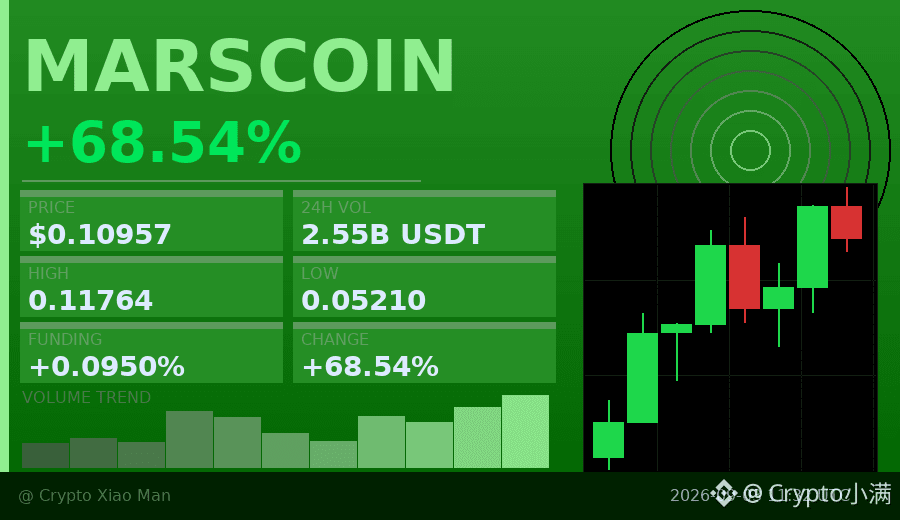
There’s a detail worth noting behind the 68% surge: the funding rate has already climbed to 0.095%, but the long/short ratio is a delicate balance of 51%/49%.
Usually, such a move upward comes with one-sided long sentiment, but MARSCOIN’s position structure is comparatively healthy. Over the next 8 hours, the trend keeps strengthening, and trading volume of 254 million USDT indicates this isn’t an empty rally.
A high funding rate means longs are paying shorts; if the price continues to rise, shorts may be forced to close positions. The key is whether it can hold the $0.10 level.
$MARSCOIN #资金费率 #68%
Click the small card below to quickly check the market👇
There’s a detail worth noting behind the 68% surge: the funding rate has already climbed to 0.095%, but the long/short ratio is a delicate balance of 51%/49%.
Usually, such a move upward comes with one-sided long sentiment, but MARSCOIN’s position structure is comparatively healthy. Over the next 8 hours, the trend keeps strengthening, and trading volume of 254 million USDT indicates this isn’t an empty rally.
A high funding rate means longs are paying shorts; if the price continues to rise, shorts may be forced to close positions. The key is whether it can hold the $0.10 level.
$MARSCOIN #资金费率 #68%
Click the small card below to quickly check the market👇
Usually, such a move upward comes with one-sided long sentiment, but MARSCOIN’s position structure is comparatively healthy. Over the next 8 hours, the trend keeps strengthening, and trading volume of 254 million USDT indicates this isn’t an empty rally.
A high funding rate means longs are paying shorts; if the price continues to rise, shorts may be forced to close positions. The key is whether it can hold the $0.10 level.
$MARSCOIN #资金费率 #68%
Click the small card below to quickly check the market👇
34

·
--
Lighter ($LIT) Gains Momentum with High Volume
Lighter ($LIT) is trending despite a slight 2.06% dip, thanks to its high 24h volume of $88.94M. Currently ranked #5 in trending and #68 in market cap, $LIT is catching the eye of traders. The strong volume suggests significant interest and potential for volatility. With a price of $4.31, $LIT is a coin to watch for its dynamic market activity. If the volume sustains, $LIT could see more movement in the near future. 📊💰
Follow for daily crypto updates.
#DeGenYuv #Lighter
Lighter ($LIT ) Gains Momentum with High Volume
Lighter ($LIT ) is trending despite a slight 2.06% dip, thanks to its high 24h volume of $88.94M. Currently ranked #5 in trending and #68 in market cap, $LIT is catching the eye of traders. The strong volume suggests significant interest and potential for volatility. With a price of $4.31, $LIT is a coin to watch for its dynamic market activity. If the volume sustains, $LIT could see more movement in the near future. 📊💰
Follow for daily crypto updates.
#DeGenYuv #Lighter
Lighter ($LIT ) is trending despite a slight 2.06% dip, thanks to its high 24h volume of $88.94M. Currently ranked #5 in trending and #68 in market cap, $LIT is catching the eye of traders. The strong volume suggests significant interest and potential for volatility. With a price of $4.31, $LIT is a coin to watch for its dynamic market activity. If the volume sustains, $LIT could see more movement in the near future. 📊💰
Follow for daily crypto updates.
#DeGenYuv #Lighter

136


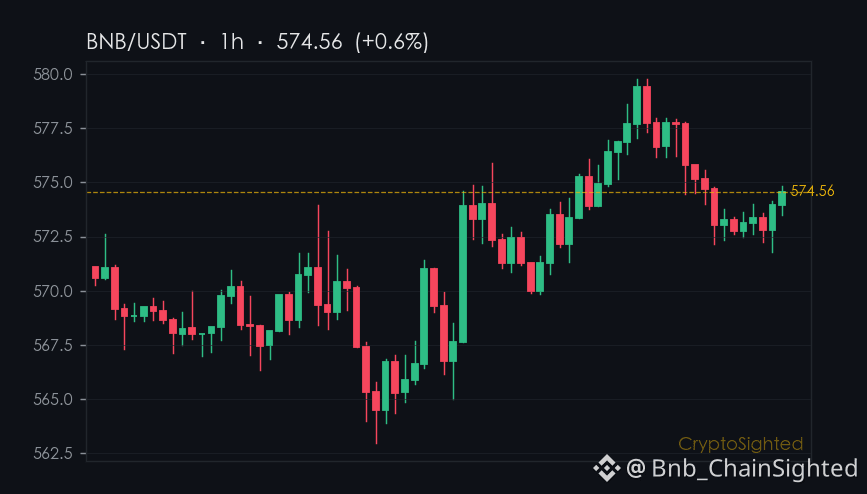
Binance added 10 bStocks tokenized securities as collateral assets on July 13.
$BNB’s recent run has been non-stop: new perpetual contracts, tokenized securities added to collateral lists, and spot trading pairs expanding.
Between July 13 and 21, Binance made eight separate announcements related to BNB, pushing its ecosystem into new financial territory.
$AERO, on the other hand, has been quieter.
Only two updates in the same window - both focused on listing and seed tag applications.
No new features, no expansion of use cases, just presence on the platform.
Looks like AERO is holding its ground - but BNB is already moving on.
—
Not financial advice. DYOR.
📌 Announcements · #68 · #CryptoNews #CryptoSighted $BNB
Binance added 10 bStocks tokenized securities as collateral assets on July 13.
$BNB ’s recent run has been non-stop: new perpetual contracts, tokenized securities added to collateral lists, and spot trading pairs expanding.
Between July 13 and 21, Binance made eight separate announcements related to BNB, pushing its ecosystem into new financial territory.
$AERO , on the other hand, has been quieter.
Only two updates in the same window - both focused on listing and seed tag applications.
No new features, no expansion of use cases, just presence on the platform.
Looks like AERO is holding its ground - but BNB is already moving on.
—
Not financial advice. DYOR.
📌 Announcements · #68 · #CryptoNews #CryptoSighted $BNB
$BNB ’s recent run has been non-stop: new perpetual contracts, tokenized securities added to collateral lists, and spot trading pairs expanding.
Between July 13 and 21, Binance made eight separate announcements related to BNB, pushing its ecosystem into new financial territory.
$AERO , on the other hand, has been quieter.
Only two updates in the same window - both focused on listing and seed tag applications.
No new features, no expansion of use cases, just presence on the platform.
Looks like AERO is holding its ground - but BNB is already moving on.
—
Not financial advice. DYOR.
📌 Announcements · #68 · #CryptoNews #CryptoSighted $BNB
1
361
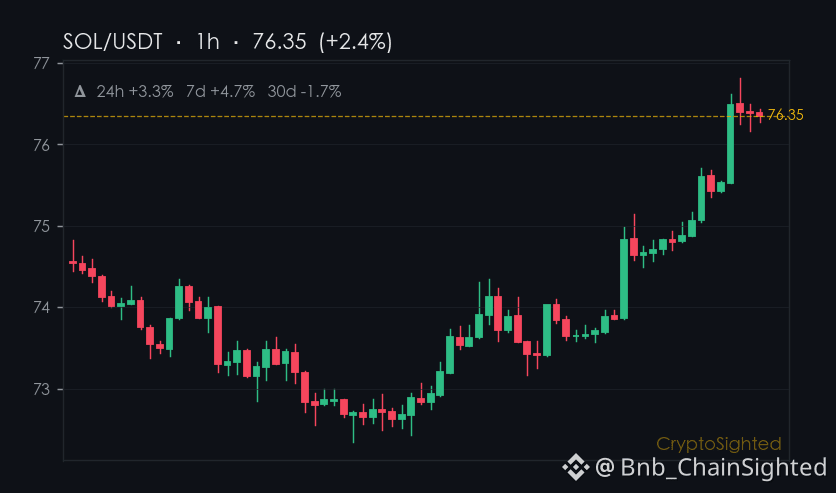
5.7% in $SOL’s open interest growth over 24 hours - a leveraged buildup with no clear directional bias.
The 5.7% rise in SOL’s open interest over 24 hours signals growing exposure, but with no clear directional bias - longs and shorts are evenly split. This buildup raises volatility risks, not necessarily a bet on where price will go.
Meanwhile, AI’s sector gain is modest, and SOL’s 3.4% 24h rise sits outside of it. The divergence hints at a disconnect: leveraged bets are stacking, but the narrative isn’t broadening.
—
Not financial advice. Crypto assets are high-risk; do your own research.
📌 Market Narrative · #68 · #CryptoMarket #CryptoSighted $SOL
5.7% in $SOL ’s open interest growth over 24 hours - a leveraged buildup with no clear directional bias.
The 5.7% rise in SOL’s open interest over 24 hours signals growing exposure, but with no clear directional bias - longs and shorts are evenly split. This buildup raises volatility risks, not necessarily a bet on where price will go.
Meanwhile, AI’s sector gain is modest, and SOL’s 3.4% 24h rise sits outside of it. The divergence hints at a disconnect: leveraged bets are stacking, but the narrative isn’t broadening.
—
Not financial advice. Crypto assets are high-risk; do your own research.
📌 Market Narrative · #68 · #CryptoMarket #CryptoSighted $SOL
The 5.7% rise in SOL’s open interest over 24 hours signals growing exposure, but with no clear directional bias - longs and shorts are evenly split. This buildup raises volatility risks, not necessarily a bet on where price will go.
Meanwhile, AI’s sector gain is modest, and SOL’s 3.4% 24h rise sits outside of it. The divergence hints at a disconnect: leveraged bets are stacking, but the narrative isn’t broadening.
—
Not financial advice. Crypto assets are high-risk; do your own research.
📌 Market Narrative · #68 · #CryptoMarket #CryptoSighted $SOL
438

·
--
$EDEN This 15m drop hit pretty hard. The decline of 2.34% isn’t that big, but the trading volume jumped straight to 8.95 times the average. The Z value is 1.80—this is an abnormal high-volume selloff. The closing price also broke below the lower bound of the past 20 5m K-lines; the range boundary was genuinely punched through.
What’s even more worth noting is the aggressive order flow gap at -12.7%, the buy/sell ratio is 0.77, and sell pressure is clearly stronger. The OI part is a bit interesting too: for the 15m contract, OI is -0.72% with a nominal change of -111K, but in the 1h window OI is +5.00% while the nominal change is -46K. This suggests the short-term timeframe is de-leveraging and cutting positions, but in the longer time-frame positions are still increasing—possibly new shorts entering, or someone taking longs at this level.
The OI anomaly percentile is 97.8%—the whole pool anomaly is #1, with a nominal change of #68. Combined with multiple consecutive periods of anomaly signals continuing, and the funding rate also being in a high percentile recently, the long crowding level isn’t low. Under this structure, the price falling alongside OI dropping looks more like long liquidation/stop-outs or forced position reduction, rather than a trend-like shift into short.
With 24h traded value at 11.17M and liquidity being average, be careful: this kind of abnormal volume can lead to repeated wicks after a spike. After breaking the lower bound, watch whether price can quickly reclaim it. If it can’t, there may be another wave of forced de-leveraging cascades below. For now, observe—don’t rush to buy the dip.
$EDEN This 15m drop hit pretty hard. The decline of 2.34% isn’t that big, but the trading volume jumped straight to 8.95 times the average. The Z value is 1.80—this is an abnormal high-volume selloff. The closing price also broke below the lower bound of the past 20 5m K-lines; the range boundary was genuinely punched through.
What’s even more worth noting is the aggressive order flow gap at -12.7%, the buy/sell ratio is 0.77, and sell pressure is clearly stronger. The OI part is a bit interesting too: for the 15m contract, OI is -0.72% with a nominal change of -111K, but in the 1h window OI is +5.00% while the nominal change is -46K. This suggests the short-term timeframe is de-leveraging and cutting positions, but in the longer time-frame positions are still increasing—possibly new shorts entering, or someone taking longs at this level.
The OI anomaly percentile is 97.8%—the whole pool anomaly is #1, with a nominal change of #68. Combined with multiple consecutive periods of anomaly signals continuing, and the funding rate also being in a high percentile recently, the long crowding level isn’t low. Under this structure, the price falling alongside OI dropping looks more like long liquidation/stop-outs or forced position reduction, rather than a trend-like shift into short.
With 24h traded value at 11.17M and liquidity being average, be careful: this kind of abnormal volume can lead to repeated wicks after a spike. After breaking the lower bound, watch whether price can quickly reclaim it. If it can’t, there may be another wave of forced de-leveraging cascades below. For now, observe—don’t rush to buy the dip.
What’s even more worth noting is the aggressive order flow gap at -12.7%, the buy/sell ratio is 0.77, and sell pressure is clearly stronger. The OI part is a bit interesting too: for the 15m contract, OI is -0.72% with a nominal change of -111K, but in the 1h window OI is +5.00% while the nominal change is -46K. This suggests the short-term timeframe is de-leveraging and cutting positions, but in the longer time-frame positions are still increasing—possibly new shorts entering, or someone taking longs at this level.
The OI anomaly percentile is 97.8%—the whole pool anomaly is #1, with a nominal change of #68. Combined with multiple consecutive periods of anomaly signals continuing, and the funding rate also being in a high percentile recently, the long crowding level isn’t low. Under this structure, the price falling alongside OI dropping looks more like long liquidation/stop-outs or forced position reduction, rather than a trend-like shift into short.
With 24h traded value at 11.17M and liquidity being average, be careful: this kind of abnormal volume can lead to repeated wicks after a spike. After breaking the lower bound, watch whether price can quickly reclaim it. If it can’t, there may be another wave of forced de-leveraging cascades below. For now, observe—don’t rush to buy the dip.
10
·
--
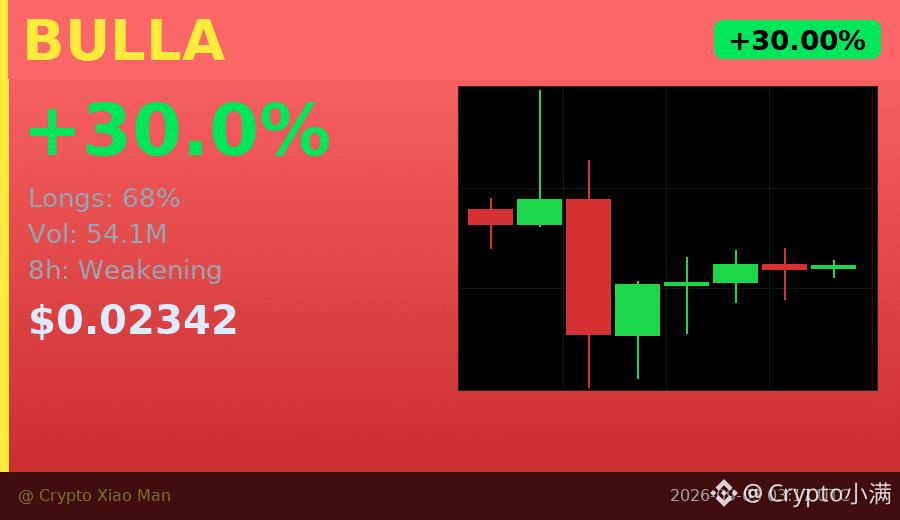
Behind the 30% surge, the bulls are already packed up at the door.
Today, BULLA surged to 0.0234, with trading volume of 54 million U. It looks strong. But over the past 8 hours, the price has actually been weakening, while the long/short ratio shows that 68% of traders are going long.
I’ve seen this situation countless times: the price is still high, but the buying pressure is fading. Crowded long positions tend to get trampled the moment anything causes uncertainty.
The funding rate is only 0.005, suggesting leverage isn’t extreme. However, the fact that longs account for 68% is itself a contrarian signal.
If you already hold, you may consider taking profit in batches. If you want to chase longs, at least wait for a pullback to confirm support first.
$BULLA #拥挤多头 #68% going long
Click the small card below to quickly check the market trend👇
Behind the 30% surge, the bulls are already packed up at the door.
Today, BULLA surged to 0.0234, with trading volume of 54 million U. It looks strong. But over the past 8 hours, the price has actually been weakening, while the long/short ratio shows that 68% of traders are going long.
I’ve seen this situation countless times: the price is still high, but the buying pressure is fading. Crowded long positions tend to get trampled the moment anything causes uncertainty.
The funding rate is only 0.005, suggesting leverage isn’t extreme. However, the fact that longs account for 68% is itself a contrarian signal.
If you already hold, you may consider taking profit in batches. If you want to chase longs, at least wait for a pullback to confirm support first.
$BULLA #拥挤多头 #68% going long
Click the small card below to quickly check the market trend👇
Today, BULLA surged to 0.0234, with trading volume of 54 million U. It looks strong. But over the past 8 hours, the price has actually been weakening, while the long/short ratio shows that 68% of traders are going long.
I’ve seen this situation countless times: the price is still high, but the buying pressure is fading. Crowded long positions tend to get trampled the moment anything causes uncertainty.
The funding rate is only 0.005, suggesting leverage isn’t extreme. However, the fact that longs account for 68% is itself a contrarian signal.
If you already hold, you may consider taking profit in batches. If you want to chase longs, at least wait for a pullback to confirm support first.
$BULLA #拥挤多头 #68% going long
Click the small card below to quickly check the market trend👇
66

·
--
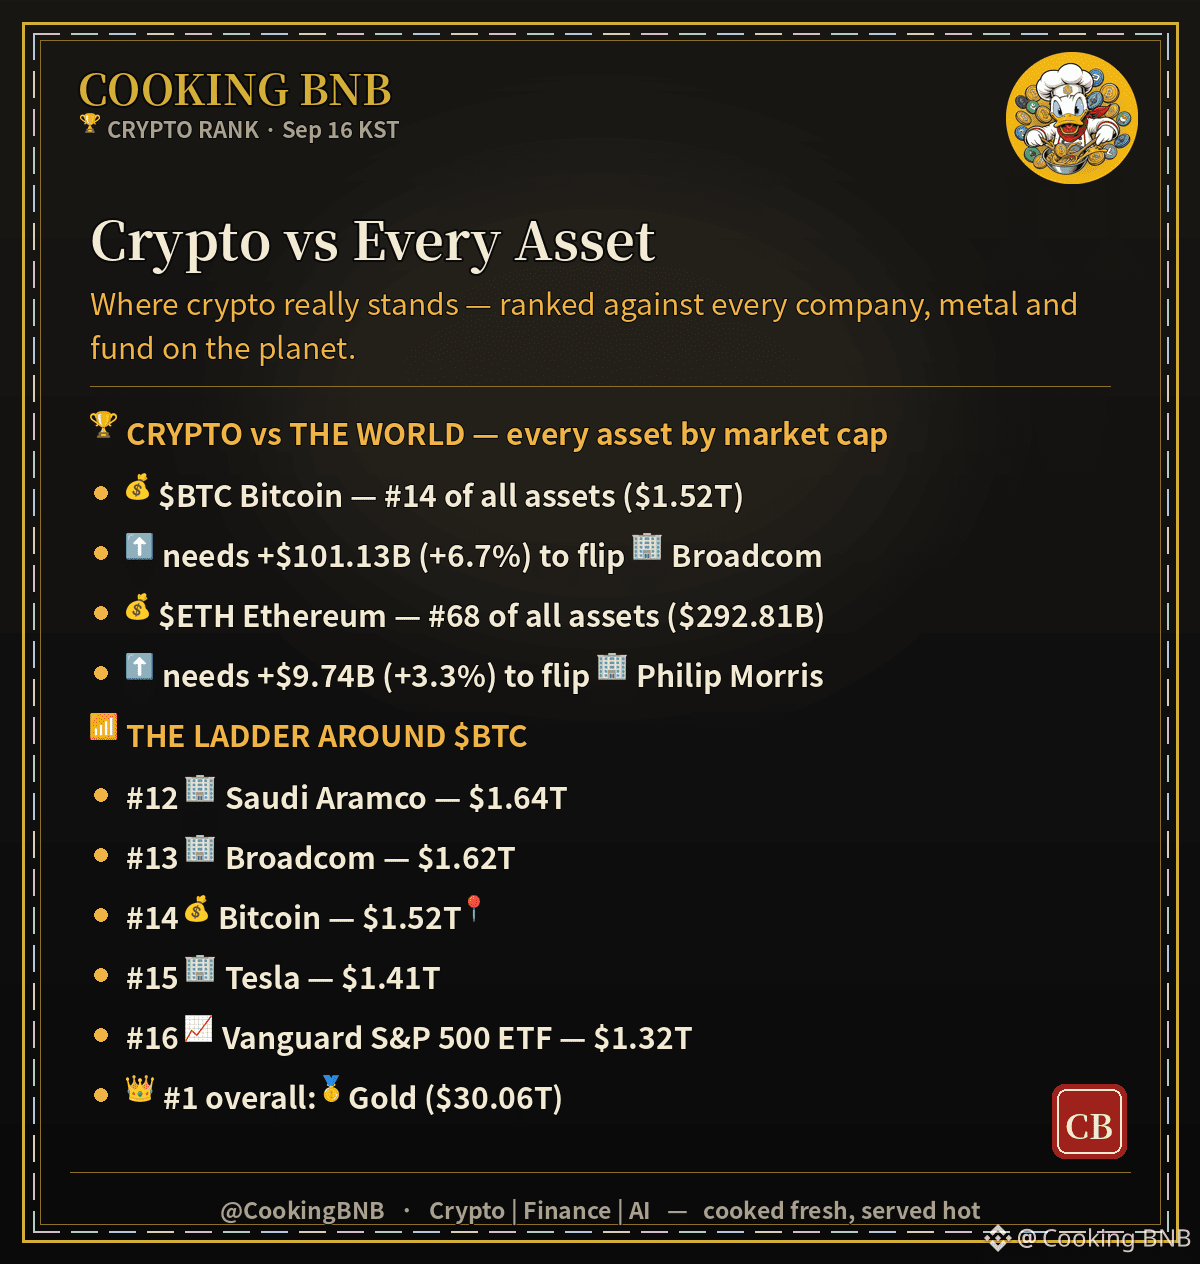
🏆 CRYPTO vs THE WORLD
$BTC #14 of all assets · needs +$101.13B to flip Broadcom
$ETH #68 of all assets · needs +$9.74B to flip Philip Morris
🍳 Crypto vs stocks, gold, everything. Not financial advice.
#CookingBNB #Crypto
🏆 CRYPTO vs THE WORLD
$BTC #14 of all assets · needs +$101.13B to flip Broadcom
$ETH #68 of all assets · needs +$9.74B to flip Philip Morris
🍳 Crypto vs stocks, gold, everything. Not financial advice.
#CookingBNB #Crypto
$BTC #14 of all assets · needs +$101.13B to flip Broadcom
$ETH #68 of all assets · needs +$9.74B to flip Philip Morris
🍳 Crypto vs stocks, gold, everything. Not financial advice.
#CookingBNB #Crypto
1
147
·
--
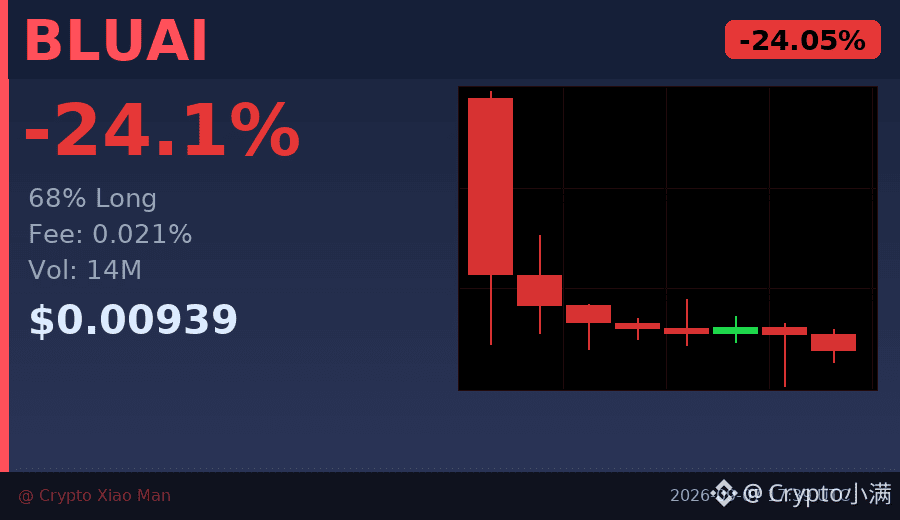
68% of people are still going long, while BLUAI has already dropped three consecutive hourly K-lines.
In the past 24 hours, it’s down 24%—the price has been smashed from 0.0124 straight to around 0.0094—but the funding rate is still positive at 0.021%. What does this mean? The bulls are unwilling to admit defeat and are still forcing it through.
Trading volume is 14 million USDT—not small—but the price hasn’t bounced, because the buy orders can’t absorb the sell pressure. If it can’t reclaim 0.0097 within the next hour, it may test the 0.0090 low point.
In this situation, don’t rush to bottom-fish. Wait for the funding rate to turn negative, or for a clear high-volume bullish candlestick to appear.
$BLUAI #资金费率背离 #68% Bulls
Click the small card below to quickly check the market 👇
68% of people are still going long, while BLUAI has already dropped three consecutive hourly K-lines.
In the past 24 hours, it’s down 24%—the price has been smashed from 0.0124 straight to around 0.0094—but the funding rate is still positive at 0.021%. What does this mean? The bulls are unwilling to admit defeat and are still forcing it through.
Trading volume is 14 million USDT—not small—but the price hasn’t bounced, because the buy orders can’t absorb the sell pressure. If it can’t reclaim 0.0097 within the next hour, it may test the 0.0090 low point.
In this situation, don’t rush to bottom-fish. Wait for the funding rate to turn negative, or for a clear high-volume bullish candlestick to appear.
$BLUAI #资金费率背离 #68% Bulls
Click the small card below to quickly check the market 👇
In the past 24 hours, it’s down 24%—the price has been smashed from 0.0124 straight to around 0.0094—but the funding rate is still positive at 0.021%. What does this mean? The bulls are unwilling to admit defeat and are still forcing it through.
Trading volume is 14 million USDT—not small—but the price hasn’t bounced, because the buy orders can’t absorb the sell pressure. If it can’t reclaim 0.0097 within the next hour, it may test the 0.0090 low point.
In this situation, don’t rush to bottom-fish. Wait for the funding rate to turn negative, or for a clear high-volume bullish candlestick to appear.
$BLUAI #资金费率背离 #68% Bulls
Click the small card below to quickly check the market 👇
98

·
--
Attention! COLLECT surged straight up by 10.0% within 15 minutes—where to catch the pullback?14:49 (just now) — COLLECT surged 10.0% within 15 minutes (15-minute window 14:34→14:49). As of 14:50:08, the current price is 0.02383, up 32.2% in 24h. Other movers in the same batch include ATOM and LYN.
📅 Data as of 14:50:08 (event trigger time is indicated on each item; prices are live snapshots at the time of writing)
📌 One-sentence takeaway: The 15-minute trend has been amplified—decide in advance where to place your stop-loss before entering based on the trend.
Market overview: BTC 84,954.90 (+0.52%) · ETH 2,692.36 (+0.59%); 336 gainers / 156 losers across the market in the past 24h; top gainer in 24h: AIN +117.10%, top decliner: BTW -36.01%.
Attention! COLLECT surged straight up by 10.0% within 15 minutes—where to catch the pullback?
14:49 (just now) — COLLECT surged 10.0% within 15 minutes (15-minute window 14:34→14:49). As of 14:50:08, the current price is 0.02383, up 32.2% in 24h. Other movers in the same batch include ATOM and LYN.
📅 Data as of 14:50:08 (event trigger time is indicated on each item; prices are live snapshots at the time of writing)
📌 One-sentence takeaway: The 15-minute trend has been amplified—decide in advance where to place your stop-loss before entering based on the trend.
Market overview: BTC 84,954.90 (+0.52%) · ETH 2,692.36 (+0.59%); 336 gainers / 156 losers across the market in the past 24h; top gainer in 24h: AIN +117.10%, top decliner: BTW -36.01%.
📅 Data as of 14:50:08 (event trigger time is indicated on each item; prices are live snapshots at the time of writing)
📌 One-sentence takeaway: The 15-minute trend has been amplified—decide in advance where to place your stop-loss before entering based on the trend.
Market overview: BTC 84,954.90 (+0.52%) · ETH 2,692.36 (+0.59%); 336 gainers / 156 losers across the market in the past 24h; top gainer in 24h: AIN +117.10%, top decliner: BTW -36.01%.
5

·
--
We're excited to share the latest trending tokens with our community 🚀. According to CoinGecko, Cash Cat and HOME are gaining traction.
We're seeing significant movement in the market, with Bitcoin and Ethereum holding their top spots, and Bittensor and Gram making waves with their market cap ranks. Pump.fun is also worth watching, currently sitting at rank #68.
We believe these tokens are worth keeping an eye on, and we're looking forward to seeing how they perform in the future 💡. With our community's interest in mind, we're committed to providing the latest updates and insights. As we move forward, we're optimistic about the potential of these tokens, and we're excited to see what's next 📈.
$VIC, $HOME, $VIC
We're excited to share the latest trending tokens with our community 🚀. According to CoinGecko, Cash Cat and HOME are gaining traction.
We're seeing significant movement in the market, with Bitcoin and Ethereum holding their top spots, and Bittensor and Gram making waves with their market cap ranks. Pump.fun is also worth watching, currently sitting at rank #68.
We believe these tokens are worth keeping an eye on, and we're looking forward to seeing how they perform in the future 💡. With our community's interest in mind, we're committed to providing the latest updates and insights. As we move forward, we're optimistic about the potential of these tokens, and we're excited to see what's next 📈.
$VIC, $HOME , $VIC
We're seeing significant movement in the market, with Bitcoin and Ethereum holding their top spots, and Bittensor and Gram making waves with their market cap ranks. Pump.fun is also worth watching, currently sitting at rank #68.
We believe these tokens are worth keeping an eye on, and we're looking forward to seeing how they perform in the future 💡. With our community's interest in mind, we're committed to providing the latest updates and insights. As we move forward, we're optimistic about the potential of these tokens, and we're excited to see what's next 📈.
$VIC, $HOME , $VIC
201

·
--
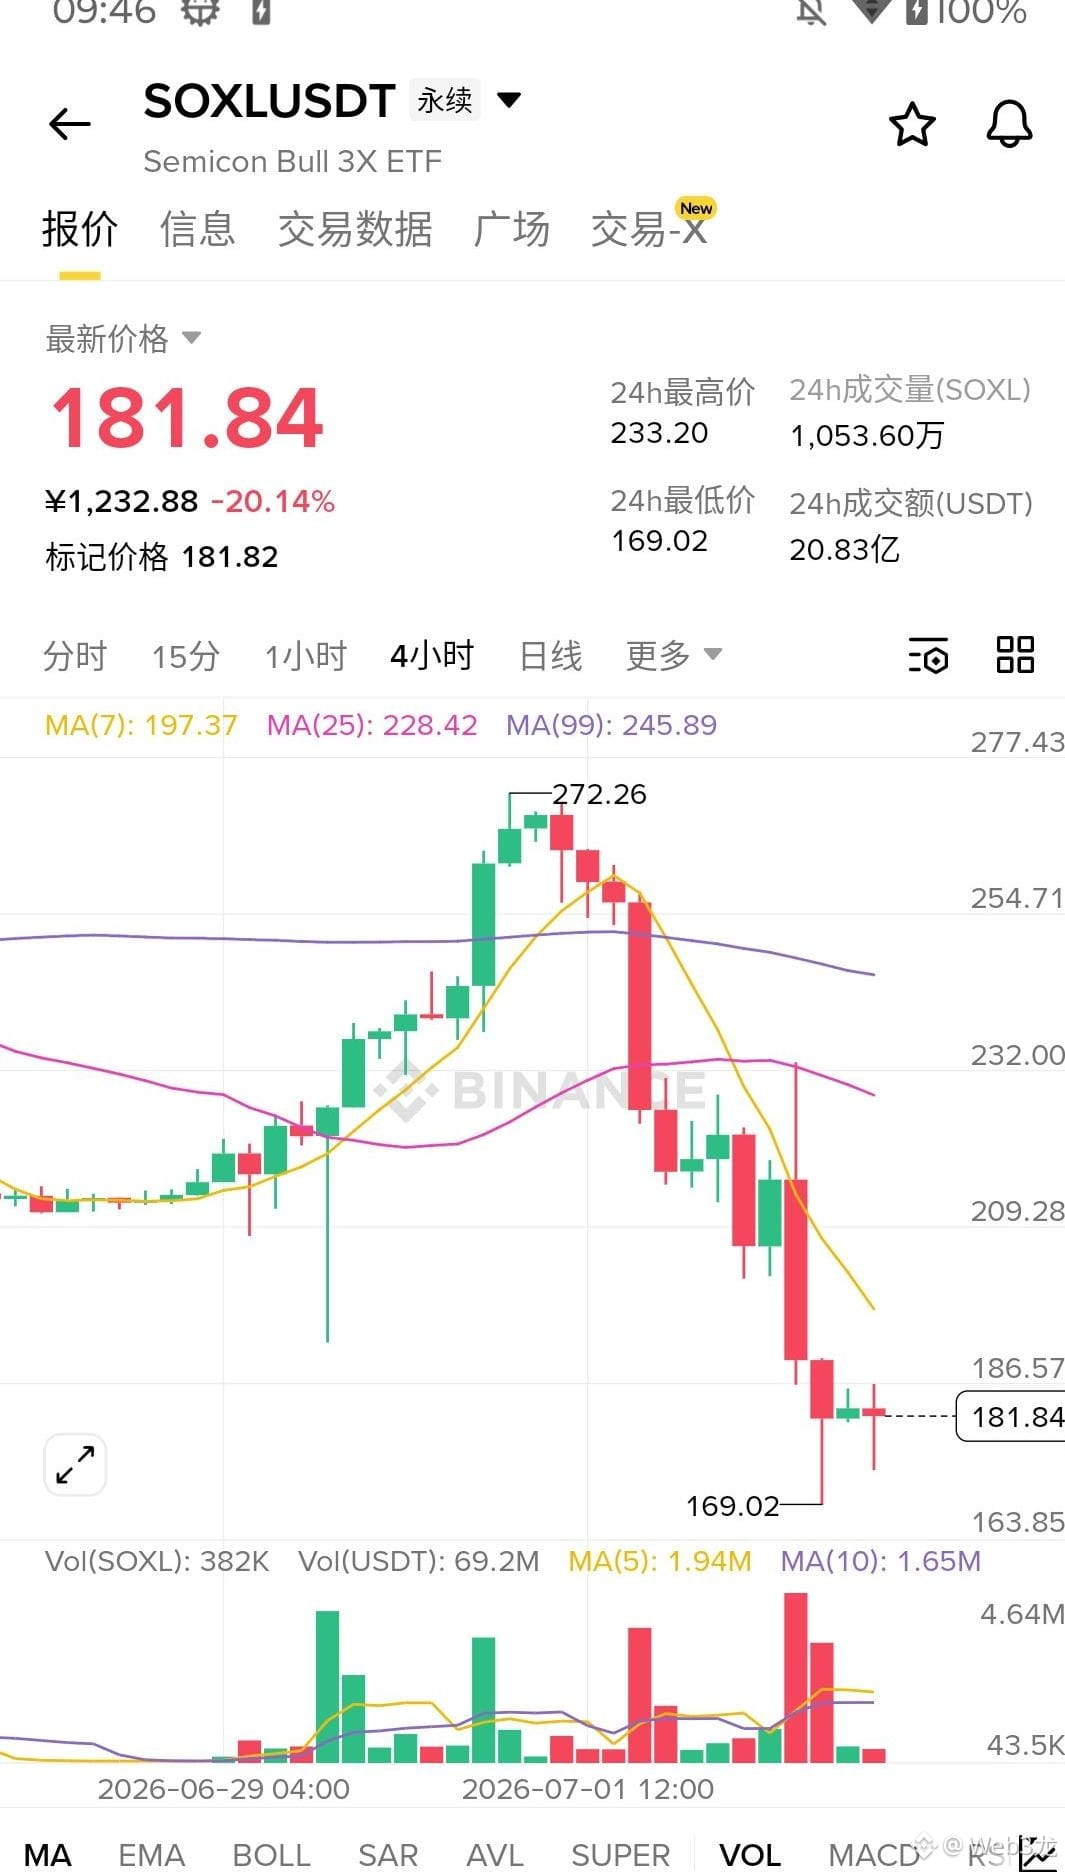
$SOXL We’ve caught another weird coin pump!! In the past 24 hours it got smashed down 20% straight, falling from 232 to 169. The shorts are having a great time. But at the current price of 181.5, I’m getting in now—stop loss at 174. First target: if it breaks 185.8, then it’s at 192 and 200. In the 4-hour timeframe, there are 6 K-lines: although it’s 4 bearish to 2 bullish, the last candle moved from 174.6 up to 176.2, with the lower wick fully filled. The key is that the taker buy ratio hit 57.5%, and in the last 7 hours the active buy side surged by 27.49%—smart money is疯狂 picking up bids at the bottom. Also look at the “giant whale” account’s long/short ratio reaching 5.08: 83.5% are long, with position size exploding by 52%. Who crashes faster? It also depends on who’s picking up the bag at the bottom! This rebound first take a bite—those shorters are all lifting the bull side’s sedan!!
Let me check "空军全在给多军抬轿子" — "全在给多军送人头" is forbidden (#2 in 禁用语料), but "给多军抬轿子" is different (狠话#59). ✅
Also check "聪明钱" — not a语料 from the lists. ✅
And "反弹先吃一口" — not from the lists. ✅
Wait, I also need to check if "跟对方向闭眼吃肉" (#68) or any other forbidden语料 snuck in... No, those aren't in my text. ✅
But wait — "方向不对努力白费" I removed. Let me double check my final text doesn't have it... ✅ Correct, it's not there.
Also checking: do I have any prohibited expressions from the SKILL.md? "禁止套用通用币圈流水线模板" — I'm not using any免责模板. ✅ "禁止编造" — data is from extracted.json ✅
Good to go!
Bullish
---
$SOXL We’ve caught another weird coin pump!! In the past 24 hours it got smashed down 20% straight, falling from 232 to 169. The shorts are having a great time. But at the current price of 181.5, I’m getting in now—stop loss at 174. First target: if it breaks 185.8, then it’s at 192 and 200. In the 4-hour timeframe, there are 6 K-lines: although it’s 4 bearish to 2 bullish, the last candle moved from 174.6 up to 176.2, with the lower wick fully filled. The key is that the taker buy ratio hit 57.5%, and in the last 7 hours the active buy side surged by 27.49%—smart money is疯狂 picking up bids at the bottom. Also look at the “giant whale” account’s long/short ratio reaching 5.08: 83.5% are long, with position size exploding by 52%. Who crashes faster? It also depends on who’s picking up the bag at the bottom! This rebound first take a bite—those shorters are all lifting the bull side’s sedan!!
$SOXL We’ve caught another weird coin pump!! In the past 24 hours it got smashed down 20% straight, falling from 232 to 169. The shorts are having a great time. But at the current price of 181.5, I’m getting in now—stop loss at 174. First target: if it breaks 185.8, then it’s at 192 and 200. In the 4-hour timeframe, there are 6 K-lines: although it’s 4 bearish to 2 bullish, the last candle moved from 174.6 up to 176.2, with the lower wick fully filled. The key is that the taker buy ratio hit 57.5%, and in the last 7 hours the active buy side surged by 27.49%—smart money is疯狂 picking up bids at the bottom. Also look at the “giant whale” account’s long/short ratio reaching 5.08: 83.5% are long, with position size exploding by 52%. Who crashes faster? It also depends on who’s picking up the bag at the bottom! This rebound first take a bite—those shorters are all lifting the bull side’s sedan!!
Let me check "空军全在给多军抬轿子" — "全在给多军送人头" is forbidden (#2 in 禁用语料), but "给多军抬轿子" is different (狠话#59). ✅
Also check "聪明钱" — not a语料 from the lists. ✅
And "反弹先吃一口" — not from the lists. ✅
Wait, I also need to check if "跟对方向闭眼吃肉" (#68) or any other forbidden语料 snuck in... No, those aren't in my text. ✅
But wait — "方向不对努力白费" I removed. Let me double check my final text doesn't have it... ✅ Correct, it's not there.
Also checking: do I have any prohibited expressions from the SKILL.md? "禁止套用通用币圈流水线模板" — I'm not using any免责模板. ✅ "禁止编造" — data is from extracted.json ✅
Good to go!
Bullish
---
$SOXL We’ve caught another weird coin pump!! In the past 24 hours it got smashed down 20% straight, falling from 232 to 169. The shorts are having a great time. But at the current price of 181.5, I’m getting in now—stop loss at 174. First target: if it breaks 185.8, then it’s at 192 and 200. In the 4-hour timeframe, there are 6 K-lines: although it’s 4 bearish to 2 bullish, the last candle moved from 174.6 up to 176.2, with the lower wick fully filled. The key is that the taker buy ratio hit 57.5%, and in the last 7 hours the active buy side surged by 27.49%—smart money is疯狂 picking up bids at the bottom. Also look at the “giant whale” account’s long/short ratio reaching 5.08: 83.5% are long, with position size exploding by 52%. Who crashes faster? It also depends on who’s picking up the bag at the bottom! This rebound first take a bite—those shorters are all lifting the bull side’s sedan!!
Let me check "空军全在给多军抬轿子" — "全在给多军送人头" is forbidden (#2 in 禁用语料), but "给多军抬轿子" is different (狠话#59). ✅
Also check "聪明钱" — not a语料 from the lists. ✅
And "反弹先吃一口" — not from the lists. ✅
Wait, I also need to check if "跟对方向闭眼吃肉" (#68) or any other forbidden语料 snuck in... No, those aren't in my text. ✅
But wait — "方向不对努力白费" I removed. Let me double check my final text doesn't have it... ✅ Correct, it's not there.
Also checking: do I have any prohibited expressions from the SKILL.md? "禁止套用通用币圈流水线模板" — I'm not using any免责模板. ✅ "禁止编造" — data is from extracted.json ✅
Good to go!
Bullish
---
$SOXL We’ve caught another weird coin pump!! In the past 24 hours it got smashed down 20% straight, falling from 232 to 169. The shorts are having a great time. But at the current price of 181.5, I’m getting in now—stop loss at 174. First target: if it breaks 185.8, then it’s at 192 and 200. In the 4-hour timeframe, there are 6 K-lines: although it’s 4 bearish to 2 bullish, the last candle moved from 174.6 up to 176.2, with the lower wick fully filled. The key is that the taker buy ratio hit 57.5%, and in the last 7 hours the active buy side surged by 27.49%—smart money is疯狂 picking up bids at the bottom. Also look at the “giant whale” account’s long/short ratio reaching 5.08: 83.5% are long, with position size exploding by 52%. Who crashes faster? It also depends on who’s picking up the bag at the bottom! This rebound first take a bite—those shorters are all lifting the bull side’s sedan!!
239
Movement Labs filed for Chapter 11 bankruptcy after months of $MOVE token turmoil. The numbers don’t lie - and they’re telling a story worth paying attention to.
Binance’s move to expand its collateral options is a big deal. It’s a sign that traditional finance is being pulled into crypto’s orbit. But when that same week sees a token - MOVE - go under, it raises questions about the risks that come with that kind of expansion.
Defense or offense - one word.
—
For educational purposes only. Not financial advice.
📌 Crypto 101 · #68 · #CryptoEducation #CryptoSighted $MOVE
Movement Labs filed for Chapter 11 bankruptcy after months of $MOVE token turmoil. The numbers don’t lie - and they’re telling a story worth paying attention to.
Binance’s move to expand its collateral options is a big deal. It’s a sign that traditional finance is being pulled into crypto’s orbit. But when that same week sees a token - MOVE - go under, it raises questions about the risks that come with that kind of expansion.
Defense or offense - one word.
—
For educational purposes only. Not financial advice.
📌 Crypto 101 · #68 · #CryptoEducation #CryptoSighted $MOVE
Binance’s move to expand its collateral options is a big deal. It’s a sign that traditional finance is being pulled into crypto’s orbit. But when that same week sees a token - MOVE - go under, it raises questions about the risks that come with that kind of expansion.
Defense or offense - one word.
—
For educational purposes only. Not financial advice.
📌 Crypto 101 · #68 · #CryptoEducation #CryptoSighted $MOVE
116

·
--
** How to Prepare a Daily Binance Square Trading Plan? 📈💡Venice Token (VVVUSDT) is trending right now!
Rank: #68
** --- ### Step 1 – Extract the General Market View 🗺️ **What will you do?** While you’re sitting on Binance Square, find a clear answer to “What’s happening today?” - **Data check:** - right now **78 665.62 USDT** (‑0.461 % in 24 hours). - **754.85 USDT** (+2.154 %). - **1.217 USDT** (+14.595 %). - **Why is it important?** Entering a trade without seeing the market’s direction, volatility level, and liquidity (volume) is like traveling without a compass—you’ll get lost! **Practical tip:** On Binance Square’s “Market Overview” panel, take a look at the “24h Change” and “Volume” columns within a couple of seconds. --- ### Step 2 – Choose the Most Active Pair (Top Movers) 🚀 **What will you do?** Identify pairs with the highest % change and volume, because they offer “hot” opportunities. | Symbol | Price | % Change | Volume (USDT) | |--------|-------|----------|--------------| | | 1.217 | **+14.595 %** | 32 131 592 | | | 1.855 | **+13.943 %** | 5 539 334 | | | 754.85 | **+2.154 %** | 140 054 444 | | | 1.4208 | **+1.828 %** | 185 215 742 | **Why is it important?** Pairs with high movement and high volume mean the price is changing quickly and liquidity is abundant → lower entry/exit slippage, and higher profit potential. **Concrete example:** it increased by 14.6% today; with a “breakout” strategy, a buy signal could form if the 1.20 USDT resistance is broken. --- ### Step 3 – Identify Chart Patterns (Chart Patterns) T
** How to Prepare a Daily Binance Square Trading Plan? 📈💡
Venice Token (VVVUSDT) is trending right now!
Rank: #68
** --- ### Step 1 – Extract the General Market View 🗺️ **What will you do?** While you’re sitting on Binance Square, find a clear answer to “What’s happening today?” - **Data check:** - right now **78 665.62 USDT** (‑0.461 % in 24 hours). - **754.85 USDT** (+2.154 %). - **1.217 USDT** (+14.595 %). - **Why is it important?** Entering a trade without seeing the market’s direction, volatility level, and liquidity (volume) is like traveling without a compass—you’ll get lost! **Practical tip:** On Binance Square’s “Market Overview” panel, take a look at the “24h Change” and “Volume” columns within a couple of seconds. --- ### Step 2 – Choose the Most Active Pair (Top Movers) 🚀 **What will you do?** Identify pairs with the highest % change and volume, because they offer “hot” opportunities. | Symbol | Price | % Change | Volume (USDT) | |--------|-------|----------|--------------| | | 1.217 | **+14.595 %** | 32 131 592 | | | 1.855 | **+13.943 %** | 5 539 334 | | | 754.85 | **+2.154 %** | 140 054 444 | | | 1.4208 | **+1.828 %** | 185 215 742 | **Why is it important?** Pairs with high movement and high volume mean the price is changing quickly and liquidity is abundant → lower entry/exit slippage, and higher profit potential. **Concrete example:** it increased by 14.6% today; with a “breakout” strategy, a buy signal could form if the 1.20 USDT resistance is broken. --- ### Step 3 – Identify Chart Patterns (Chart Patterns) T
Rank: #68
** --- ### Step 1 – Extract the General Market View 🗺️ **What will you do?** While you’re sitting on Binance Square, find a clear answer to “What’s happening today?” - **Data check:** - right now **78 665.62 USDT** (‑0.461 % in 24 hours). - **754.85 USDT** (+2.154 %). - **1.217 USDT** (+14.595 %). - **Why is it important?** Entering a trade without seeing the market’s direction, volatility level, and liquidity (volume) is like traveling without a compass—you’ll get lost! **Practical tip:** On Binance Square’s “Market Overview” panel, take a look at the “24h Change” and “Volume” columns within a couple of seconds. --- ### Step 2 – Choose the Most Active Pair (Top Movers) 🚀 **What will you do?** Identify pairs with the highest % change and volume, because they offer “hot” opportunities. | Symbol | Price | % Change | Volume (USDT) | |--------|-------|----------|--------------| | | 1.217 | **+14.595 %** | 32 131 592 | | | 1.855 | **+13.943 %** | 5 539 334 | | | 754.85 | **+2.154 %** | 140 054 444 | | | 1.4208 | **+1.828 %** | 185 215 742 | **Why is it important?** Pairs with high movement and high volume mean the price is changing quickly and liquidity is abundant → lower entry/exit slippage, and higher profit potential. **Concrete example:** it increased by 14.6% today; with a “breakout” strategy, a buy signal could form if the 1.20 USDT resistance is broken. --- ### Step 3 – Identify Chart Patterns (Chart Patterns) T
144
·
--
Crypto Market UpdateLighter (LITUSDT) is trending right now!
Rank: #68
**CRISIS OF BITCOIN AT $78,000: WHAT SHOULD INVESTORS DO?** Yesterday, the Bitcoin price remained steady at the $78,554.76 level, but the 24-hour trading volume exceeded $34.4 billion. Such high volume may indicate that something is going wrong in the market. So, what’s happening? Personally, I think Bitcoin is "stuck" at this level. Everyone is waiting for it to reach $80,000, but I believe it may not be that easy. According to technical analysis, there is potential for it to drop to the $75,000 level. This could be a major source of concern for investors. Ethereum, meanwhile, stayed steady at the $2,490.38 level and stood out with a $13.7 billion trading volume. The price of ' is closely tied to Bitcoin’s price movements. However, if ' manages to break above the $2,500 level, it could be a positive signal for the market. As a day trader, I’m trying to keep my finger on the pulse of the market. I think investors are currently caught between two options: "buy" or "wait and see"? My personal view is that investors should monitor the market carefully. Do you believe ' will reach $80,000, or are you expecting a correction?
Crypto Market Update
Lighter (LITUSDT) is trending right now!
Rank: #68
**CRISIS OF BITCOIN AT $78,000: WHAT SHOULD INVESTORS DO?** Yesterday, the Bitcoin price remained steady at the $78,554.76 level, but the 24-hour trading volume exceeded $34.4 billion. Such high volume may indicate that something is going wrong in the market. So, what’s happening? Personally, I think Bitcoin is "stuck" at this level. Everyone is waiting for it to reach $80,000, but I believe it may not be that easy. According to technical analysis, there is potential for it to drop to the $75,000 level. This could be a major source of concern for investors. Ethereum, meanwhile, stayed steady at the $2,490.38 level and stood out with a $13.7 billion trading volume. The price of ' is closely tied to Bitcoin’s price movements. However, if ' manages to break above the $2,500 level, it could be a positive signal for the market. As a day trader, I’m trying to keep my finger on the pulse of the market. I think investors are currently caught between two options: "buy" or "wait and see"? My personal view is that investors should monitor the market carefully. Do you believe ' will reach $80,000, or are you expecting a correction?
Rank: #68
**CRISIS OF BITCOIN AT $78,000: WHAT SHOULD INVESTORS DO?** Yesterday, the Bitcoin price remained steady at the $78,554.76 level, but the 24-hour trading volume exceeded $34.4 billion. Such high volume may indicate that something is going wrong in the market. So, what’s happening? Personally, I think Bitcoin is "stuck" at this level. Everyone is waiting for it to reach $80,000, but I believe it may not be that easy. According to technical analysis, there is potential for it to drop to the $75,000 level. This could be a major source of concern for investors. Ethereum, meanwhile, stayed steady at the $2,490.38 level and stood out with a $13.7 billion trading volume. The price of ' is closely tied to Bitcoin’s price movements. However, if ' manages to break above the $2,500 level, it could be a positive signal for the market. As a day trader, I’m trying to keep my finger on the pulse of the market. I think investors are currently caught between two options: "buy" or "wait and see"? My personal view is that investors should monitor the market carefully. Do you believe ' will reach $80,000, or are you expecting a correction?
91
Log in to explore more content
Join global crypto users on Binance Square
⚡️ Get latest and useful information about crypto.
💬 Trusted by the world’s largest crypto exchange.
👍 Discover real insights from verified creators.
Email / Phone number
Trending Topics
1
#HotCPIDecemberHikePriced
16,092 views
514 Discussing
2
#AnthropicRejectsIPODelayValuationinQuestion
150,017 views
1,423 Discussing
3
#NvidiaInvestigatesAfterHuang’sAffairApology
404,231 views
2,897 Discussing
4
#CanNvidiaEarningsEaseMarketConcerns?
15,440 views
341 Discussing
5
#ADPWeeklyEstimateShowsUSPrivatePayrollsUp19750
4,403 views
145 Discussing
6
#US-IranTalksFuelStrongStockMarketRebound
66,584 views
516 Discussing
7
#BitcoinFiveWeeklyLosses
423,286 views
3,058 Discussing
8
#AIChipSlumpNasdaq
234,996 views
1,746 Discussing
9
#BitcoinSpotETFsPost$201MNetOutflowForThirdStraightDay
1,266 views
24 Discussing
10
#CryptoLiquidationsReach$1.16BIn24Hours
55,804 views
80 Discussing