
#14
14
14,461 views
178 Discussing
Hot
Latest

·
--
🏆 CRYPTO vs THE WORLD
$BTC #14 of all assets · needs +$101.13B to flip Broadcom
$ETH #68 of all assets · needs +$9.74B to flip Philip Morris
🍳 Crypto vs stocks, gold, everything. Not financial advice.
#CookingBNB #Crypto
🏆 CRYPTO vs THE WORLD
$BTC #14 of all assets · needs +$101.13B to flip Broadcom
$ETH #68 of all assets · needs +$9.74B to flip Philip Morris
🍳 Crypto vs stocks, gold, everything. Not financial advice.
#CookingBNB #Crypto
$BTC #14 of all assets · needs +$101.13B to flip Broadcom
$ETH #68 of all assets · needs +$9.74B to flip Philip Morris
🍳 Crypto vs stocks, gold, everything. Not financial advice.
#CookingBNB #Crypto

1
146

·
--
FF This one is kind of interesting. In the 15m timeframe, it rose 1.37%; volume directly hit 2.07x. The Z value is 3.90. The closing price even pressed along the upper edge of the previous ~20 of the 5m candles.
The key is OI: both the 15m and 1h nominal changes are rising—583K / 709K. But the number of contract lots barely moved. That feels very subtle—more like fresh money is coming in adding leverage to go long, rather than shorts covering and pushing.
The主动成交差 (active trade differential) is 15.5%; the buy/sell ratio is 1.37, clearly buy-leaning. The abnormal percentile is 80%. Within the whole pool, the nominal change ranks #14, and the depth has been confirmed.
For 60M over the past 24h, the traded value, together with this breakout, makes me first look at whether it can hold and stay above the upper edge. Whether to chase is another matter—just don’t get shaken out and washed out while it’s in a needle-like move.
FF This one is kind of interesting. In the 15m timeframe, it rose 1.37%; volume directly hit 2.07x. The Z value is 3.90. The closing price even pressed along the upper edge of the previous ~20 of the 5m candles.
The key is OI: both the 15m and 1h nominal changes are rising—583K / 709K. But the number of contract lots barely moved. That feels very subtle—more like fresh money is coming in adding leverage to go long, rather than shorts covering and pushing.
The主动成交差 (active trade differential) is 15.5%; the buy/sell ratio is 1.37, clearly buy-leaning. The abnormal percentile is 80%. Within the whole pool, the nominal change ranks #14, and the depth has been confirmed.
For 60M over the past 24h, the traded value, together with this breakout, makes me first look at whether it can hold and stay above the upper edge. Whether to chase is another matter—just don’t get shaken out and washed out while it’s in a needle-like move.
The key is OI: both the 15m and 1h nominal changes are rising—583K / 709K. But the number of contract lots barely moved. That feels very subtle—more like fresh money is coming in adding leverage to go long, rather than shorts covering and pushing.
The主动成交差 (active trade differential) is 15.5%; the buy/sell ratio is 1.37, clearly buy-leaning. The abnormal percentile is 80%. Within the whole pool, the nominal change ranks #14, and the depth has been confirmed.
For 60M over the past 24h, the traded value, together with this breakout, makes me first look at whether it can hold and stay above the upper edge. Whether to chase is another matter—just don’t get shaken out and washed out while it’s in a needle-like move.

·
--
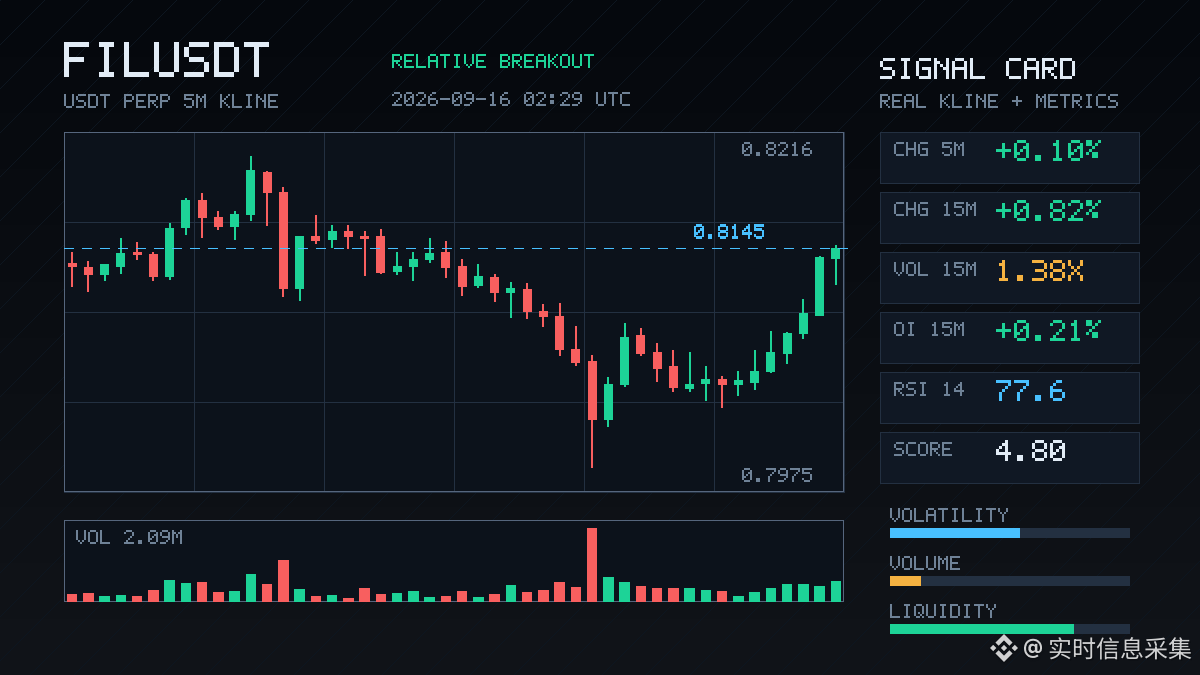
FIL This move is a bit interesting.
In the 15m timeframe, it’s up 0.82%, volume is 1.38x, and the volatility Z shot straight to 2.16. The price has just closed near the upper edge of the last ~20 five-minute candles, with passive vs. active execution spread down 31.2% and buy/sell ratio at 1.91—so on the order book it looks like someone is actively driving price upward.
More importantly, OI: 15m +0.21%, 1h +0.52%, notional change 484K / 709K. Price is rising and open interest is rising in sync—this is a textbook case of incremental long positions entering, not shorts covering to prop it up.
The notional change ranks #14 across the whole pool, at an unusual percentile of 74.4%—not extreme, but given the overall order flow with 24h turnover of 194M, this magnitude is solid enough.
Let’s see if it can hold above the upper edge of this range. If it holds, then we’ll have something to talk about.
FIL This move is a bit interesting.
In the 15m timeframe, it’s up 0.82%, volume is 1.38x, and the volatility Z shot straight to 2.16. The price has just closed near the upper edge of the last ~20 five-minute candles, with passive vs. active execution spread down 31.2% and buy/sell ratio at 1.91—so on the order book it looks like someone is actively driving price upward.
More importantly, OI: 15m +0.21%, 1h +0.52%, notional change 484K / 709K. Price is rising and open interest is rising in sync—this is a textbook case of incremental long positions entering, not shorts covering to prop it up.
The notional change ranks #14 across the whole pool, at an unusual percentile of 74.4%—not extreme, but given the overall order flow with 24h turnover of 194M, this magnitude is solid enough.
Let’s see if it can hold above the upper edge of this range. If it holds, then we’ll have something to talk about.
In the 15m timeframe, it’s up 0.82%, volume is 1.38x, and the volatility Z shot straight to 2.16. The price has just closed near the upper edge of the last ~20 five-minute candles, with passive vs. active execution spread down 31.2% and buy/sell ratio at 1.91—so on the order book it looks like someone is actively driving price upward.
More importantly, OI: 15m +0.21%, 1h +0.52%, notional change 484K / 709K. Price is rising and open interest is rising in sync—this is a textbook case of incremental long positions entering, not shorts covering to prop it up.
The notional change ranks #14 across the whole pool, at an unusual percentile of 74.4%—not extreme, but given the overall order flow with 24h turnover of 194M, this magnitude is solid enough.
Let’s see if it can hold above the upper edge of this range. If it holds, then we’ll have something to talk about.
6

·
--
$IDOL This sell-off is a bit “quiet.”
On the 15m timeframe, it’s down 1.13% with volume at 1.43x—not huge—but OI also declined. On the 1h contracts, it’s -2.66%, with notional reduced by 428K. Price is falling while OI is dropping—typical long de-leveraging: stop-losses trigger or longs actively shrink positions, not fresh short entries smashing the market.
The OI percentile is up to 94.4%—the whole pool is #14. It’s been continuing for several consecutive periods, and this depth confirmation is more convincing than any single candlestick. The buy/sell ratio is 1.06, and the active trades are still slightly buy-leaning (by 3.1%). That suggests the spot market isn’t panicking; it’s mainly the contracts unloading leverage.
We’re getting close to your historical extreme range. Over the past 24h there’s still 27.73M in volume, so liquidity hasn’t dried up, but structurally it looks more like deflating a bubble than a real breakdown.
Just watch and wait for when the longs fully offload—once they’ve unloaded cleanly, it’ll actually feel lighter.
$IDOL This sell-off is a bit “quiet.”
On the 15m timeframe, it’s down 1.13% with volume at 1.43x—not huge—but OI also declined. On the 1h contracts, it’s -2.66%, with notional reduced by 428K. Price is falling while OI is dropping—typical long de-leveraging: stop-losses trigger or longs actively shrink positions, not fresh short entries smashing the market.
The OI percentile is up to 94.4%—the whole pool is #14. It’s been continuing for several consecutive periods, and this depth confirmation is more convincing than any single candlestick. The buy/sell ratio is 1.06, and the active trades are still slightly buy-leaning (by 3.1%). That suggests the spot market isn’t panicking; it’s mainly the contracts unloading leverage.
We’re getting close to your historical extreme range. Over the past 24h there’s still 27.73M in volume, so liquidity hasn’t dried up, but structurally it looks more like deflating a bubble than a real breakdown.
Just watch and wait for when the longs fully offload—once they’ve unloaded cleanly, it’ll actually feel lighter.
On the 15m timeframe, it’s down 1.13% with volume at 1.43x—not huge—but OI also declined. On the 1h contracts, it’s -2.66%, with notional reduced by 428K. Price is falling while OI is dropping—typical long de-leveraging: stop-losses trigger or longs actively shrink positions, not fresh short entries smashing the market.
The OI percentile is up to 94.4%—the whole pool is #14. It’s been continuing for several consecutive periods, and this depth confirmation is more convincing than any single candlestick. The buy/sell ratio is 1.06, and the active trades are still slightly buy-leaning (by 3.1%). That suggests the spot market isn’t panicking; it’s mainly the contracts unloading leverage.
We’re getting close to your historical extreme range. Over the past 24h there’s still 27.73M in volume, so liquidity hasn’t dried up, but structurally it looks more like deflating a bubble than a real breakdown.
Just watch and wait for when the longs fully offload—once they’ve unloaded cleanly, it’ll actually feel lighter.
8
·
--
$MARSCOIN This 15-minute drop cut 4.38%. Volume directly surged to 3.63x, and volatility jumped to 4.42—this doesn’t look like normal position rotation.
What’s interesting is the OI: over 15 minutes, OI is -0.63%—nominally -876K. Over the next hour it’s also net down by -833K. Price is falling while OI is also decreasing; that’s the typical long-side de-leveraging, not fresh short entries. In plain terms, stop-loss orders and forced deleveraging are being hammered out—positions are shrinking rather than being added.
In the tape, active trades are down 16.6%: the buy/sell ratio is 0.72, with sell pressure clearly stronger. By the close, it has broken below the lower bound of the last ~20 5-minute bars. Once it breaks at this level, the sentiment can easily self-reinforce.
At the abnormal percentile of 99.2%, across the whole pool #3, nominal change #14, with 24h turnover of 73.25M. Multiple consecutive cycles with abnormal OI continued, and the order-book depth confirmed it too—not just a needle-like wick, but real positioning retreat.
With this kind of structure, I generally won’t rush to jump in. Until de-leveraging is fully over, any rebound is just an opportunity to escape. Wait for OI to stop falling and for active buy orders to return, then it’s not too late to reassess.
$MARSCOIN This 15-minute drop cut 4.38%. Volume directly surged to 3.63x, and volatility jumped to 4.42—this doesn’t look like normal position rotation.
What’s interesting is the OI: over 15 minutes, OI is -0.63%—nominally -876K. Over the next hour it’s also net down by -833K. Price is falling while OI is also decreasing; that’s the typical long-side de-leveraging, not fresh short entries. In plain terms, stop-loss orders and forced deleveraging are being hammered out—positions are shrinking rather than being added.
In the tape, active trades are down 16.6%: the buy/sell ratio is 0.72, with sell pressure clearly stronger. By the close, it has broken below the lower bound of the last ~20 5-minute bars. Once it breaks at this level, the sentiment can easily self-reinforce.
At the abnormal percentile of 99.2%, across the whole pool #3, nominal change #14, with 24h turnover of 73.25M. Multiple consecutive cycles with abnormal OI continued, and the order-book depth confirmed it too—not just a needle-like wick, but real positioning retreat.
With this kind of structure, I generally won’t rush to jump in. Until de-leveraging is fully over, any rebound is just an opportunity to escape. Wait for OI to stop falling and for active buy orders to return, then it’s not too late to reassess.
What’s interesting is the OI: over 15 minutes, OI is -0.63%—nominally -876K. Over the next hour it’s also net down by -833K. Price is falling while OI is also decreasing; that’s the typical long-side de-leveraging, not fresh short entries. In plain terms, stop-loss orders and forced deleveraging are being hammered out—positions are shrinking rather than being added.
In the tape, active trades are down 16.6%: the buy/sell ratio is 0.72, with sell pressure clearly stronger. By the close, it has broken below the lower bound of the last ~20 5-minute bars. Once it breaks at this level, the sentiment can easily self-reinforce.
At the abnormal percentile of 99.2%, across the whole pool #3, nominal change #14, with 24h turnover of 73.25M. Multiple consecutive cycles with abnormal OI continued, and the order-book depth confirmed it too—not just a needle-like wick, but real positioning retreat.
With this kind of structure, I generally won’t rush to jump in. Until de-leveraging is fully over, any rebound is just an opportunity to escape. Wait for OI to stop falling and for active buy orders to return, then it’s not too late to reassess.
219

·
--
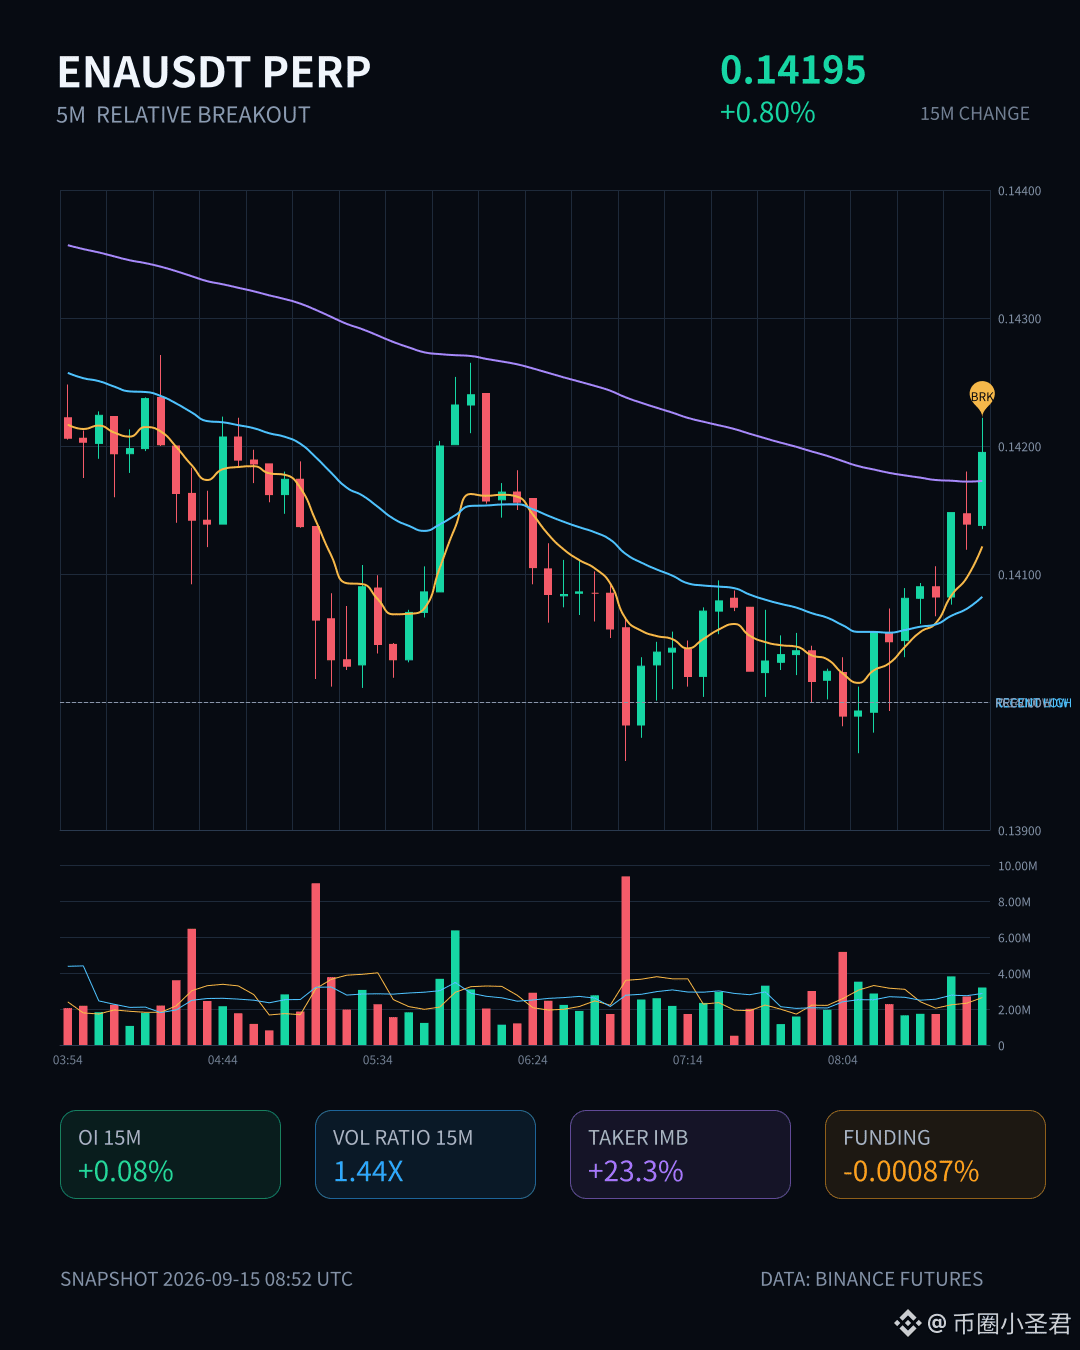
EN A little movement here.
Over 15m, it rose 0.8%, volume was 1.44x, and the price has just broken above the upper band of the past ~20 5m candles. It’s not that kind of violent pump, but the structure is quite clean.
The key is the OI (open interest). On 15m +0.08%, on 1h +0.31%. The total nominal change adds up to more than 1.7 million U. Price is up, and OI is rising too, indicating new leveraged longs are entering—not the “shorts covering” play. The abnormal percentile is 84.5%, ranking #14 across the whole pool. Nominal change is #8, so it’s in a relatively front position today.
The active trade difference is 23.3%, buy/sell ratio is 1.61, and the buying side is somewhat tilted. 24h trading volume is 180 million, and the depth is sufficient.
Whether this kind of breakout can continue depends on whether OI holds up during the pullback. If the price stabilizes and OI doesn’t collapse, this batch of new longs is a valid position build. If OI rapidly contracts, just treat it as if you didn’t see it.
EN A little movement here.
Over 15m, it rose 0.8%, volume was 1.44x, and the price has just broken above the upper band of the past ~20 5m candles. It’s not that kind of violent pump, but the structure is quite clean.
The key is the OI (open interest). On 15m +0.08%, on 1h +0.31%. The total nominal change adds up to more than 1.7 million U. Price is up, and OI is rising too, indicating new leveraged longs are entering—not the “shorts covering” play. The abnormal percentile is 84.5%, ranking #14 across the whole pool. Nominal change is #8, so it’s in a relatively front position today.
The active trade difference is 23.3%, buy/sell ratio is 1.61, and the buying side is somewhat tilted. 24h trading volume is 180 million, and the depth is sufficient.
Whether this kind of breakout can continue depends on whether OI holds up during the pullback. If the price stabilizes and OI doesn’t collapse, this batch of new longs is a valid position build. If OI rapidly contracts, just treat it as if you didn’t see it.
Over 15m, it rose 0.8%, volume was 1.44x, and the price has just broken above the upper band of the past ~20 5m candles. It’s not that kind of violent pump, but the structure is quite clean.
The key is the OI (open interest). On 15m +0.08%, on 1h +0.31%. The total nominal change adds up to more than 1.7 million U. Price is up, and OI is rising too, indicating new leveraged longs are entering—not the “shorts covering” play. The abnormal percentile is 84.5%, ranking #14 across the whole pool. Nominal change is #8, so it’s in a relatively front position today.
The active trade difference is 23.3%, buy/sell ratio is 1.61, and the buying side is somewhat tilted. 24h trading volume is 180 million, and the depth is sufficient.
Whether this kind of breakout can continue depends on whether OI holds up during the pullback. If the price stabilizes and OI doesn’t collapse, this batch of new longs is a valid position build. If OI rapidly contracts, just treat it as if you didn’t see it.
13

·
--
$MTL This round on the 15m chart pulled 2.46%. Volume could directly reach 2.06x. OI was also lifted by 3%, and nominally added 180K. This doesn’t look like the kind of imaginary pump from short-covering; it’s more like fresh leveraged long positions are being actively built. The percentile is 92.1%—the whole pool ranked at #14, and depth confirmation also passed, at least indicating it’s not a thin pool hyping itself. The buy/sell ratio is 1.00; active imbalance is only 0.1%. The order book is relatively balanced for now—I don’t see obvious one-sided sweeping. 24h turnover is 99.65M, and liquidity is sufficient. First, let’s see whether this long leverage can be digested without volume contracting. If OI continues to build while price goes sideways, then be careful.
$MTL This round on the 15m chart pulled 2.46%. Volume could directly reach 2.06x. OI was also lifted by 3%, and nominally added 180K. This doesn’t look like the kind of imaginary pump from short-covering; it’s more like fresh leveraged long positions are being actively built. The percentile is 92.1%—the whole pool ranked at #14, and depth confirmation also passed, at least indicating it’s not a thin pool hyping itself. The buy/sell ratio is 1.00; active imbalance is only 0.1%. The order book is relatively balanced for now—I don’t see obvious one-sided sweeping. 24h turnover is 99.65M, and liquidity is sufficient. First, let’s see whether this long leverage can be digested without volume contracting. If OI continues to build while price goes sideways, then be careful.
45
·
--
$MET This one hits a bit hard.
In 15m, price directly breaks below the lower band of the last 20 5m candles. Volume surges to 4.41x, aggressive buy-vs-sell difference is -26.3%, and the buy/sell ratio is 0.58— the selling pressure was hammered down, not just scare-ordering.
But what’s interesting is that OI is falling in sync: 15m -0.61%, 1h -0.90%, with a nominal decrease of 160k U. Price drops while open interest also drops—this looks more like longs de-leveraging: stop-losses and position reductions happen together, rather than shorts initiating fresh selling pressure.
The anomalous percentile is 84.3%. It ranks #14 across the whole pool, and it hasn’t recovered for several consecutive cycles.
The 24h trading volume is only 12.4M, the pool isn’t deep. When volume like this comes in, price can easily be pushed around. Right now it seems the longs are passively getting beaten, not voluntarily surrendering. What happens next depends on whether anyone is willing to take it at this level. I’ll watch for now—no rush to jump in.
$MET This one hits a bit hard.
In 15m, price directly breaks below the lower band of the last 20 5m candles. Volume surges to 4.41x, aggressive buy-vs-sell difference is -26.3%, and the buy/sell ratio is 0.58— the selling pressure was hammered down, not just scare-ordering.
But what’s interesting is that OI is falling in sync: 15m -0.61%, 1h -0.90%, with a nominal decrease of 160k U. Price drops while open interest also drops—this looks more like longs de-leveraging: stop-losses and position reductions happen together, rather than shorts initiating fresh selling pressure.
The anomalous percentile is 84.3%. It ranks #14 across the whole pool, and it hasn’t recovered for several consecutive cycles.
The 24h trading volume is only 12.4M, the pool isn’t deep. When volume like this comes in, price can easily be pushed around. Right now it seems the longs are passively getting beaten, not voluntarily surrendering. What happens next depends on whether anyone is willing to take it at this level. I’ll watch for now—no rush to jump in.
In 15m, price directly breaks below the lower band of the last 20 5m candles. Volume surges to 4.41x, aggressive buy-vs-sell difference is -26.3%, and the buy/sell ratio is 0.58— the selling pressure was hammered down, not just scare-ordering.
But what’s interesting is that OI is falling in sync: 15m -0.61%, 1h -0.90%, with a nominal decrease of 160k U. Price drops while open interest also drops—this looks more like longs de-leveraging: stop-losses and position reductions happen together, rather than shorts initiating fresh selling pressure.
The anomalous percentile is 84.3%. It ranks #14 across the whole pool, and it hasn’t recovered for several consecutive cycles.
The 24h trading volume is only 12.4M, the pool isn’t deep. When volume like this comes in, price can easily be pushed around. Right now it seems the longs are passively getting beaten, not voluntarily surrendering. What happens next depends on whether anyone is willing to take it at this level. I’ll watch for now—no rush to jump in.
1
·
--
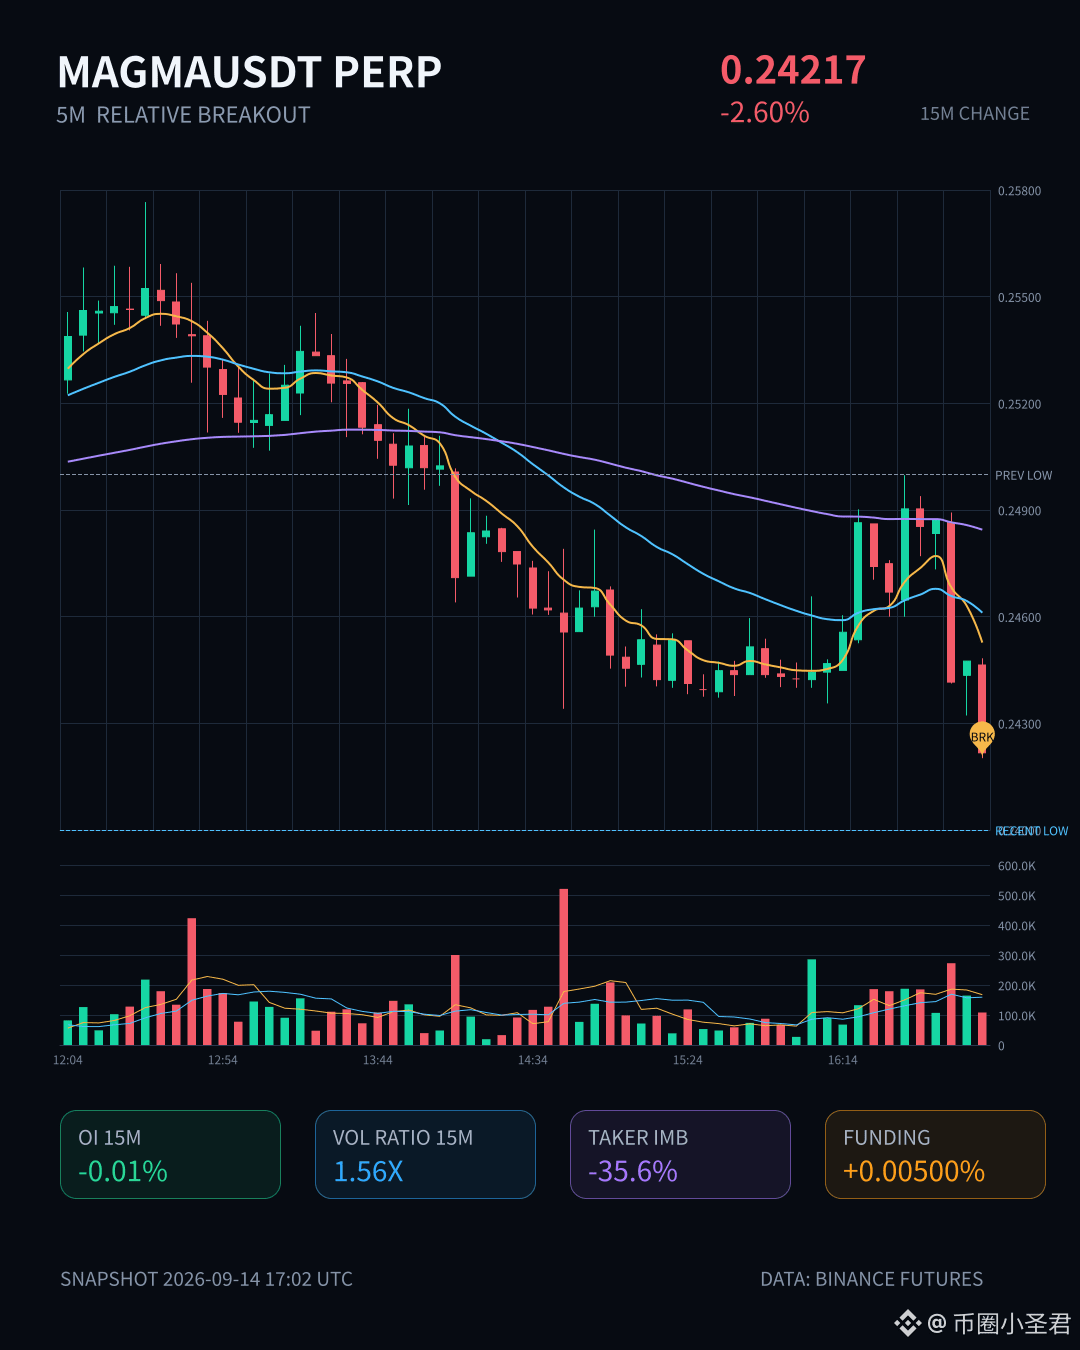
$MAGMA This 15m move is a bit brutal: -2.6%, volume is increased to 1.56x. Z hits 4.43, and it directly breaks through the lower edge of the past nearly 20 5m candles. Active trade imbalance is -35.6%, buy/sell ratio is 0.48, and sell pressure is clearly in the lead.
But what’s interesting is OI—on 15m it basically doesn’t move, only -0.01%, and on 1h it slightly increases by 0.14%, yet the notional value for both is shrinking. This kind of combination—price falling while OI declines—looks more like longs deleveraging / getting stopped out being swept, rather than new shorts aggressively piling in. The OI anomaly percentile is 94%, ranking #14 in the whole pool; the position really is extreme.
In the last 24h, turnover is 19.52M, and the depth is sufficient. Now we just need to see whether this level can hold and stop the move. If it continues to grind lower on shrinking volume, there may still be room downward. If OI keeps dropping and price starts to move sideways, that would be a signal that the bottoming/washout phase is nearing its end. For now, we’ll observe.
$MAGMA This 15m move is a bit brutal: -2.6%, volume is increased to 1.56x. Z hits 4.43, and it directly breaks through the lower edge of the past nearly 20 5m candles. Active trade imbalance is -35.6%, buy/sell ratio is 0.48, and sell pressure is clearly in the lead.
But what’s interesting is OI—on 15m it basically doesn’t move, only -0.01%, and on 1h it slightly increases by 0.14%, yet the notional value for both is shrinking. This kind of combination—price falling while OI declines—looks more like longs deleveraging / getting stopped out being swept, rather than new shorts aggressively piling in. The OI anomaly percentile is 94%, ranking #14 in the whole pool; the position really is extreme.
In the last 24h, turnover is 19.52M, and the depth is sufficient. Now we just need to see whether this level can hold and stop the move. If it continues to grind lower on shrinking volume, there may still be room downward. If OI keeps dropping and price starts to move sideways, that would be a signal that the bottoming/washout phase is nearing its end. For now, we’ll observe.
But what’s interesting is OI—on 15m it basically doesn’t move, only -0.01%, and on 1h it slightly increases by 0.14%, yet the notional value for both is shrinking. This kind of combination—price falling while OI declines—looks more like longs deleveraging / getting stopped out being swept, rather than new shorts aggressively piling in. The OI anomaly percentile is 94%, ranking #14 in the whole pool; the position really is extreme.
In the last 24h, turnover is 19.52M, and the depth is sufficient. Now we just need to see whether this level can hold and stop the move. If it continues to grind lower on shrinking volume, there may still be room downward. If OI keeps dropping and price starts to move sideways, that would be a signal that the bottoming/washout phase is nearing its end. For now, we’ll observe.
6
·
--
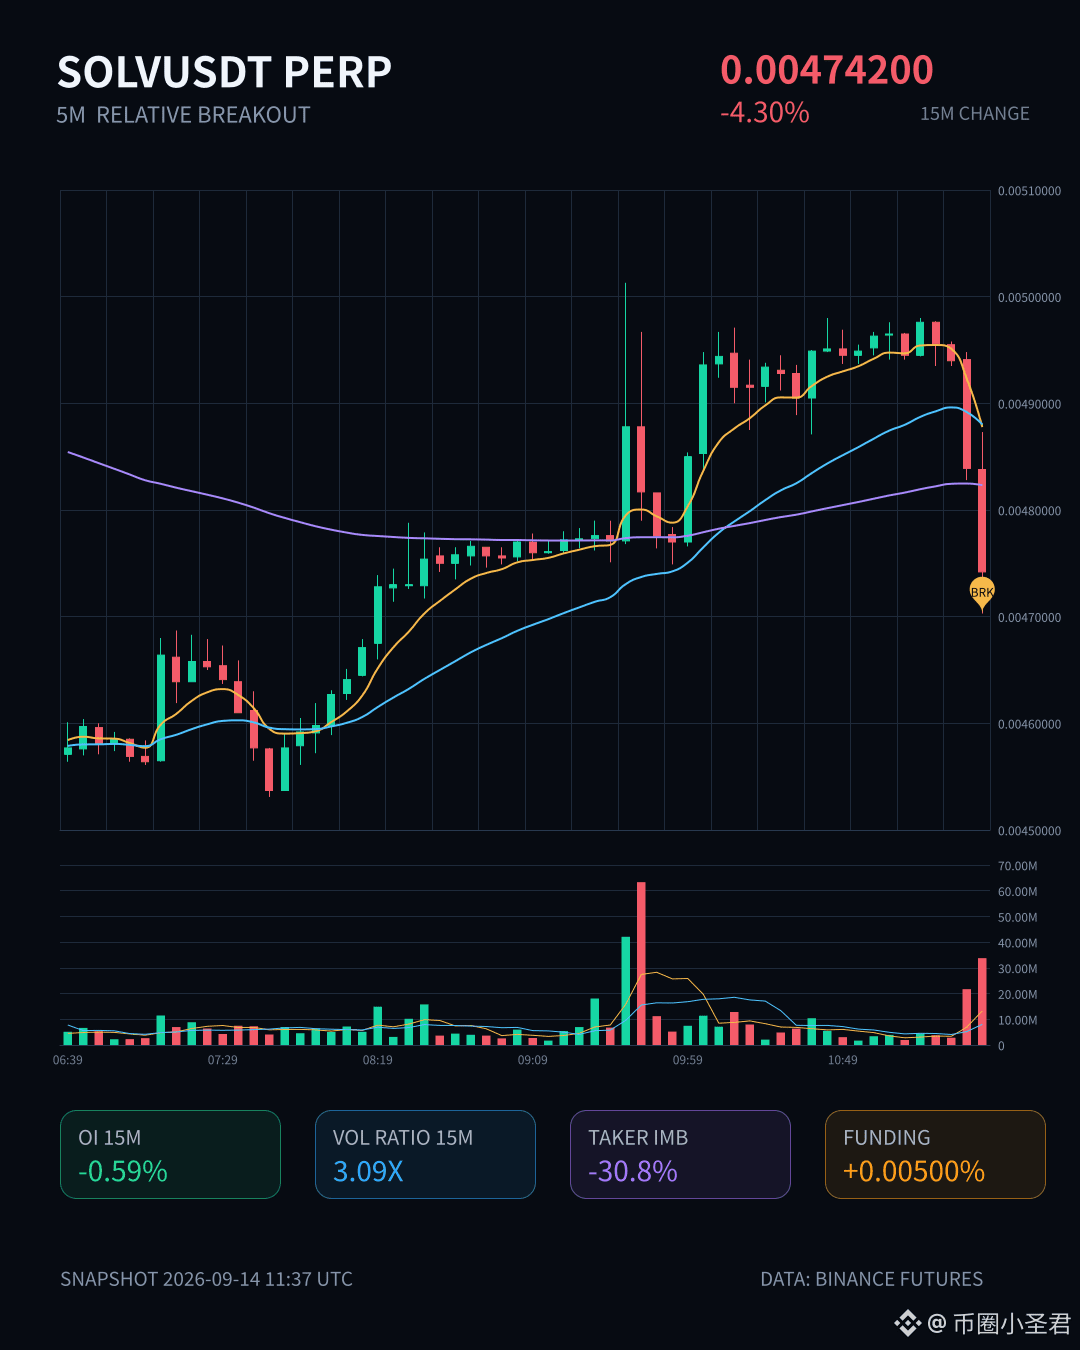
$SOLV This drop came pretty decisively—15m directly -4.3%. The trading volume hit about 3x the usual level, breaking below the lower bound of the past 20 5m bars. Active sell volume was down -30.8%, the buy/sell ratio is 0.53, and the sell pressure was genuinely what drove the dump.
But interestingly, OI didn’t rise—it actually fell: 15m -0.59%, 1h -0.48%. Nominally it decreased by 170K+111K. This doesn’t look like new short positions opening; it looks more like longs deleveraging, with stop-losses getting triggered passively—more like a chain of toppled dominoes than someone actively adding to shorts.
OI’s percentile is at 93.5%, the whole pool is #14, and the funding rate is still in a high percentile recently, suggesting longs were truly squeezed earlier. In this kind of structure, pullbacks often come with the tail end of passive liquidations. After the sharp selloff, don’t rush to buy the dip—wait for OI to stabilize and the aggressive sell pressure to dull, then reassess.
The 24h trading value is only 16.49M, depth isn’t that thick, and slippage is likely to be amplified—don’t go all-in betting on direction.
$SOLV This drop came pretty decisively—15m directly -4.3%. The trading volume hit about 3x the usual level, breaking below the lower bound of the past 20 5m bars. Active sell volume was down -30.8%, the buy/sell ratio is 0.53, and the sell pressure was genuinely what drove the dump.
But interestingly, OI didn’t rise—it actually fell: 15m -0.59%, 1h -0.48%. Nominally it decreased by 170K+111K. This doesn’t look like new short positions opening; it looks more like longs deleveraging, with stop-losses getting triggered passively—more like a chain of toppled dominoes than someone actively adding to shorts.
OI’s percentile is at 93.5%, the whole pool is #14, and the funding rate is still in a high percentile recently, suggesting longs were truly squeezed earlier. In this kind of structure, pullbacks often come with the tail end of passive liquidations. After the sharp selloff, don’t rush to buy the dip—wait for OI to stabilize and the aggressive sell pressure to dull, then reassess.
The 24h trading value is only 16.49M, depth isn’t that thick, and slippage is likely to be amplified—don’t go all-in betting on direction.
But interestingly, OI didn’t rise—it actually fell: 15m -0.59%, 1h -0.48%. Nominally it decreased by 170K+111K. This doesn’t look like new short positions opening; it looks more like longs deleveraging, with stop-losses getting triggered passively—more like a chain of toppled dominoes than someone actively adding to shorts.
OI’s percentile is at 93.5%, the whole pool is #14, and the funding rate is still in a high percentile recently, suggesting longs were truly squeezed earlier. In this kind of structure, pullbacks often come with the tail end of passive liquidations. After the sharp selloff, don’t rush to buy the dip—wait for OI to stabilize and the aggressive sell pressure to dull, then reassess.
The 24h trading value is only 16.49M, depth isn’t that thick, and slippage is likely to be amplified—don’t go all-in betting on direction.
48
·
--
$1000PEPE This 15m move is kind of interesting.
Volume is up 3.9x, but the price is only down 0.62%. The close also broke below the lower edge of nearly 20 prior 5m bars—this doesn’t look like a straight-down dump. It feels more like someone slowly unloading while staying around the range boundary.
OI on both the 15m and 1h is falling. Nominal change is ranked #14 for the whole pool, with an extreme percentile of 85.7%. Price is down while OI is down—this is a classic deleveraging structure. It’s not new shorts getting in; it’s longs withdrawing while stop-losses are being triggered.
Aggressive trade volume difference is -4.3%, buy/sell ratio is 0.92. Selling pressure isn’t especially fierce, but there also isn’t much demand to absorb it.
In the past 24h there’s still 166M in volume. The pool isn’t short of liquidity—the missing piece is direction. After it breaks below the lower edge, if OI keeps shrinking, chances are it’ll just grind. If volume expands further and OI turns positive, then it’s worth paying attention.
At this position, chasing shorts isn’t very good on risk/reward, and the dip-buy signals still aren’t there.
$1000PEPE This 15m move is kind of interesting.
Volume is up 3.9x, but the price is only down 0.62%. The close also broke below the lower edge of nearly 20 prior 5m bars—this doesn’t look like a straight-down dump. It feels more like someone slowly unloading while staying around the range boundary.
OI on both the 15m and 1h is falling. Nominal change is ranked #14 for the whole pool, with an extreme percentile of 85.7%. Price is down while OI is down—this is a classic deleveraging structure. It’s not new shorts getting in; it’s longs withdrawing while stop-losses are being triggered.
Aggressive trade volume difference is -4.3%, buy/sell ratio is 0.92. Selling pressure isn’t especially fierce, but there also isn’t much demand to absorb it.
In the past 24h there’s still 166M in volume. The pool isn’t short of liquidity—the missing piece is direction. After it breaks below the lower edge, if OI keeps shrinking, chances are it’ll just grind. If volume expands further and OI turns positive, then it’s worth paying attention.
At this position, chasing shorts isn’t very good on risk/reward, and the dip-buy signals still aren’t there.
Volume is up 3.9x, but the price is only down 0.62%. The close also broke below the lower edge of nearly 20 prior 5m bars—this doesn’t look like a straight-down dump. It feels more like someone slowly unloading while staying around the range boundary.
OI on both the 15m and 1h is falling. Nominal change is ranked #14 for the whole pool, with an extreme percentile of 85.7%. Price is down while OI is down—this is a classic deleveraging structure. It’s not new shorts getting in; it’s longs withdrawing while stop-losses are being triggered.
Aggressive trade volume difference is -4.3%, buy/sell ratio is 0.92. Selling pressure isn’t especially fierce, but there also isn’t much demand to absorb it.
In the past 24h there’s still 166M in volume. The pool isn’t short of liquidity—the missing piece is direction. After it breaks below the lower edge, if OI keeps shrinking, chances are it’ll just grind. If volume expands further and OI turns positive, then it’s worth paying attention.
At this position, chasing shorts isn’t very good on risk/reward, and the dip-buy signals still aren’t there.
10
·
--
API3 here is a bit interesting: the price broke below 20, with the 5m range hugging the lower edge; the 15m candle drops straight down by 1.6%. Volume is 2.23x, and volatility is Z 3.01. This isn’t a slow bleed—it’s a break with volume.
But look at OI: 15m -0.12%, 1h -1.45%. Nominally, it’s down by almost 100k U. Price falls while OI declines—typical deleveraging, not new shorts entering to smash the market. Active trading volume is worse by -20.3%, and the buy/sell ratio is 0.66. Sell pressure is there, but it feels more like longs are liquidating and triggering their own stop-losses.
The funding rate is still in the high percentile recently, and the OI percentile is an abnormal 88.5%, across the whole pool #14. This structure has been seen before: when longs get too crowded, they first kill a round of leverage, and afterwards it’s easier to see a rebound. I’m not calling for “buy”; I’m just reminding you not to cut positions randomly in panic. $API3
API3 here is a bit interesting: the price broke below 20, with the 5m range hugging the lower edge; the 15m candle drops straight down by 1.6%. Volume is 2.23x, and volatility is Z 3.01. This isn’t a slow bleed—it’s a break with volume.
But look at OI: 15m -0.12%, 1h -1.45%. Nominally, it’s down by almost 100k U. Price falls while OI declines—typical deleveraging, not new shorts entering to smash the market. Active trading volume is worse by -20.3%, and the buy/sell ratio is 0.66. Sell pressure is there, but it feels more like longs are liquidating and triggering their own stop-losses.
The funding rate is still in the high percentile recently, and the OI percentile is an abnormal 88.5%, across the whole pool #14. This structure has been seen before: when longs get too crowded, they first kill a round of leverage, and afterwards it’s easier to see a rebound. I’m not calling for “buy”; I’m just reminding you not to cut positions randomly in panic. $API3
But look at OI: 15m -0.12%, 1h -1.45%. Nominally, it’s down by almost 100k U. Price falls while OI declines—typical deleveraging, not new shorts entering to smash the market. Active trading volume is worse by -20.3%, and the buy/sell ratio is 0.66. Sell pressure is there, but it feels more like longs are liquidating and triggering their own stop-losses.
The funding rate is still in the high percentile recently, and the OI percentile is an abnormal 88.5%, across the whole pool #14. This structure has been seen before: when longs get too crowded, they first kill a round of leverage, and afterwards it’s easier to see a rebound. I’m not calling for “buy”; I’m just reminding you not to cut positions randomly in panic. $API3
·
--
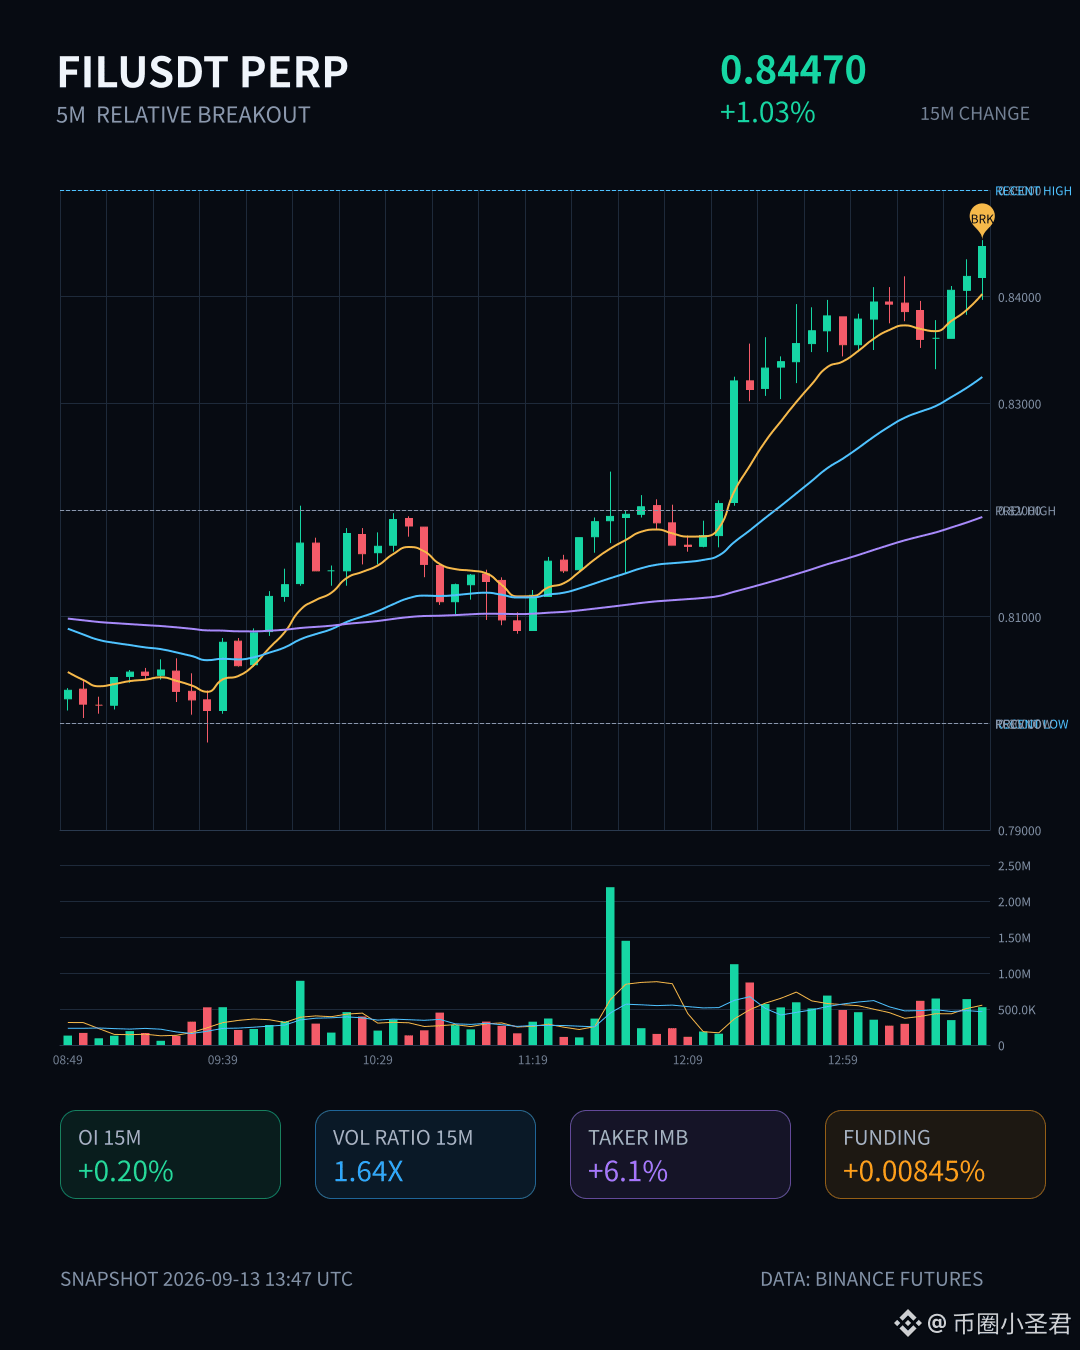
$FIL This wave has a little something.
15m: volume expands 1.64x. It directly breaks above the upper edge of nearly 20 of the 5m bars. The aggressive buy/sell ratio is 1.13,成交差 (trade discrepancy) is +6.1%. This isn’t a fake breakout propped up by resting orders—it’s genuinely being swept by real buyers.
More importantly: OI. 15m +0.20%, 1h +0.99%. Notional changes add up to $870k going upward. The anomaly percentile reaches 98%, and the position is ranked #14 across the whole pool. Price is rising and open interest is rising in sync—this is a structure of new leveraged long entries, not the kind of market where shorts cover and it falls apart with a push.
Also, this isn’t a one-cycle spike. It’s been continuing across several consecutive cycles. The 24h trading value of 30.84M also counts as having been released.
For a coin like FIL, at this kind of position it was already not far from its historical extreme zone. Now there’s deeper confirmation and volume/price alignment all in place. Whether it can actually develop into a trend is another question—but at least the signal quality is solid enough to keep a close watch.
$FIL This wave has a little something.
15m: volume expands 1.64x. It directly breaks above the upper edge of nearly 20 of the 5m bars. The aggressive buy/sell ratio is 1.13,成交差 (trade discrepancy) is +6.1%. This isn’t a fake breakout propped up by resting orders—it’s genuinely being swept by real buyers.
More importantly: OI. 15m +0.20%, 1h +0.99%. Notional changes add up to $870k going upward. The anomaly percentile reaches 98%, and the position is ranked #14 across the whole pool. Price is rising and open interest is rising in sync—this is a structure of new leveraged long entries, not the kind of market where shorts cover and it falls apart with a push.
Also, this isn’t a one-cycle spike. It’s been continuing across several consecutive cycles. The 24h trading value of 30.84M also counts as having been released.
For a coin like FIL, at this kind of position it was already not far from its historical extreme zone. Now there’s deeper confirmation and volume/price alignment all in place. Whether it can actually develop into a trend is another question—but at least the signal quality is solid enough to keep a close watch.
15m: volume expands 1.64x. It directly breaks above the upper edge of nearly 20 of the 5m bars. The aggressive buy/sell ratio is 1.13,成交差 (trade discrepancy) is +6.1%. This isn’t a fake breakout propped up by resting orders—it’s genuinely being swept by real buyers.
More importantly: OI. 15m +0.20%, 1h +0.99%. Notional changes add up to $870k going upward. The anomaly percentile reaches 98%, and the position is ranked #14 across the whole pool. Price is rising and open interest is rising in sync—this is a structure of new leveraged long entries, not the kind of market where shorts cover and it falls apart with a push.
Also, this isn’t a one-cycle spike. It’s been continuing across several consecutive cycles. The 24h trading value of 30.84M also counts as having been released.
For a coin like FIL, at this kind of position it was already not far from its historical extreme zone. Now there’s deeper confirmation and volume/price alignment all in place. Whether it can actually develop into a trend is another question—but at least the signal quality is solid enough to keep a close watch.
1
208
·
--
$STEEM This drop isn’t too vicious, but it turns out someone has quietly been running.
On the 15m timeframe, it’s down 2.77% with volume at only 0.79x. The chart looks calm and orderly, but what’s really interesting is the derivatives side—OI fell 6.72% over the past hour, and on 15m it’s -3.18%. Nominally, that’s a reduction of nearly 600k USDT. The price is down while OI is also down; this isn’t a typical case of fresh shorts entering to smash the market. Instead, the longs themselves couldn’t hold on—reducing positions and getting swept out by stop-losses.
This kind of move is actually more worth paying attention to than a sudden volume-driven dump, because it’s leverage draining one-way, not longs vs shorts actively rotating.
The funding rate is still in the higher percentile recently, which means the leveraged longs who crowded in here were already quite overextended. Now they’re just starting to unwind. Active trading is down 0.9%, buy/sell ratio is 1.02. The spot side is barely panicking—this is purely de-leveraging on the derivatives side.
The OI percentile is abnormally high at 92.3%, placing it at #14 across the whole pool. Recently, I’ve seen this kind of structure quite a few times—the price grinds along the boundary of the range while funding is high, and usually it hasn’t bottomed out yet.
Don’t rush to catch it. First, watch when OI actually stops falling.
$STEEM This drop isn’t too vicious, but it turns out someone has quietly been running.
On the 15m timeframe, it’s down 2.77% with volume at only 0.79x. The chart looks calm and orderly, but what’s really interesting is the derivatives side—OI fell 6.72% over the past hour, and on 15m it’s -3.18%. Nominally, that’s a reduction of nearly 600k USDT. The price is down while OI is also down; this isn’t a typical case of fresh shorts entering to smash the market. Instead, the longs themselves couldn’t hold on—reducing positions and getting swept out by stop-losses.
This kind of move is actually more worth paying attention to than a sudden volume-driven dump, because it’s leverage draining one-way, not longs vs shorts actively rotating.
The funding rate is still in the higher percentile recently, which means the leveraged longs who crowded in here were already quite overextended. Now they’re just starting to unwind. Active trading is down 0.9%, buy/sell ratio is 1.02. The spot side is barely panicking—this is purely de-leveraging on the derivatives side.
The OI percentile is abnormally high at 92.3%, placing it at #14 across the whole pool. Recently, I’ve seen this kind of structure quite a few times—the price grinds along the boundary of the range while funding is high, and usually it hasn’t bottomed out yet.
Don’t rush to catch it. First, watch when OI actually stops falling.
On the 15m timeframe, it’s down 2.77% with volume at only 0.79x. The chart looks calm and orderly, but what’s really interesting is the derivatives side—OI fell 6.72% over the past hour, and on 15m it’s -3.18%. Nominally, that’s a reduction of nearly 600k USDT. The price is down while OI is also down; this isn’t a typical case of fresh shorts entering to smash the market. Instead, the longs themselves couldn’t hold on—reducing positions and getting swept out by stop-losses.
This kind of move is actually more worth paying attention to than a sudden volume-driven dump, because it’s leverage draining one-way, not longs vs shorts actively rotating.
The funding rate is still in the higher percentile recently, which means the leveraged longs who crowded in here were already quite overextended. Now they’re just starting to unwind. Active trading is down 0.9%, buy/sell ratio is 1.02. The spot side is barely panicking—this is purely de-leveraging on the derivatives side.
The OI percentile is abnormally high at 92.3%, placing it at #14 across the whole pool. Recently, I’ve seen this kind of structure quite a few times—the price grinds along the boundary of the range while funding is high, and usually it hasn’t bottomed out yet.
Don’t rush to catch it. First, watch when OI actually stops falling.
12
·
--
🏆 CRYPTO vs THE WORLD
$BTC #14 of all assets · needs +$100.91B to flip Meta Platforms (Facebook)
$ETH #66 of all assets · needs +$1.10B to flip Home Depot
🍳 Crypto vs stocks, gold, everything. Not financial advice.
#CookingBNB #Crypto
🏆 CRYPTO vs THE WORLD
$BTC #14 of all assets · needs +$100.91B to flip Meta Platforms (Facebook)
$ETH #66 of all assets · needs +$1.10B to flip Home Depot
🍳 Crypto vs stocks, gold, everything. Not financial advice.
#CookingBNB #Crypto
$BTC #14 of all assets · needs +$100.91B to flip Meta Platforms (Facebook)
$ETH #66 of all assets · needs +$1.10B to flip Home Depot
🍳 Crypto vs stocks, gold, everything. Not financial advice.
#CookingBNB #Crypto

79
·
--
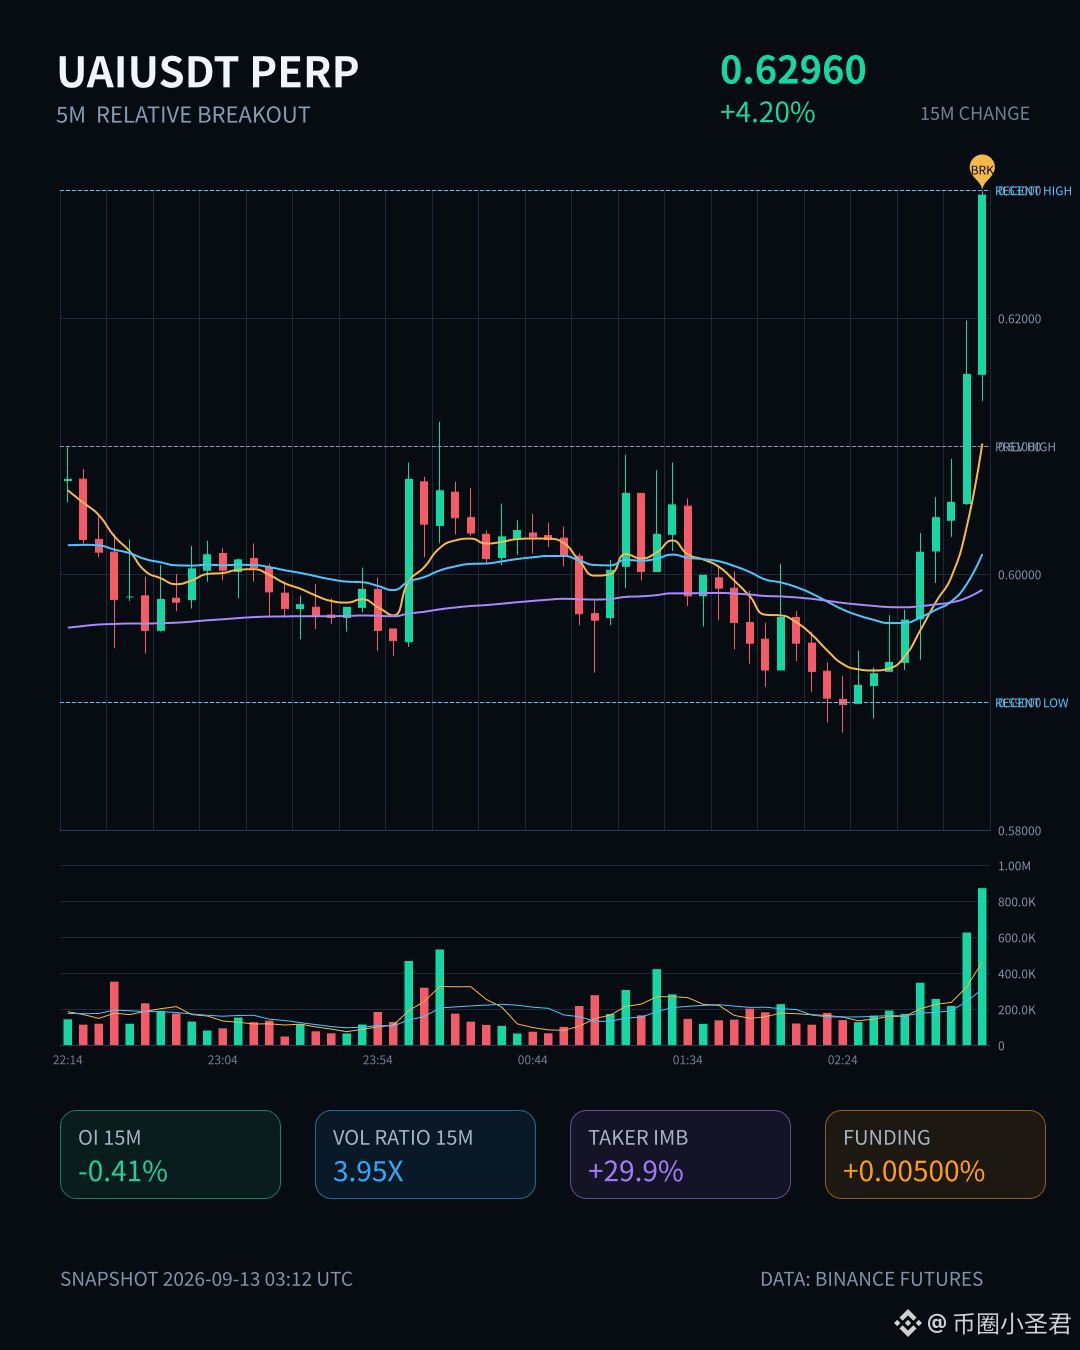
$UAI This wave has something to it.
In the 15m timeframe, it directly surged 4.2%. Trading volume hit 3.95 times the normal level, and volatility Z reached 5.37. The closing price broke above the upper band of the past 20 5m candles. Aggressive order flow differential was +29.9%, the buy/sell ratio was 1.85, and buy orders were clearly chasing.
But what’s interesting is the OI (open interest)—15m -0.41%, 1h -0.71%. With the price rising, open interest is actually falling. This doesn’t look like fresh long positions pushing in; it’s more like shorts are being forced to cover, or older positions are being closed. Nominal changes look sizable: 870K / 1.19M. In terms of full-pool nominal change rankings, it’s at #7; the anomalous percentile is 90.7%. Full pool #14—heat is definitely real.
In the last 24h, trading value was 165.98M. Depth is sufficient.
Now the question is: with OI declining alongside a breakout on rising volume, can it continue? It depends on whether there are new positions stepping in next. If it’s only being pushed up by short covering, once the covering is done, it’s easy for the momentum to fade. Let’s first see whether it can hold above this upper band.
$UAI This wave has something to it.
In the 15m timeframe, it directly surged 4.2%. Trading volume hit 3.95 times the normal level, and volatility Z reached 5.37. The closing price broke above the upper band of the past 20 5m candles. Aggressive order flow differential was +29.9%, the buy/sell ratio was 1.85, and buy orders were clearly chasing.
But what’s interesting is the OI (open interest)—15m -0.41%, 1h -0.71%. With the price rising, open interest is actually falling. This doesn’t look like fresh long positions pushing in; it’s more like shorts are being forced to cover, or older positions are being closed. Nominal changes look sizable: 870K / 1.19M. In terms of full-pool nominal change rankings, it’s at #7; the anomalous percentile is 90.7%. Full pool #14—heat is definitely real.
In the last 24h, trading value was 165.98M. Depth is sufficient.
Now the question is: with OI declining alongside a breakout on rising volume, can it continue? It depends on whether there are new positions stepping in next. If it’s only being pushed up by short covering, once the covering is done, it’s easy for the momentum to fade. Let’s first see whether it can hold above this upper band.
In the 15m timeframe, it directly surged 4.2%. Trading volume hit 3.95 times the normal level, and volatility Z reached 5.37. The closing price broke above the upper band of the past 20 5m candles. Aggressive order flow differential was +29.9%, the buy/sell ratio was 1.85, and buy orders were clearly chasing.
But what’s interesting is the OI (open interest)—15m -0.41%, 1h -0.71%. With the price rising, open interest is actually falling. This doesn’t look like fresh long positions pushing in; it’s more like shorts are being forced to cover, or older positions are being closed. Nominal changes look sizable: 870K / 1.19M. In terms of full-pool nominal change rankings, it’s at #7; the anomalous percentile is 90.7%. Full pool #14—heat is definitely real.
In the last 24h, trading value was 165.98M. Depth is sufficient.
Now the question is: with OI declining alongside a breakout on rising volume, can it continue? It depends on whether there are new positions stepping in next. If it’s only being pushed up by short covering, once the covering is done, it’s easy for the momentum to fade. Let’s first see whether it can hold above this upper band.
23
·
--
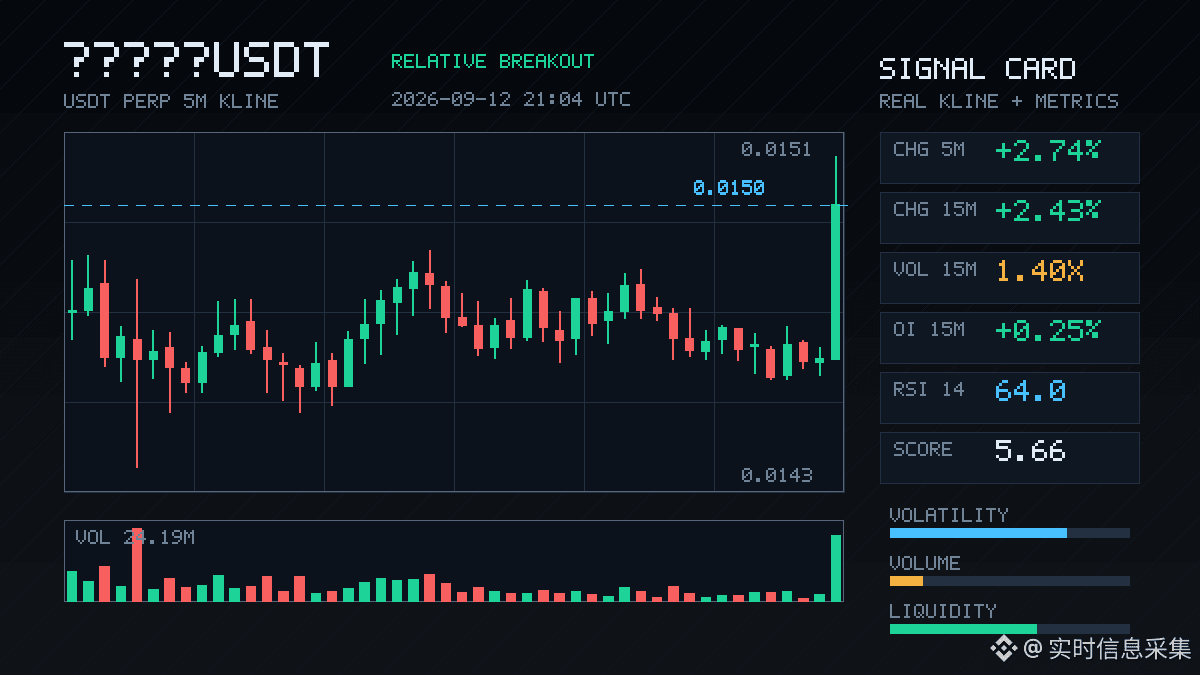
$I’m coming in, damn. With this name matching the current market, it’s actually kind of on point.
On the 15m chart it jumped straight up by 2.43%, volume was 1.40x, and the Z-score spiked to 2.94—this move isn’t just minor noise. The key is that the closing price broke above the highs of the last 20 five-minute candles, with aggressive volume 23.5% higher, and the buy/sell ratio at 1.62. The bids are genuinely sweeping—not propping the tape with posted orders.
The OI side is even more interesting: the 15m contract +0.25%, nominal +2.72%. The 1h is slightly down by 0.27%, but the nominal is still positive. The abnormal percentile for the whole pool is 81.9%, ranking #14, with nominal change ranking #22. Structurally it leans toward new leveraged long entries, not that “short-covering” kind of fake heat.
Over the last 24h, turnover is 67.44 million U. That’s mid-to-upper for the pool, and depth confirmation has also held.
At 05:04, the Asian session isn’t fully awake yet and liquidity is a bit thin—can this breakout withstand the sell pressure that’s likely to show up in the morning? But at least for now, the intent behind the aggressive buying is very clear.
I’m coming in—don’t miss the move.
$I’m coming in, damn. With this name matching the current market, it’s actually kind of on point.
On the 15m chart it jumped straight up by 2.43%, volume was 1.40x, and the Z-score spiked to 2.94—this move isn’t just minor noise. The key is that the closing price broke above the highs of the last 20 five-minute candles, with aggressive volume 23.5% higher, and the buy/sell ratio at 1.62. The bids are genuinely sweeping—not propping the tape with posted orders.
The OI side is even more interesting: the 15m contract +0.25%, nominal +2.72%. The 1h is slightly down by 0.27%, but the nominal is still positive. The abnormal percentile for the whole pool is 81.9%, ranking #14, with nominal change ranking #22. Structurally it leans toward new leveraged long entries, not that “short-covering” kind of fake heat.
Over the last 24h, turnover is 67.44 million U. That’s mid-to-upper for the pool, and depth confirmation has also held.
At 05:04, the Asian session isn’t fully awake yet and liquidity is a bit thin—can this breakout withstand the sell pressure that’s likely to show up in the morning? But at least for now, the intent behind the aggressive buying is very clear.
I’m coming in—don’t miss the move.
On the 15m chart it jumped straight up by 2.43%, volume was 1.40x, and the Z-score spiked to 2.94—this move isn’t just minor noise. The key is that the closing price broke above the highs of the last 20 five-minute candles, with aggressive volume 23.5% higher, and the buy/sell ratio at 1.62. The bids are genuinely sweeping—not propping the tape with posted orders.
The OI side is even more interesting: the 15m contract +0.25%, nominal +2.72%. The 1h is slightly down by 0.27%, but the nominal is still positive. The abnormal percentile for the whole pool is 81.9%, ranking #14, with nominal change ranking #22. Structurally it leans toward new leveraged long entries, not that “short-covering” kind of fake heat.
Over the last 24h, turnover is 67.44 million U. That’s mid-to-upper for the pool, and depth confirmation has also held.
At 05:04, the Asian session isn’t fully awake yet and liquidity is a bit thin—can this breakout withstand the sell pressure that’s likely to show up in the morning? But at least for now, the intent behind the aggressive buying is very clear.
I’m coming in—don’t miss the move.
14
·
--
ZRO This 15 minutes is kind of interesting.
The price is up 0.62%, volume immediately surged to 2.25x, the aggressive buy/sell ratio is 2.90, and the buy side is completely one-sided. OI (15m) is +0.24%, and 1h is also edging higher; the abnormal percentile for open interest hit 84.9%, with the whole pool ranking at #14.
This doesn’t look like a simple short covering—it feels more like new leveraged long positions entering. Price is rising and OI is increasing in sync; the structure is relatively clean. The close also broke above the upper band of the last 20 5m candles, and the funding rate is also in a high percentile recently.
With volume and price lining up like this, there is short-term momentum. But at this funding-rate level, be careful—there are more people chasing higher, which could lead to a sweep. First, see if it can hold steady above the top of this range.
ZRO This 15 minutes is kind of interesting.
The price is up 0.62%, volume immediately surged to 2.25x, the aggressive buy/sell ratio is 2.90, and the buy side is completely one-sided. OI (15m) is +0.24%, and 1h is also edging higher; the abnormal percentile for open interest hit 84.9%, with the whole pool ranking at #14.
This doesn’t look like a simple short covering—it feels more like new leveraged long positions entering. Price is rising and OI is increasing in sync; the structure is relatively clean. The close also broke above the upper band of the last 20 5m candles, and the funding rate is also in a high percentile recently.
With volume and price lining up like this, there is short-term momentum. But at this funding-rate level, be careful—there are more people chasing higher, which could lead to a sweep. First, see if it can hold steady above the top of this range.
The price is up 0.62%, volume immediately surged to 2.25x, the aggressive buy/sell ratio is 2.90, and the buy side is completely one-sided. OI (15m) is +0.24%, and 1h is also edging higher; the abnormal percentile for open interest hit 84.9%, with the whole pool ranking at #14.
This doesn’t look like a simple short covering—it feels more like new leveraged long positions entering. Price is rising and OI is increasing in sync; the structure is relatively clean. The close also broke above the upper band of the last 20 5m candles, and the funding rate is also in a high percentile recently.
With volume and price lining up like this, there is short-term momentum. But at this funding-rate level, be careful—there are more people chasing higher, which could lead to a sweep. First, see if it can hold steady above the top of this range.
1
·
--
$MARSCOIN This move looks more like the bulls being lifted out.
15m down 1.40%, volume hasn’t expanded, but OI has been falling continuously—15m -1.72%, 1h -1.84%, notional shrank by 1.63M, and several consecutive cycles have been reducing positions. The aggressive trade gap is -22.8%, buy-sell ratio is 0.63. It’s getting slammed more than it’s being picked up, yet the price hasn’t collapsed—it’s just slowly bleeding out.
84.5% abnormal percentile, Pool #35 overall, notional change Pool #14. Over the past 24h, trading volume is 198M propping it up, and the depth isn’t too bad.
The issue is: when the longs delever, who’s taking the other side?
$MARSCOIN This move looks more like the bulls being lifted out.
15m down 1.40%, volume hasn’t expanded, but OI has been falling continuously—15m -1.72%, 1h -1.84%, notional shrank by 1.63M, and several consecutive cycles have been reducing positions. The aggressive trade gap is -22.8%, buy-sell ratio is 0.63. It’s getting slammed more than it’s being picked up, yet the price hasn’t collapsed—it’s just slowly bleeding out.
84.5% abnormal percentile, Pool #35 overall, notional change Pool #14. Over the past 24h, trading volume is 198M propping it up, and the depth isn’t too bad.
The issue is: when the longs delever, who’s taking the other side?
15m down 1.40%, volume hasn’t expanded, but OI has been falling continuously—15m -1.72%, 1h -1.84%, notional shrank by 1.63M, and several consecutive cycles have been reducing positions. The aggressive trade gap is -22.8%, buy-sell ratio is 0.63. It’s getting slammed more than it’s being picked up, yet the price hasn’t collapsed—it’s just slowly bleeding out.
84.5% abnormal percentile, Pool #35 overall, notional change Pool #14. Over the past 24h, trading volume is 198M propping it up, and the depth isn’t too bad.
The issue is: when the longs delever, who’s taking the other side?

21
·
--
$BTR This 15 minutes is a bit interesting: the price surged by 3.92%. Trading volume went straight to 2.3x, and the volatility Z reached 2.99. This isn’t one of those low-volume fake breakouts. OI: 15m +0.55%, 1h +0.61%. The absolute nominal changes aren’t huge, but both the price and open interest are moving up together—more like fresh leveraged long positions are entering, not short covering. Active trades are down 5.3%, buy/sell ratio is 1.11—bullish, but not extreme.
Just now the closing price broke above the upper edge of the recent 20 five-minute K-line zone. As long as volume doesn’t quickly dry up, this kind of structure usually still has momentum. However, the abnormal-position percentile is already 86.7%, and the whole pool abnormal is #14, so the heat isn’t low. If you chase, keep a close eye on whether there’s increased volume on any upper wicks on the 15m. The 24h turnover is only 27.67M and liquidity depth is average—don’t go in with a heavy position.
$BTR This 15 minutes is a bit interesting: the price surged by 3.92%. Trading volume went straight to 2.3x, and the volatility Z reached 2.99. This isn’t one of those low-volume fake breakouts. OI: 15m +0.55%, 1h +0.61%. The absolute nominal changes aren’t huge, but both the price and open interest are moving up together—more like fresh leveraged long positions are entering, not short covering. Active trades are down 5.3%, buy/sell ratio is 1.11—bullish, but not extreme.
Just now the closing price broke above the upper edge of the recent 20 five-minute K-line zone. As long as volume doesn’t quickly dry up, this kind of structure usually still has momentum. However, the abnormal-position percentile is already 86.7%, and the whole pool abnormal is #14, so the heat isn’t low. If you chase, keep a close eye on whether there’s increased volume on any upper wicks on the 15m. The 24h turnover is only 27.67M and liquidity depth is average—don’t go in with a heavy position.
Just now the closing price broke above the upper edge of the recent 20 five-minute K-line zone. As long as volume doesn’t quickly dry up, this kind of structure usually still has momentum. However, the abnormal-position percentile is already 86.7%, and the whole pool abnormal is #14, so the heat isn’t low. If you chase, keep a close eye on whether there’s increased volume on any upper wicks on the 15m. The 24h turnover is only 27.67M and liquidity depth is average—don’t go in with a heavy position.
135
Log in to explore more content
Join global crypto users on Binance Square
⚡️ Get latest and useful information about crypto.
💬 Trusted by the world’s largest crypto exchange.
👍 Discover real insights from verified creators.
Email / Phone number
Trending Topics
1
#FedRateWatch
1.1M views
5,156 Discussing
2
#ZcashRises6%
46 views
7 Discussing
3
#XRPSinks10%
0 views
4 Discussing
4
#CircleOpensArcMainnet
0 views
2 Discussing
5
#ZcashHoldersBackNU7Upgrade
5,429 views
173 Discussing
6
#MSTRTradingVolumeSurpassesMorganStanley
10,671 views
367 Discussing
7
#BitcoinFalls4%
25,202 views
625 Discussing
8
#SKHynixInTalksToMakeMemoryChipsInUS
11,821 views
272 Discussing
9
#OpenAIDiscussesNewFundingAt$1.2TValuation
2,633 views
46 Discussing
10
#ArgentinaCommitsToOECDCryptoReportingBy2029
20,134 views
423 Discussing