
#24
24
15,491 views
119 Discussing
Hot
Latest

Shiny Coins #24 – Four-Digit Zcash Steals the Week as Payrolls Clip the $82K Wick
Privacy coins printed a four-figure ZEC, Robinhood Chain found its Pump.fun, and then August jobs reminded everyone the Fed still has a calendar. The post Shiny Coins #24 – Four-Digit Zcash Steals the Week as Payrolls Clip the $82K Wick appeared first on Cryptopress .
Privacy coins printed a four-figure ZEC, Robinhood Chain found its Pump.fun, and then August jobs reminded everyone the Fed still has a calendar. The post Shiny Coins #24 – Four-Digit Zcash Steals the Week as Payrolls Clip the $82K Wick appeared first on Cryptopress .

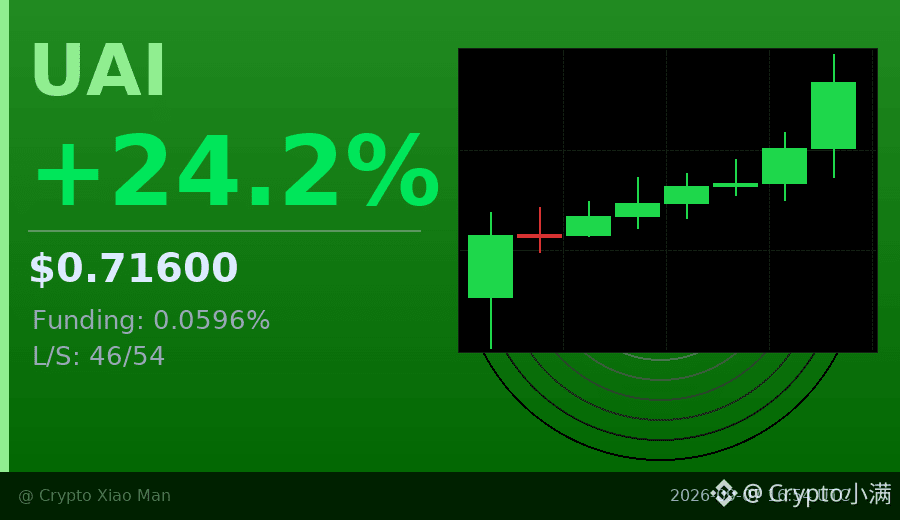
Behind the 24% price surge, the funding rate has already spiked to 0.0596%—this is long traders going berserk with leverage.
Today, UAI surged from 0.515 to 0.73 in a straight line, with trading volume hitting 163 million USDT. What’s interesting is that the long-to-short ratio is 46% vs 54%, yet shorts are actually in the majority—but the price still isn’t falling.
The hourly chart has been closing with green candles consecutively, and the last one even saw increased volume. This kind of divergence—"shorts are crowded but the price is still climbing"—often means the squeeze is still ongoing.
However, with the funding rate so high, the cost of chasing longs isn’t small. It’s better to wait for a pullback or for the funding rate to cool down before looking again more safely.
$UAI #资金费率飙升 #24% price increase
Click the small card below to quickly check the market👇
Today, UAI surged from 0.515 to 0.73 in a straight line, with trading volume hitting 163 million USDT. What’s interesting is that the long-to-short ratio is 46% vs 54%, yet shorts are actually in the majority—but the price still isn’t falling.
The hourly chart has been closing with green candles consecutively, and the last one even saw increased volume. This kind of divergence—"shorts are crowded but the price is still climbing"—often means the squeeze is still ongoing.
However, with the funding rate so high, the cost of chasing longs isn’t small. It’s better to wait for a pullback or for the funding rate to cool down before looking again more safely.
$UAI #资金费率飙升 #24% price increase
Click the small card below to quickly check the market👇
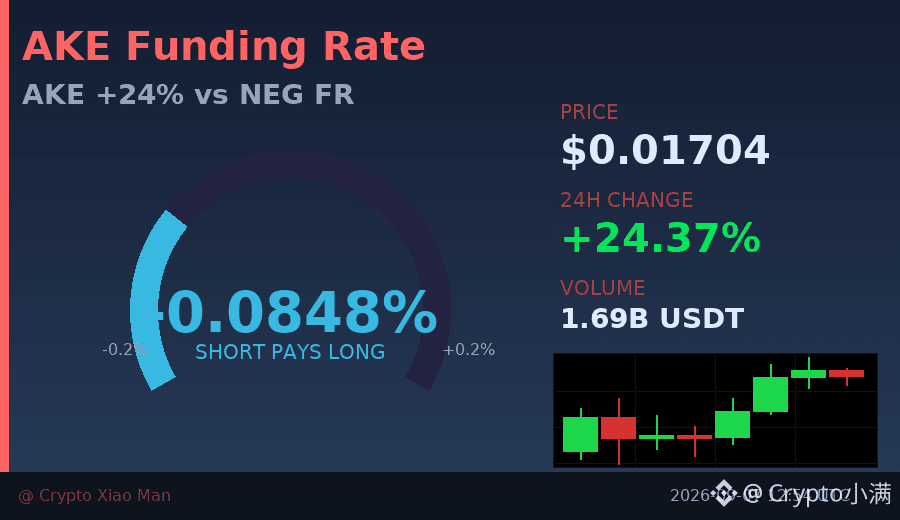
Gains of 24% in 24 hours, but the funding rate is negative—this happens on AKE at the same time.
Trading volume surged to $169 million, and the price jumped from 0.0113 to 0.0176, yet in the futures market people are actually paying shorts.
This divergence usually means: spot buying pressure is strong, but leveraged players don’t dare to chase longs—and may even short when the opportunity arises.
Over the past 8 hours the trend is broadly stronger, but the long/short ratio of 47%/53% suggests shorts still have a slight edge.
If the price keeps rising while the funding rate stays negative, it could trigger an accelerated move as shorts cover.
$AKE #资金费率背离 #24%
Click the small card below to quickly check the market update👇
Trading volume surged to $169 million, and the price jumped from 0.0113 to 0.0176, yet in the futures market people are actually paying shorts.
This divergence usually means: spot buying pressure is strong, but leveraged players don’t dare to chase longs—and may even short when the opportunity arises.
Over the past 8 hours the trend is broadly stronger, but the long/short ratio of 47%/53% suggests shorts still have a slight edge.
If the price keeps rising while the funding rate stays negative, it could trigger an accelerated move as shorts cover.
$AKE #资金费率背离 #24%
Click the small card below to quickly check the market update👇

60-SECOND ALPHA #24 | $PORTAL
$PORTAL is built around connecting blockchain games and their players through the Portal gaming ecosystem. Binance currently supports PORTAL/USDT Spot trading.
The interesting lesson is distribution. In gaming, having a good game is only one part of the equation. Getting players, communities and different games into the same ecosystem can be just as important.
Alpha: In crypto gaming, distribution can be as valuable as the technology itself.
$PORTAL is built around connecting blockchain games and their players through the Portal gaming ecosystem. Binance currently supports PORTAL/USDT Spot trading.
The interesting lesson is distribution. In gaming, having a good game is only one part of the equation. Getting players, communities and different games into the same ecosystem can be just as important.
Alpha: In crypto gaming, distribution can be as valuable as the technology itself.

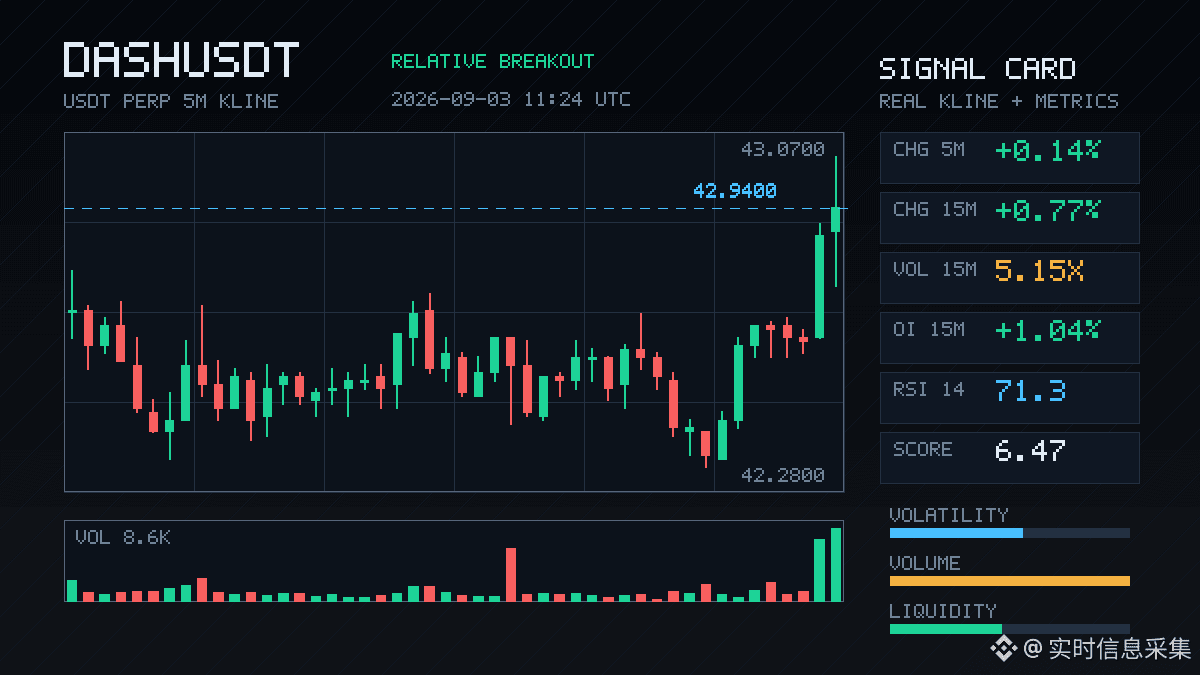
$DASH This 15-minute K-line is a bit interesting.
The price rose 0.77%, and the trading volume jumped to more than 5 times its usual level. The buy side dominated—buyers vs sellers is 1.52, so the direction is very clear. This breakout isn’t the kind of fake “up then down” move; it directly stepped over the highs of 20 five-minute K-lines. It’s the real deal—pushed through with actual money.
Looking deeper: OI increased by 1% over the short term. On the contract side, the notional change pushed up to pool #24, and the abnormal percentile hit above 98%. Put simply, this isn’t just existing players fighting it out—newly added leveraged longs are getting squeezed in aggressively. The funding attitude is right there. Even with a volatility Z-value of 2.21, it’s not exactly mild, which suggests that at the moment this price is one of the more “eye-catching” instruments in the pool.
With only about $25 million in daily volume, managing to push from the pool into the 6th-highest abnormality tier, along with structurally amplified volume, the price hitting the boundary of the range, and one-sided entry from active funds—three signals lighting up at the same time. This kind of overlap isn’t that common on DASH.
Whether it’s a bottom reversal—I won’t make reckless claims—but with this volume-price coordination, it at least shows the market is willing to set the price at this level. Keep an eye on whether it can hold steady afterward; don’t run up and then immediately drop back.
The price rose 0.77%, and the trading volume jumped to more than 5 times its usual level. The buy side dominated—buyers vs sellers is 1.52, so the direction is very clear. This breakout isn’t the kind of fake “up then down” move; it directly stepped over the highs of 20 five-minute K-lines. It’s the real deal—pushed through with actual money.
Looking deeper: OI increased by 1% over the short term. On the contract side, the notional change pushed up to pool #24, and the abnormal percentile hit above 98%. Put simply, this isn’t just existing players fighting it out—newly added leveraged longs are getting squeezed in aggressively. The funding attitude is right there. Even with a volatility Z-value of 2.21, it’s not exactly mild, which suggests that at the moment this price is one of the more “eye-catching” instruments in the pool.
With only about $25 million in daily volume, managing to push from the pool into the 6th-highest abnormality tier, along with structurally amplified volume, the price hitting the boundary of the range, and one-sided entry from active funds—three signals lighting up at the same time. This kind of overlap isn’t that common on DASH.
Whether it’s a bottom reversal—I won’t make reckless claims—but with this volume-price coordination, it at least shows the market is willing to set the price at this level. Keep an eye on whether it can hold steady afterward; don’t run up and then immediately drop back.

$HOOD I’m more inclined to be bullish, and I also feel this isn’t the kind of stock that just runs hot for a day or two and then goes nowhere.
When I look at a company like this, my first reaction isn’t to ask how much it’s up today.
First, I check which track or sector it’s in.
From what I understand, $HOOD is roughly still focused on the retail trading entry point—benefiting from the way ordinary people migrate their habits of participating in stocks, options, and crypto trading.
Once these platforms truly manage to build user habits, the stickiness is often not low.
Your account is here, your money is here, and your trading actions are here. Cutting over to another platform sounds easy on the surface, but in reality, not that many people actually do it.
The market price action also gives me some confidence.
It’s currently $106.23, the 24-hour high is $106.25, and the low is $100.82—basically it was pressured during the daytime, then it pushed back.
That kind of movement makes me want to take a closer look.
It’s not a hot-blast,爽文-style surge. It’s a move where someone is willing to buy when it dips.
Looking at the activity levels too: on Binance, in the U.S. stock perpetuals, it ranks #24 on the gainers list, #26 on the trading volume list, with $27.26M USDT in 24-hour volume.
This suggests it’s not ignored—it's just not hot enough yet that everyone is shouting about it.
Honestly, I prefer this kind of state.
I’ve lost too much on stocks that were too crowded.
There’s one more detail I can’t completely ignore.
The funding rate is +0.0354%, not exaggerated, and the open interest is 113,733 contracts.
This feels a bit like when people are starting to lean toward the long side, but they haven’t leaned so far that it’s really scorching.
When I traded futures in those years, the thing I feared most was a position where, at a glance, it seems like everyone in the world believes it’s going to keep charging.
With this level of crowding, at least it hasn’t given me chills.
Of course, being bullish doesn’t mean you can just close your eyes and go up.
This kind of trade is very dependent on market sentiment. If trading heat fades, or if the overall market direction turns, then things with higher elasticity can snap back quickly too.
For my own part, I would treat it as something “worth continuously watching,” not as an impulse trade you chase on the spur of the moment.
If you ask me what my attitude is right now, I’m willing to keep standing on the bullish side and watching it.
If I really decide to act, I’d be more willing to wait for an opportunity after a pullback—I don’t want to reach in at the peak of the hottest emotion.
That’s my take. Your money is your decision. $HOOD #美股
When I look at a company like this, my first reaction isn’t to ask how much it’s up today.
First, I check which track or sector it’s in.
From what I understand, $HOOD is roughly still focused on the retail trading entry point—benefiting from the way ordinary people migrate their habits of participating in stocks, options, and crypto trading.
Once these platforms truly manage to build user habits, the stickiness is often not low.
Your account is here, your money is here, and your trading actions are here. Cutting over to another platform sounds easy on the surface, but in reality, not that many people actually do it.
The market price action also gives me some confidence.
It’s currently $106.23, the 24-hour high is $106.25, and the low is $100.82—basically it was pressured during the daytime, then it pushed back.
That kind of movement makes me want to take a closer look.
It’s not a hot-blast,爽文-style surge. It’s a move where someone is willing to buy when it dips.
Looking at the activity levels too: on Binance, in the U.S. stock perpetuals, it ranks #24 on the gainers list, #26 on the trading volume list, with $27.26M USDT in 24-hour volume.
This suggests it’s not ignored—it's just not hot enough yet that everyone is shouting about it.
Honestly, I prefer this kind of state.
I’ve lost too much on stocks that were too crowded.
There’s one more detail I can’t completely ignore.
The funding rate is +0.0354%, not exaggerated, and the open interest is 113,733 contracts.
This feels a bit like when people are starting to lean toward the long side, but they haven’t leaned so far that it’s really scorching.
When I traded futures in those years, the thing I feared most was a position where, at a glance, it seems like everyone in the world believes it’s going to keep charging.
With this level of crowding, at least it hasn’t given me chills.
Of course, being bullish doesn’t mean you can just close your eyes and go up.
This kind of trade is very dependent on market sentiment. If trading heat fades, or if the overall market direction turns, then things with higher elasticity can snap back quickly too.
For my own part, I would treat it as something “worth continuously watching,” not as an impulse trade you chase on the spur of the moment.
If you ask me what my attitude is right now, I’m willing to keep standing on the bullish side and watching it.
If I really decide to act, I’d be more willing to wait for an opportunity after a pullback—I don’t want to reach in at the peak of the hottest emotion.
That’s my take. Your money is your decision. $HOOD #美股
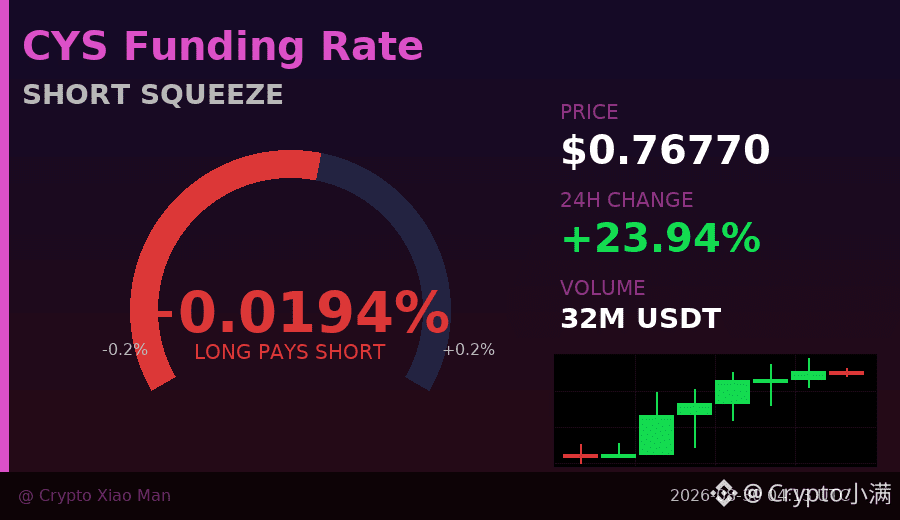
Shorts dominate, but the price still rose by 24%.
That’s exactly the situation with CYS today—data shows that 55% of participants are shorting, yet it still climbed from 0.61 to 0.77, with an intraday range of over 20%.
This kind of “shorts being squeezed” move has a name: a short squeeze (Short Squeeze). In simple terms, large-scale shorts place stop-loss orders. Once the price breaks above a certain level, the system automatically buys to close their positions. These forced buy orders, ironically, push the price even higher.
What’s most worth noting today is the candlestick rhythm: the first two candles had very low trading volume (under 500,000). Then the third candle suddenly saw a surge to nearly 5,000,000, followed by several hours of continued strength. This kind of “warming up in lukewarm water, then suddenly boiling” pattern usually suggests that some capital is quietly building a position—then pumps the price after the accumulation is done.
The funding rate is currently positive but not high (about 0.019%), which indicates that the longs aren’t overly euphoric and leverage hasn’t been stacked excessively. That actually gives the market more support.
However, keep in mind: in the short term, the short ratio is still relatively high. If the shorting capital continues to refuse to give up and the price pulls back, selling pressure could come very quickly.
Whether it can hold steady around 0.77 is the key going forward.
$CYS #空头挤压 #24%涨幅
Click the small card below to quickly check the market 👇
That’s exactly the situation with CYS today—data shows that 55% of participants are shorting, yet it still climbed from 0.61 to 0.77, with an intraday range of over 20%.
This kind of “shorts being squeezed” move has a name: a short squeeze (Short Squeeze). In simple terms, large-scale shorts place stop-loss orders. Once the price breaks above a certain level, the system automatically buys to close their positions. These forced buy orders, ironically, push the price even higher.
What’s most worth noting today is the candlestick rhythm: the first two candles had very low trading volume (under 500,000). Then the third candle suddenly saw a surge to nearly 5,000,000, followed by several hours of continued strength. This kind of “warming up in lukewarm water, then suddenly boiling” pattern usually suggests that some capital is quietly building a position—then pumps the price after the accumulation is done.
The funding rate is currently positive but not high (about 0.019%), which indicates that the longs aren’t overly euphoric and leverage hasn’t been stacked excessively. That actually gives the market more support.
However, keep in mind: in the short term, the short ratio is still relatively high. If the shorting capital continues to refuse to give up and the price pulls back, selling pressure could come very quickly.
Whether it can hold steady around 0.77 is the key going forward.
$CYS #空头挤压 #24%涨幅
Click the small card below to quickly check the market 👇

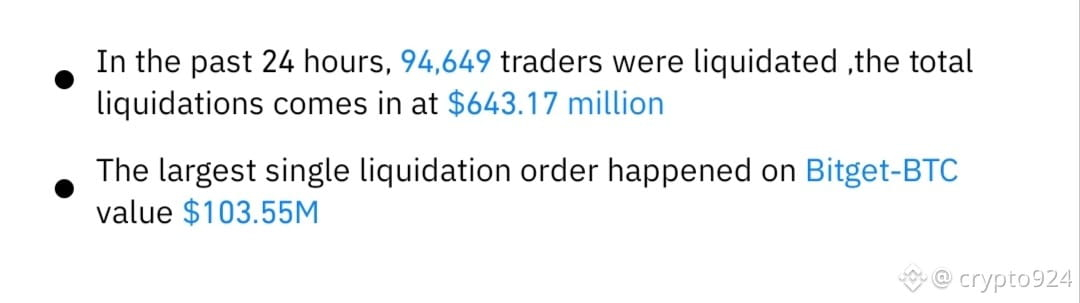
#Liquidations at past #24 you will be shocked 😳😳😳😳
see this from single largest liquidation $103.55 million $BTC
$SOL
$DOGE
see this from single largest liquidation $103.55 million $BTC
$SOL
$DOGE

$LAB This 15-minute timeframe move is kind of interesting: the price dropped to the lower bound of the range covered by nearly 20 5-minute candlesticks. The trading volume immediately expanded to 3.48 times, and the aggressive sell pressure gap is -31.7%, with the buy/sell pressure ratio down to 0.52—so the bears really are pounding the market. But OI is actually contracting: the 15m notional dropped by 181K, about -1.32%. The flavor of long positions exiting and cutting losses is getting stronger.
In plain terms, this isn’t that kind of “adding positions to suppress” breakdown. It feels more like longs can’t hold up and are actively easing the leverage, with the decline driven by position shrinkage—meaning the move often turns out to be more fragile. If sentiment recovers in the short term, the rebound may also offer a decent window for shorts to cover. LAB is currently at the 94.2% abnormal percentile for OI, ranking #24 in the whole pool. The depth is indeed solid. 24h volume is 14.7M, and the liquidity can hold up.
First, see whether key boundary levels can be defended. If they hold, wait for a recovery-and-confirmation, and don’t load up on shorts too aggressively.
In plain terms, this isn’t that kind of “adding positions to suppress” breakdown. It feels more like longs can’t hold up and are actively easing the leverage, with the decline driven by position shrinkage—meaning the move often turns out to be more fragile. If sentiment recovers in the short term, the rebound may also offer a decent window for shorts to cover. LAB is currently at the 94.2% abnormal percentile for OI, ranking #24 in the whole pool. The depth is indeed solid. 24h volume is 14.7M, and the liquidity can hold up.
First, see whether key boundary levels can be defended. If they hold, wait for a recovery-and-confirmation, and don’t load up on shorts too aggressively.

$ONDO This 15-minute move has some substance.
The volume of liquidity was directly pulled to 3.46x, and the price conveniently broke through the upper bound of the range on the past ~20 five-minute K-lines. OI is also increasing; the notional change is ranked #21 in the whole pool. This structure—“price rising + leveraged longs entering”—is sturdier than simply expanding volume. The funding rate is also in a high percentile recently, suggesting market sentiment is hot, but not to the point where FOMO has completely run wild.
On the data side, the abnormality level of the whole pool is #24, and it has been continuing for several consecutive cycles—not a one-off pulse buy/sell. Active trading spread is down 8.3%, and the buy/sell ratio is 1.18. The longs are really doing the work. How much it can rise is hard to say, but if this kind of persistence holds, don’t rush to get off.
Just keep an eye on the volume/flow: if it shrinks, run.
The volume of liquidity was directly pulled to 3.46x, and the price conveniently broke through the upper bound of the range on the past ~20 five-minute K-lines. OI is also increasing; the notional change is ranked #21 in the whole pool. This structure—“price rising + leveraged longs entering”—is sturdier than simply expanding volume. The funding rate is also in a high percentile recently, suggesting market sentiment is hot, but not to the point where FOMO has completely run wild.
On the data side, the abnormality level of the whole pool is #24, and it has been continuing for several consecutive cycles—not a one-off pulse buy/sell. Active trading spread is down 8.3%, and the buy/sell ratio is 1.18. The longs are really doing the work. How much it can rise is hard to say, but if this kind of persistence holds, don’t rush to get off.
Just keep an eye on the volume/flow: if it shrinks, run.
$BSB 15 minute-level direct breakthrough, down 1.22%, with the closing price falling below the lower bound of the past nearly 20 five-minute K-line range. Trading volume has swelled to 3.45 times the usual level. This drop isn’t a low-volume, slow bleed—it looks like someone is genuinely dumping.
What’s even more worth noting is the contract data: 15-minute OI only fell by 0.09%, but nominal changes dropped by 110K; on the 1-hour dimension, nominal shrinkage is 132K as well. What does this mean? It’s not a showdown between long and short big players, but more like leveraged positions being liquidated and longs actively withdrawing. The difference in passive vs. active trading is -29%, the buy/sell ratio is 0.55, and sellers are in full control. Abnormality across the whole pool ranks #24; volume anomaly is near the top, and the nominal change ranking of #37—this combination of data is a textbook deleveraging move.
The order book only has about $10 million in 24 hours. In situations like this, technical levels are basically made of paper. First, see whether the order book can hold steady—don’t rush to catch flying knives.
What’s even more worth noting is the contract data: 15-minute OI only fell by 0.09%, but nominal changes dropped by 110K; on the 1-hour dimension, nominal shrinkage is 132K as well. What does this mean? It’s not a showdown between long and short big players, but more like leveraged positions being liquidated and longs actively withdrawing. The difference in passive vs. active trading is -29%, the buy/sell ratio is 0.55, and sellers are in full control. Abnormality across the whole pool ranks #24; volume anomaly is near the top, and the nominal change ranking of #37—this combination of data is a textbook deleveraging move.
The order book only has about $10 million in 24 hours. In situations like this, technical levels are basically made of paper. First, see whether the order book can hold steady—don’t rush to catch flying knives.
$MON This morning, this move was pretty interesting. Within 15 minutes it surged with a 7.3x volume increase—pushing the price above the upper edge of nearly 20 five-minute candlesticks. The aggressive buy orders were lacking by about 60%, and the buy-sell ratio climbed to nearly 4x. This isn’t the kind of dithering volume you usually see from retail traders—it really has the feel of capital actively snatching up positions.
What’s even more worth paying attention to is that OI (open interest) is also rising in sync. On the hourly timeframe, the notional change is up +1.8%, which suggests this isn’t just a fake breakout from pure short-covering. It looks more like newly added leveraged long positions are entering. Although the 24-hour trading volume is only a bit over $9 million—not exactly a large fund pool—its activity ranking within its own pool has already climbed to #24, and the whole pool’s notional change ranks #36. Measured against the entire market in relative terms, this signal isn’t low in informational value.
At the high percentile of 87.7%, chasing higher comes with obvious risk, but it doesn’t look like the directional money has pulled out for now. Don’t ask me what my target price is—let’s first see whether it can hold steady above this breakout level.
What’s even more worth paying attention to is that OI (open interest) is also rising in sync. On the hourly timeframe, the notional change is up +1.8%, which suggests this isn’t just a fake breakout from pure short-covering. It looks more like newly added leveraged long positions are entering. Although the 24-hour trading volume is only a bit over $9 million—not exactly a large fund pool—its activity ranking within its own pool has already climbed to #24, and the whole pool’s notional change ranks #36. Measured against the entire market in relative terms, this signal isn’t low in informational value.
At the high percentile of 87.7%, chasing higher comes with obvious risk, but it doesn’t look like the directional money has pulled out for now. Don’t ask me what my target price is—let’s first see whether it can hold steady above this breakout level.

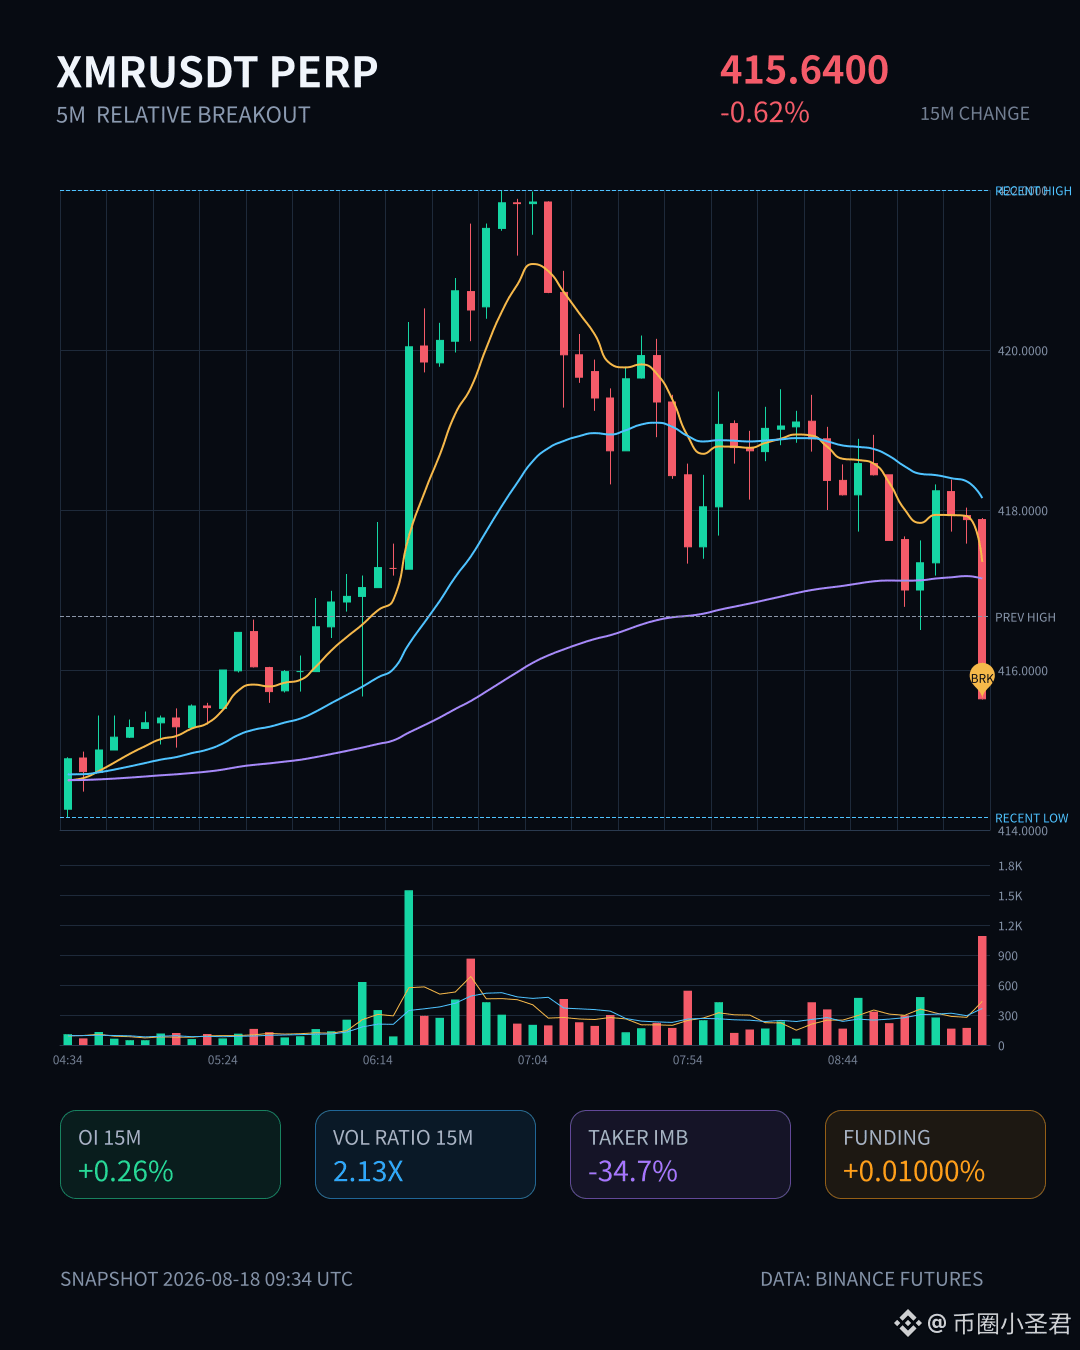
$XMR This looks like the short side is adding to positions. The OI is rising quickly, but the price is still probing lower—an obvious entry rhythm of leveraged short capital. In the 15-minute chart, it breaks below the lower bound of the recent range right away. The passive selling pressure is clearly heavier, and the buy-sell ratio of 0.48 is extremely extreme.
Trading volume is up to 2.1x, but the price only drops 0.62%. That suggests someone is desperately holding the line at this level. The battle between bulls and bears is a bit interesting. However, the 86.9% abnormal percentile is still sitting at #24 in the pool, and the nominal change is also relatively forward—this definitely isn’t ordinary day-to-day volatility.
With this kind of data and structure paired together, it won’t be easy for the short term to V-recover directly. But if the shorts get too full, it’s also easy for them to get blindsided. Looking at the tape, I’m actually more curious about who will be the first to lay down their arms next.
Trading volume is up to 2.1x, but the price only drops 0.62%. That suggests someone is desperately holding the line at this level. The battle between bulls and bears is a bit interesting. However, the 86.9% abnormal percentile is still sitting at #24 in the pool, and the nominal change is also relatively forward—this definitely isn’t ordinary day-to-day volatility.
With this kind of data and structure paired together, it won’t be easy for the short term to V-recover directly. But if the shorts get too full, it’s also easy for them to get blindsided. Looking at the tape, I’m actually more curious about who will be the first to lay down their arms next.

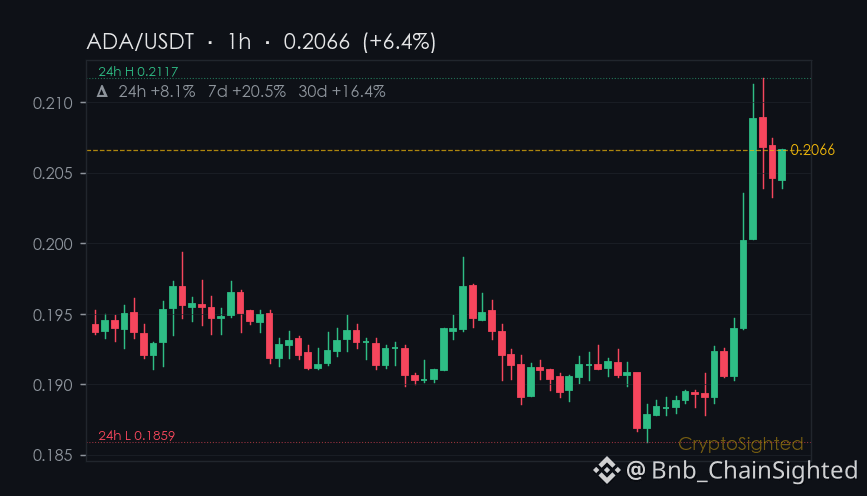
8.1% - that’s the 24-hour gain for $ADA .
ADA is moving up sharply - ↑8.1% in 24 hours - even as most of the market is in the red.
That alone is enough to make you pause. But what’s more striking is the sheer size of the trade: 223 million ADA changed hands, a number that puts it in the top 10 by volume despite its lack of a major news headline.
The question is - can this momentum hold as attention shifts elsewhere? Likely more chop near-term.
—
Not financial advice. DYOR.
📌 Altcoin Radar · #24 · #Altcoins #CryptoSighted $ADA
ADA is moving up sharply - ↑8.1% in 24 hours - even as most of the market is in the red.
That alone is enough to make you pause. But what’s more striking is the sheer size of the trade: 223 million ADA changed hands, a number that puts it in the top 10 by volume despite its lack of a major news headline.
The question is - can this momentum hold as attention shifts elsewhere? Likely more chop near-term.
—
Not financial advice. DYOR.
📌 Altcoin Radar · #24 · #Altcoins #CryptoSighted $ADA

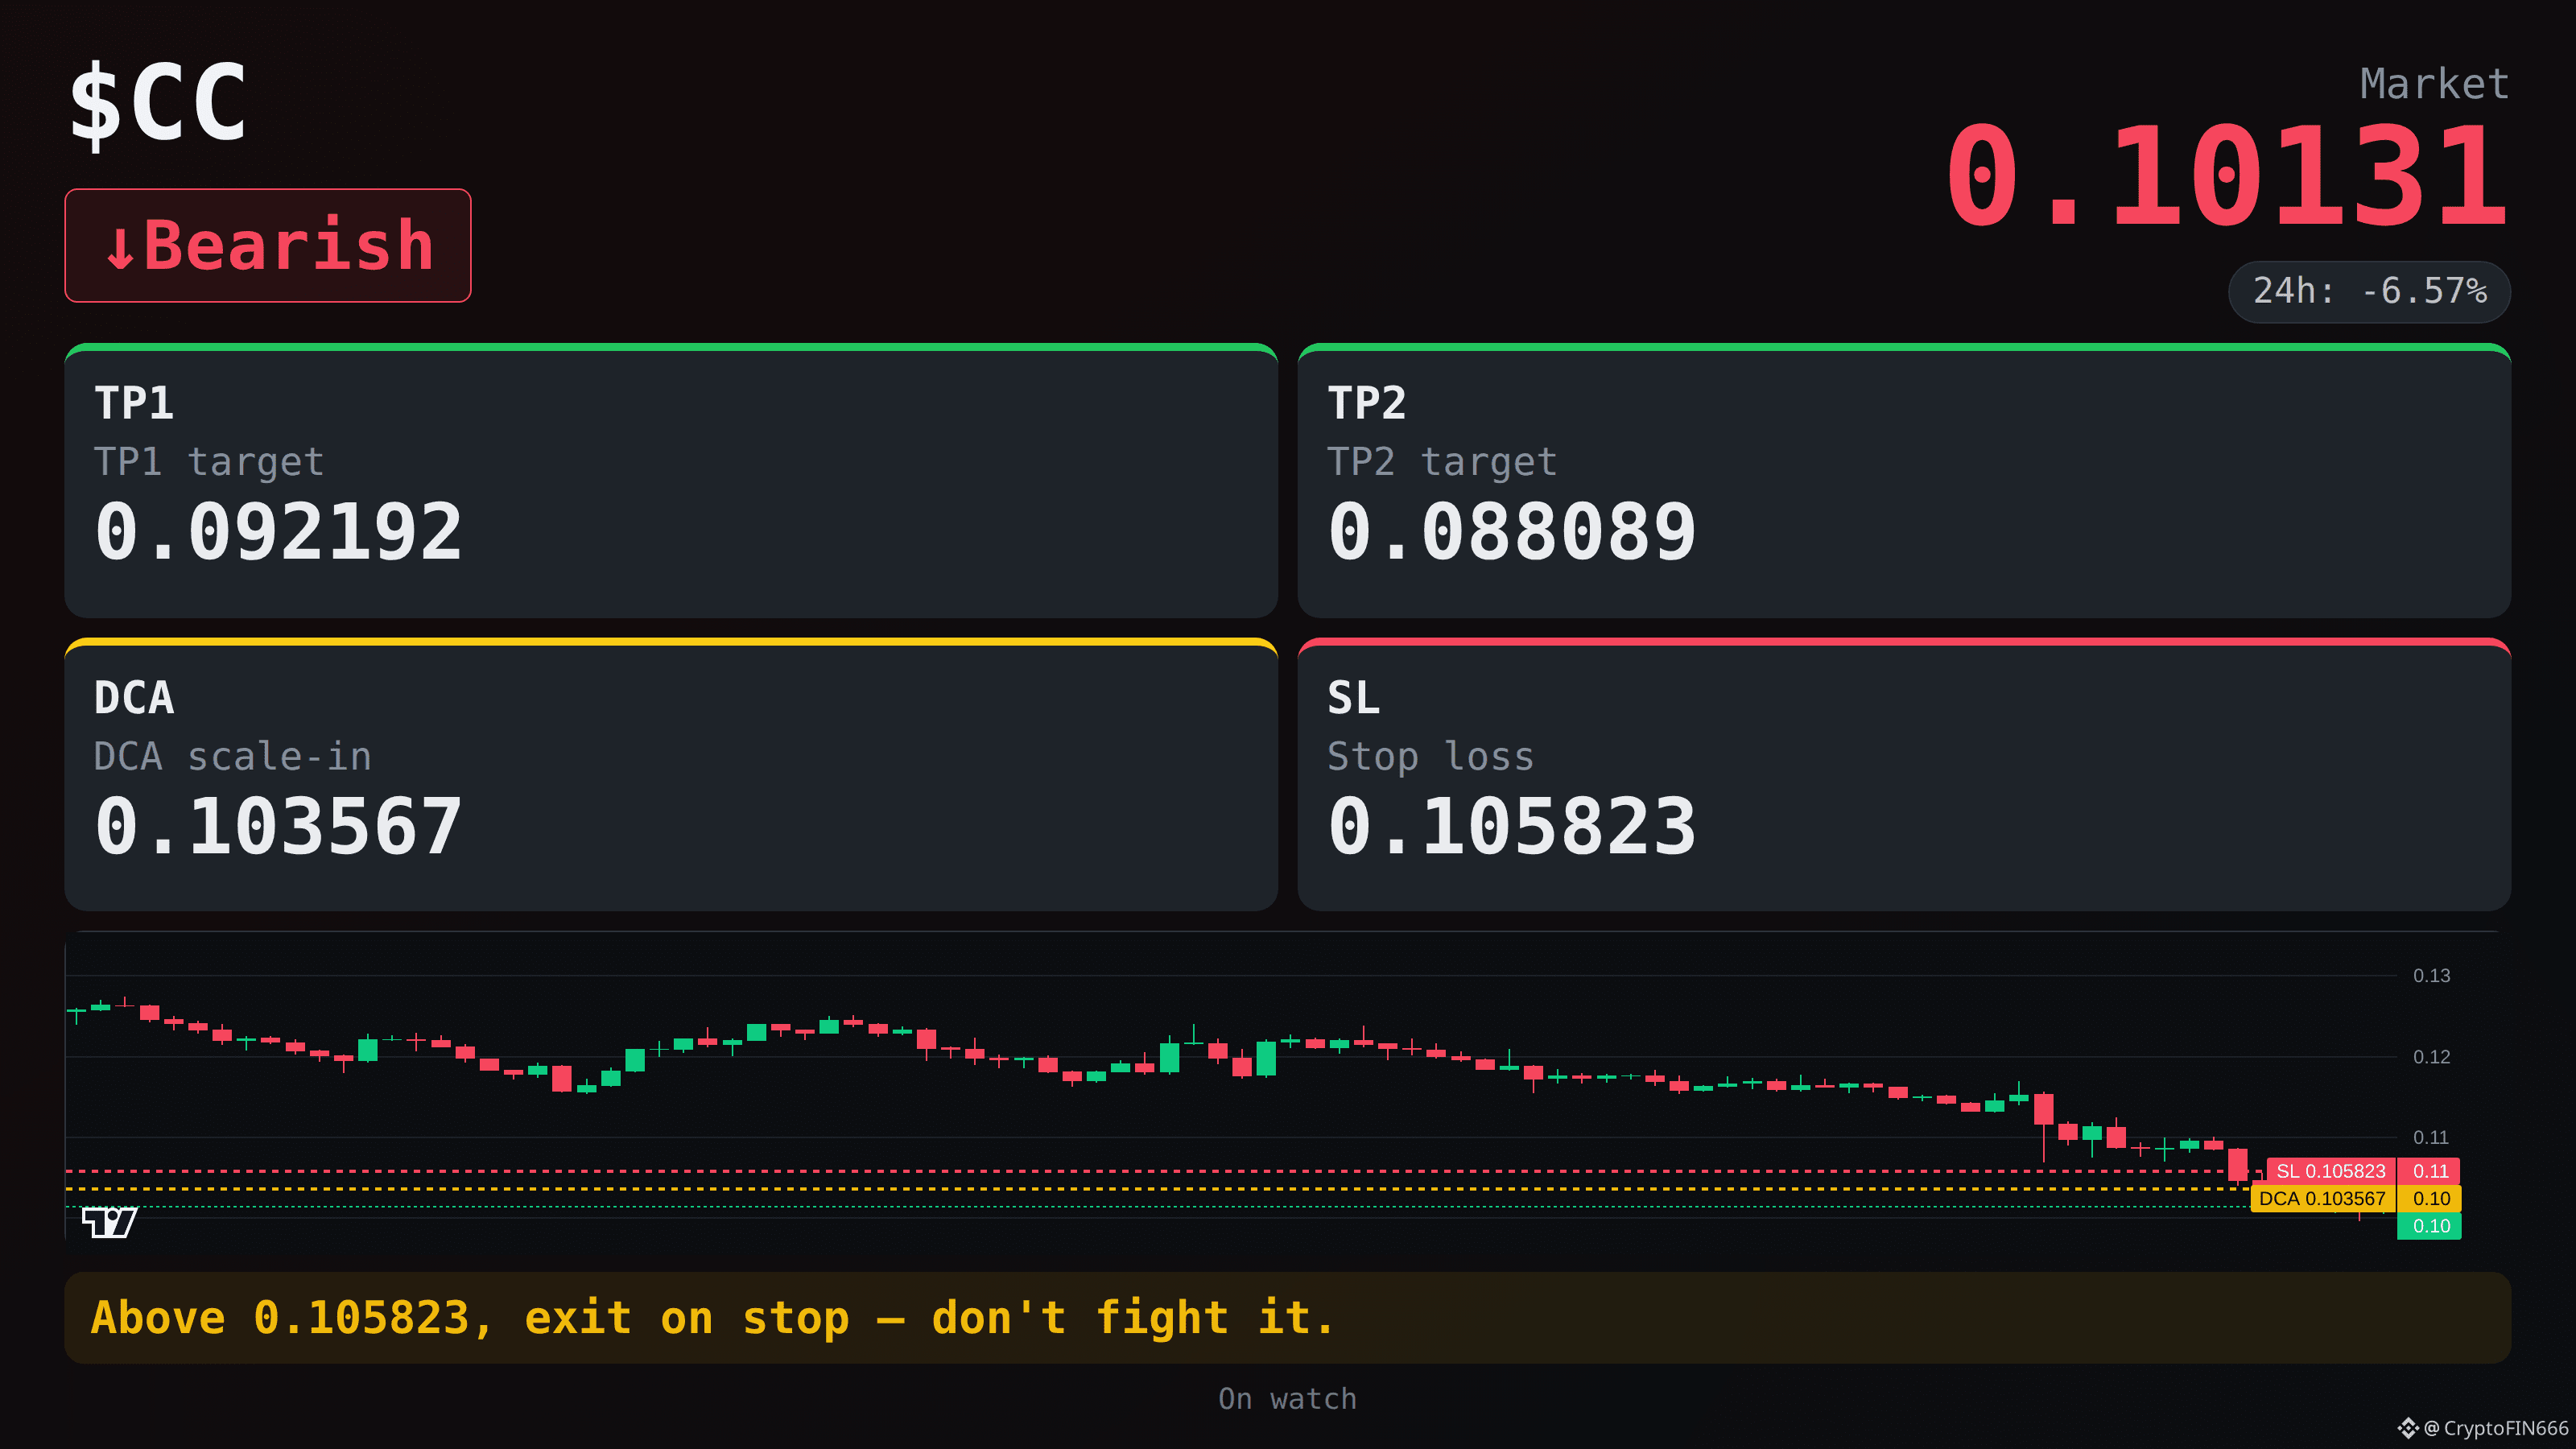
$CC Bearish, Market entry: 0.10131
TP1 below: 0.092192 (first take-profit)
TP2 below: 0.088089 (second take-profit)
DCA: 0.103567 (add-position watch level on bounce)
SL: 0.105823 (stop-loss exit level)
Canton is trending on hot search, ranked #24 by market cap, but down 6.5% in 24h — hype and price are moving in opposite directions. Long/short ratio at 1.03, more long accounts, yet funding is only 0.0014% — longs aren't daring to add leverage, this bounce looks weak. OI is still up 1.67%, someone is stepping in to catch the knife, but they're not catching it.
If price reclaims 0.105823, exit immediately on the stop — don't stubbornly hold the short.
TP1 below: 0.092192 (first take-profit)
TP2 below: 0.088089 (second take-profit)
DCA: 0.103567 (add-position watch level on bounce)
SL: 0.105823 (stop-loss exit level)
Canton is trending on hot search, ranked #24 by market cap, but down 6.5% in 24h — hype and price are moving in opposite directions. Long/short ratio at 1.03, more long accounts, yet funding is only 0.0014% — longs aren't daring to add leverage, this bounce looks weak. OI is still up 1.67%, someone is stepping in to catch the knife, but they're not catching it.
If price reclaims 0.105823, exit immediately on the stop — don't stubbornly hold the short.
$BinanceLife Today, the contract trades hit 61 million, while spot only reached 20 million, giving us a 3x ratio.
This structure doesn't look quite right. The contract volume is 3 times that of spot, indicating that today's market action is mainly driven by contracts, not actual spot funds entering the market. The funding rate is +0.0611%, which is on the high side but not extreme yet; bulls are still piling in. However, given this funding rate alongside the 3x contract/spot ratio, I have my doubts about sustainability.
From the low of $0.4358 to the high of $0.54, the daily volatility is nearly 24%. We saw 141,897 transactions, with an average transaction size of less than 150 USDT—mostly retail trades, with no significant institutional orders visible. Spot is ranked #4 in terms of gains, but its trading volume only ranks #24, indicating a divergence between price and volume.
Open interest stands at 120 million coins, and when combined with today's contract trading volume, the turnover rate is decent. In this scenario, if the funding rate continues to climb tomorrow and long positions start to weaken, a pullback could happen quickly.
I'm not holding any positions. These types of coins often have emotional premiums in their names, leading to market movements that are usually driven by sentiment and one-sided impulses. The entry point should wait for the contract/spot ratio to converge and for the funding rate to return to normal levels before making a move. Chasing longs now doesn’t offer a favorable risk-reward ratio; I’ll wait for a retracement to assess the structure.
$BinanceLife #币安人生 #HotCoinWatch
If I lose, don't cue me; if I win, buy me a cup of coffee.
This structure doesn't look quite right. The contract volume is 3 times that of spot, indicating that today's market action is mainly driven by contracts, not actual spot funds entering the market. The funding rate is +0.0611%, which is on the high side but not extreme yet; bulls are still piling in. However, given this funding rate alongside the 3x contract/spot ratio, I have my doubts about sustainability.
From the low of $0.4358 to the high of $0.54, the daily volatility is nearly 24%. We saw 141,897 transactions, with an average transaction size of less than 150 USDT—mostly retail trades, with no significant institutional orders visible. Spot is ranked #4 in terms of gains, but its trading volume only ranks #24, indicating a divergence between price and volume.
Open interest stands at 120 million coins, and when combined with today's contract trading volume, the turnover rate is decent. In this scenario, if the funding rate continues to climb tomorrow and long positions start to weaken, a pullback could happen quickly.
I'm not holding any positions. These types of coins often have emotional premiums in their names, leading to market movements that are usually driven by sentiment and one-sided impulses. The entry point should wait for the contract/spot ratio to converge and for the funding rate to return to normal levels before making a move. Chasing longs now doesn’t offer a favorable risk-reward ratio; I’ll wait for a retracement to assess the structure.
$BinanceLife #币安人生 #HotCoinWatch
If I lose, don't cue me; if I win, buy me a cup of coffee.


I've checked the latest trends on CoinGecko.
I'm seeing LAB, HYPE, and NEAR Protocol on the list, with market cap ranks #24, #10, and #33 respectively.
I think these tokens are worth watching, so I'm sharing them with you 📊.
$VIC, $EPIC , $LAB
I'm seeing LAB, HYPE, and NEAR Protocol on the list, with market cap ranks #24, #10, and #33 respectively.
I think these tokens are worth watching, so I'm sharing them with you 📊.
$VIC, $EPIC , $LAB

🔴 Scam #24: Clone websites trick Google results.
Scammers copy an entire exchange or DeFi site — identical design, URL one character off. You log in. They steal your credentials and 2FA codes.
Bookmark official sites. Never Google search for your exchange. Type the URL manually.
$ICP #Crypto #ScamAlert
Scammers copy an entire exchange or DeFi site — identical design, URL one character off. You log in. They steal your credentials and 2FA codes.
Bookmark official sites. Never Google search for your exchange. Type the URL manually.
$ICP #Crypto #ScamAlert
A price surge of ↑14.6% for $SUI in the past seven days, but its 30-day change is ↑19.6% — a slow, steady climb that hasn’t caught many eyes.
In the midst of a market where memecoins like $TLM are surging and others like PHB are cratering, SUI is quietly making its case. Its 7-day increase of ↑14.4% is matched by a 30-day rise of ↑19.6%, showing a trend that’s been building for months. Yet, its current price of $0.7703 and a funding rate of ↑0.0100% suggest a market that’s still in balance, not overbought — a rare combination.
The on-chain data doesn’t shout, but it doesn’t whisper either. There’s no dramatic shift in leverage or open interest, just a gradual move upward. This isn’t the kind of coin that makes headlines with a single day’s gain, but one that builds momentum over time.
—
Not financial advice. Crypto assets are high-risk; do your own research.
📌 Gainers Radar · #24
#Gainers #CryptoSighted $SUI
In the midst of a market where memecoins like $TLM are surging and others like PHB are cratering, SUI is quietly making its case. Its 7-day increase of ↑14.4% is matched by a 30-day rise of ↑19.6%, showing a trend that’s been building for months. Yet, its current price of $0.7703 and a funding rate of ↑0.0100% suggest a market that’s still in balance, not overbought — a rare combination.
The on-chain data doesn’t shout, but it doesn’t whisper either. There’s no dramatic shift in leverage or open interest, just a gradual move upward. This isn’t the kind of coin that makes headlines with a single day’s gain, but one that builds momentum over time.
—
Not financial advice. Crypto assets are high-risk; do your own research.
📌 Gainers Radar · #24
#Gainers #CryptoSighted $SUI

Beginner Series #24 : Binance Spot Wallet
One of the first things every Binance user should understand is the Spot Wallet. If you're buying cryptocurrency for the first time, this is where your digital assets will be stored.
What is a Binance Spot Wallet?
A Spot Wallet is your primary wallet on Binance. It holds the cryptocurrencies you buy through Spot Trading and allows you to manage your assets with ease.
What can you do with a Spot Wallet?
• Store cryptocurrencies securely on Binance.
• Buy and sell digital assets through Spot Trading.
• Deposit and withdraw crypto.
• Transfer assets to Funding, Earn, Margin, or Futures Wallets.
• Monitor your portfolio and available balances.
How to access your Spot Wallet
Log in to your Binance account.
Click Wallet.
Select Spot.
View all your available crypto assets and balances.
Beginner Tip
Your Spot Wallet is the foundation of your Binance journey. Before exploring advanced features like Futures or Margin Trading, make sure you understand how to manage funds in your Spot Wallet.
The better you understand your wallet, the more confident you'll become in managing your crypto portfolio.
#Binance #BinanceSquare #Crypto #Blockchain #SpotWallet #CryptoEducation #LearnCrypto #BinanceBeginners
One of the first things every Binance user should understand is the Spot Wallet. If you're buying cryptocurrency for the first time, this is where your digital assets will be stored.
What is a Binance Spot Wallet?
A Spot Wallet is your primary wallet on Binance. It holds the cryptocurrencies you buy through Spot Trading and allows you to manage your assets with ease.
What can you do with a Spot Wallet?
• Store cryptocurrencies securely on Binance.
• Buy and sell digital assets through Spot Trading.
• Deposit and withdraw crypto.
• Transfer assets to Funding, Earn, Margin, or Futures Wallets.
• Monitor your portfolio and available balances.
How to access your Spot Wallet
Log in to your Binance account.
Click Wallet.
Select Spot.
View all your available crypto assets and balances.
Beginner Tip
Your Spot Wallet is the foundation of your Binance journey. Before exploring advanced features like Futures or Margin Trading, make sure you understand how to manage funds in your Spot Wallet.
The better you understand your wallet, the more confident you'll become in managing your crypto portfolio.
#Binance #BinanceSquare #Crypto #Blockchain #SpotWallet #CryptoEducation #LearnCrypto #BinanceBeginners

Log in to explore more content