

CryptoMind学道
3.9k ပို့စ်များ

CryptoMind学道
တိုင်ကြားမည်
သုံးစွဲသူကို ဘလော့မည်
交易员 | Reading Liquidity, Flow & Structure | Spot • Futures • New Listings | BTC ETH BNB & Momentum Alts | Risk First

NVDAB Holder
Frequent Trader
2.7 Years
4 ဖော်လိုလုပ်ထားသည်
776 ဖော်လိုလုပ်သူများ
2.7K+ လိုက်ခ်လုပ်ထားသည်
ပို့စ်များ
အားလုံး
Quotes
·
--
Article
I Watched $113 Million in Shorts Get Wiped OutI woke up Sunday morning to a text from a friend. Short and blunt. "I'm out."
He’d been short Bitcoin since $84K, convinced the rally was fake. He wasn’t convinced anymore.
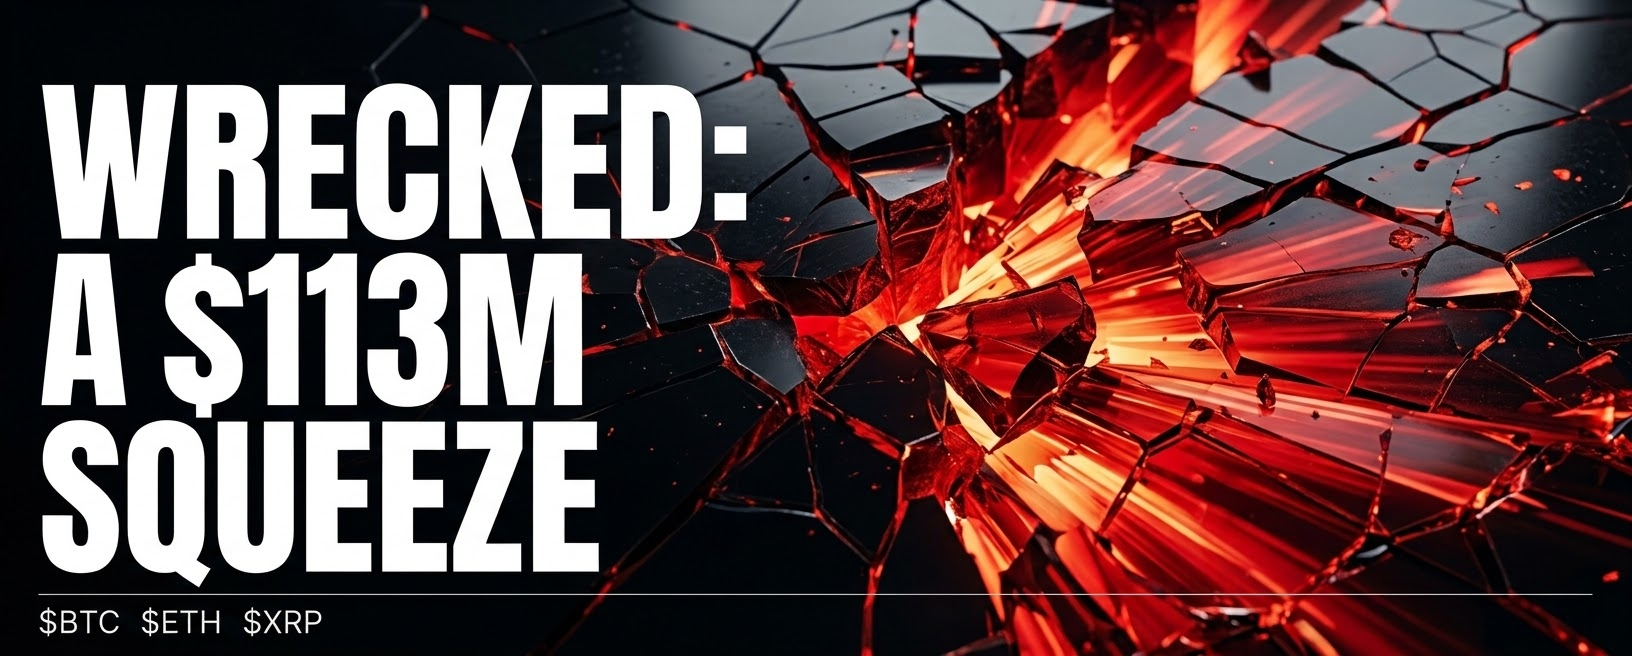
Over $113 million in short positions were forcibly closed in the 24 hours ending October 5. Total liquidations across crypto hit $138 million. Longs? Only $25 million. Shorts got wrecked at more than four times the rate.
42,225 traders liquidated. Bitcoin shorts alone accounted for $57 million of that pain. Ethereum shorts, another $24 million. The single largest casualty was a $5.63 million ETH short on Binance that never stood a chance.
I’ve been on that side before. Back in 2021, I shorted ETH at what I swore was the top. Funding was negative, everyone was bearish, it felt obvious. Then a single green candle took me out in under three minutes. I remember refreshing the page like the number would come back. It didn’t.
Here’s what actually happened.
Bitcoin pushed toward $87,000 early Monday, within $500 of an eight-month high. Then it reversed to just under $86,000. Still up 1.3% over 24 hours. But the move higher wasn’t clean. It was violent because of who was trapped.
The setup built quietly last week. Open interest on Bitcoin futures climbed by $2.3 billion. Funding rates tripled from roughly 3% to 10% as traders piled into longs ahead of the U.S. jobs report. When that report came in weaker than expected, rate-cut hopes kicked in and the rally accelerated. Shorts who bet against the move got steamrolled.
Here’s the part nobody’s saying.
Everyone’s calling this a bullish breakout. But Glassnode just flagged something more important. The largest liquidation cluster above current price sits at roughly $90,000. If Bitcoin reaches that level, a wall of leveraged shorts gets forced closed. That’s not organic buying. That’s a liquidation magnet.
And there’s a smaller cluster below at $83,000. Another at $75,000.
Whichever side gets hit first triggers the next violent move. That’s not a prediction. That’s positioning.
The ETF flows tell a different story than the price action. Bitcoin spot ETFs pulled in $241 million last week, their third straight week of positive flows. Ethereum ETFs bled $114 million. Bitcoin gets bought. Ethereum gets sold. That split matters.
Whales are doing the same thing. Over the past week, Bitcoin whales reduced holdings by 30,000 BTC — roughly $2.52 billion. Ethereum whales added 60,000 ETH. XRP whales stayed flat.
I’m not bearish. I’m just saying the people celebrating the squeeze might be early. The move was real. But real moves need a base to stand on. And right now, the base is thin.
The fear and greed index sits at 71. Greed. Up seven points from yesterday. When everyone’s greedy, the exits get crowded.
The level that matters now is $86,000. Bitcoin is hovering right around it. If it holds on a daily close, the shorts that just got liquidated will start rebuilding. They’ll cluster above $87,000 and $90,000. That’s the fuel for the next squeeze. If it breaks? The forced buying that drove this rally disappears. The same cascade that ripped shorts apart can run in reverse.
Liquidation cascades don’t tell you direction. They tell you positioning. And the positioning just got violently reset in one direction. Which means the other side is now crowded.
The market doesn’t care about your thesis. It cares about where the leverage is sitting. Right now, the leverage is sitting above. Waiting.
$BTC $ETH $XRP
#Bitcoin #Crypto #liquidation
If you got liquidated this weekend, did you learn something — or did you just get angry?
I Watched $113 Million in Shorts Get Wiped Out
I woke up Sunday morning to a text from a friend. Short and blunt. "I'm out."
He’d been short Bitcoin since $84K, convinced the rally was fake. He wasn’t convinced anymore.
Over $113 million in short positions were forcibly closed in the 24 hours ending October 5. Total liquidations across crypto hit $138 million. Longs? Only $25 million. Shorts got wrecked at more than four times the rate.
42,225 traders liquidated. Bitcoin shorts alone accounted for $57 million of that pain. Ethereum shorts, another $24 million. The single largest casualty was a $5.63 million ETH short on Binance that never stood a chance.
I’ve been on that side before. Back in 2021, I shorted ETH at what I swore was the top. Funding was negative, everyone was bearish, it felt obvious. Then a single green candle took me out in under three minutes. I remember refreshing the page like the number would come back. It didn’t.
Here’s what actually happened.
Bitcoin pushed toward $87,000 early Monday, within $500 of an eight-month high. Then it reversed to just under $86,000. Still up 1.3% over 24 hours. But the move higher wasn’t clean. It was violent because of who was trapped.
The setup built quietly last week. Open interest on Bitcoin futures climbed by $2.3 billion. Funding rates tripled from roughly 3% to 10% as traders piled into longs ahead of the U.S. jobs report. When that report came in weaker than expected, rate-cut hopes kicked in and the rally accelerated. Shorts who bet against the move got steamrolled.
Here’s the part nobody’s saying.
Everyone’s calling this a bullish breakout. But Glassnode just flagged something more important. The largest liquidation cluster above current price sits at roughly $90,000. If Bitcoin reaches that level, a wall of leveraged shorts gets forced closed. That’s not organic buying. That’s a liquidation magnet.
And there’s a smaller cluster below at $83,000. Another at $75,000.
Whichever side gets hit first triggers the next violent move. That’s not a prediction. That’s positioning.
The ETF flows tell a different story than the price action. Bitcoin spot ETFs pulled in $241 million last week, their third straight week of positive flows. Ethereum ETFs bled $114 million. Bitcoin gets bought. Ethereum gets sold. That split matters.
Whales are doing the same thing. Over the past week, Bitcoin whales reduced holdings by 30,000 BTC — roughly $2.52 billion. Ethereum whales added 60,000 ETH. XRP whales stayed flat.
I’m not bearish. I’m just saying the people celebrating the squeeze might be early. The move was real. But real moves need a base to stand on. And right now, the base is thin.
The fear and greed index sits at 71. Greed. Up seven points from yesterday. When everyone’s greedy, the exits get crowded.
The level that matters now is $86,000. Bitcoin is hovering right around it. If it holds on a daily close, the shorts that just got liquidated will start rebuilding. They’ll cluster above $87,000 and $90,000. That’s the fuel for the next squeeze. If it breaks? The forced buying that drove this rally disappears. The same cascade that ripped shorts apart can run in reverse.
Liquidation cascades don’t tell you direction. They tell you positioning. And the positioning just got violently reset in one direction. Which means the other side is now crowded.
The market doesn’t care about your thesis. It cares about where the leverage is sitting. Right now, the leverage is sitting above. Waiting.
$BTC $ETH $XRP
#Bitcoin #Crypto #liquidation
If you got liquidated this weekend, did you learn something — or did you just get angry?
He’d been short Bitcoin since $84K, convinced the rally was fake. He wasn’t convinced anymore.
Over $113 million in short positions were forcibly closed in the 24 hours ending October 5. Total liquidations across crypto hit $138 million. Longs? Only $25 million. Shorts got wrecked at more than four times the rate.
42,225 traders liquidated. Bitcoin shorts alone accounted for $57 million of that pain. Ethereum shorts, another $24 million. The single largest casualty was a $5.63 million ETH short on Binance that never stood a chance.
I’ve been on that side before. Back in 2021, I shorted ETH at what I swore was the top. Funding was negative, everyone was bearish, it felt obvious. Then a single green candle took me out in under three minutes. I remember refreshing the page like the number would come back. It didn’t.
Here’s what actually happened.
Bitcoin pushed toward $87,000 early Monday, within $500 of an eight-month high. Then it reversed to just under $86,000. Still up 1.3% over 24 hours. But the move higher wasn’t clean. It was violent because of who was trapped.
The setup built quietly last week. Open interest on Bitcoin futures climbed by $2.3 billion. Funding rates tripled from roughly 3% to 10% as traders piled into longs ahead of the U.S. jobs report. When that report came in weaker than expected, rate-cut hopes kicked in and the rally accelerated. Shorts who bet against the move got steamrolled.
Here’s the part nobody’s saying.
Everyone’s calling this a bullish breakout. But Glassnode just flagged something more important. The largest liquidation cluster above current price sits at roughly $90,000. If Bitcoin reaches that level, a wall of leveraged shorts gets forced closed. That’s not organic buying. That’s a liquidation magnet.
And there’s a smaller cluster below at $83,000. Another at $75,000.
Whichever side gets hit first triggers the next violent move. That’s not a prediction. That’s positioning.
The ETF flows tell a different story than the price action. Bitcoin spot ETFs pulled in $241 million last week, their third straight week of positive flows. Ethereum ETFs bled $114 million. Bitcoin gets bought. Ethereum gets sold. That split matters.
Whales are doing the same thing. Over the past week, Bitcoin whales reduced holdings by 30,000 BTC — roughly $2.52 billion. Ethereum whales added 60,000 ETH. XRP whales stayed flat.
I’m not bearish. I’m just saying the people celebrating the squeeze might be early. The move was real. But real moves need a base to stand on. And right now, the base is thin.
The fear and greed index sits at 71. Greed. Up seven points from yesterday. When everyone’s greedy, the exits get crowded.
The level that matters now is $86,000. Bitcoin is hovering right around it. If it holds on a daily close, the shorts that just got liquidated will start rebuilding. They’ll cluster above $87,000 and $90,000. That’s the fuel for the next squeeze. If it breaks? The forced buying that drove this rally disappears. The same cascade that ripped shorts apart can run in reverse.
Liquidation cascades don’t tell you direction. They tell you positioning. And the positioning just got violently reset in one direction. Which means the other side is now crowded.
The market doesn’t care about your thesis. It cares about where the leverage is sitting. Right now, the leverage is sitting above. Waiting.
$BTC $ETH $XRP
#Bitcoin #Crypto #liquidation
If you got liquidated this weekend, did you learn something — or did you just get angry?
11
·
--
Good Morning Everyone... 👀 Ptofit Done ✅
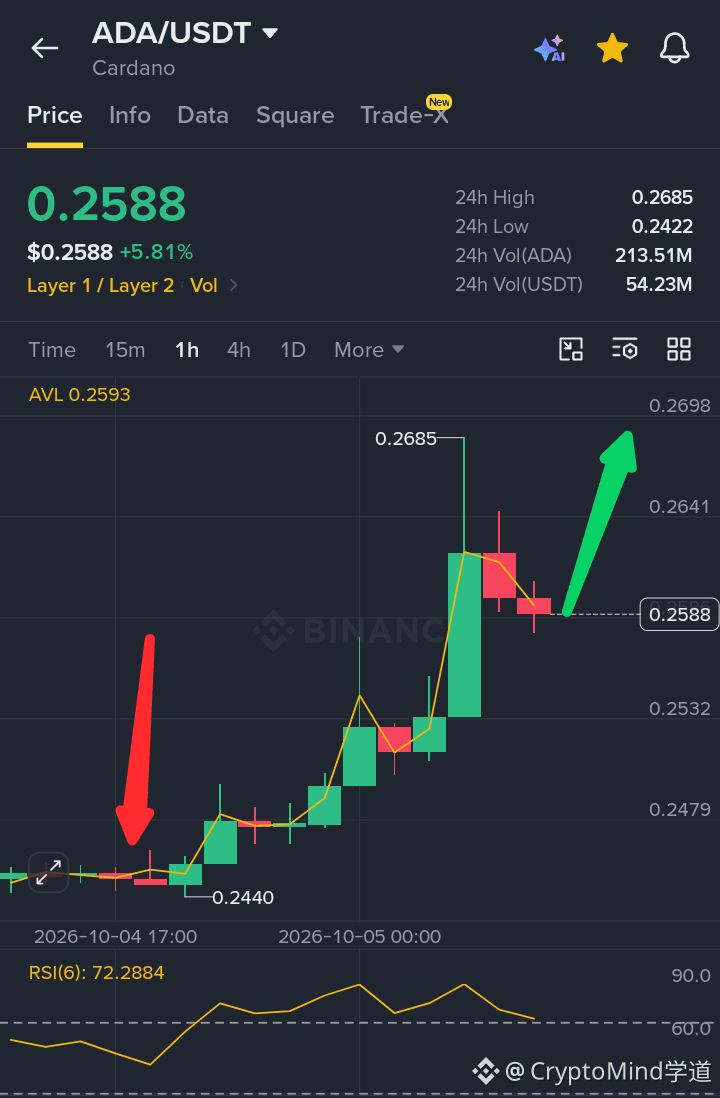
Whales now hold 67.5% of the circulating $ADA supply, a six-year high. That's the real story behind this candle.
Price is up 5.81% to $0.2588, but RSI at 72 means don't chase. I'm waiting for a pullback to the $0.24–0.25 support zone before adding. Targets are $0.28 then $0.32. A daily close below $0.23 kills the setup.
The x402 AI payments integration gives $ADA a real utility bid beyond staking.
Does whale accumulation actually signal conviction, or just passive staking rewards with nowhere else to go?
{spot}(ADAUSDT)
Good Morning Everyone... 👀 Ptofit Done ✅
Whales now hold 67.5% of the circulating $ADA supply, a six-year high. That's the real story behind this candle.
Price is up 5.81% to $0.2588, but RSI at 72 means don't chase. I'm waiting for a pullback to the $0.24–0.25 support zone before adding. Targets are $0.28 then $0.32. A daily close below $0.23 kills the setup.
The x402 AI payments integration gives $ADA a real utility bid beyond staking.
Does whale accumulation actually signal conviction, or just passive staking rewards with nowhere else to go?
Whales now hold 67.5% of the circulating $ADA supply, a six-year high. That's the real story behind this candle.
Price is up 5.81% to $0.2588, but RSI at 72 means don't chase. I'm waiting for a pullback to the $0.24–0.25 support zone before adding. Targets are $0.28 then $0.32. A daily close below $0.23 kills the setup.
The x402 AI payments integration gives $ADA a real utility bid beyond staking.
Does whale accumulation actually signal conviction, or just passive staking rewards with nowhere else to go?
1
78
·
--

Article
Six Weeks Of Climbing, And The Room Still Wants More$NEAR has been climbing for six straight weeks. From 1.538 in mid-August to a peak at 5.578.
Then it pulled back. And the pullback didn't give back much.
Current print sits at 4.961, up 4.73% on the day. 24-hour range is 4.717 to 5.050. Tight box, and price is pressing the top of it.
Here's what I'm watching.
The move to 5.578 got rejected. Price slid back. Now it's grinding up again into 5.050 without panic and without losing the 4.717 floor.
Two failed pushes at a ceiling usually mean sellers are parked there. One clean floor that holds usually means they're not parked deep enough.
The tape is arguing with itself.
RSI on the 4-hour sits at 69. That's warm. It hit 90 earlier in this climb, so there's room — but another push into resistance without cooling off invites a fade.
Volume over 24 hours: 17.86M NEAR, 86.83M USDT. Real participation. Nobody is drifting this market on thin air.
Here's what I keep coming back to. A six-week advance that never fully unwound means longs have been holding, not scalping. Held longs are fuel. They fund the next leg when they're right, and they deepen the drop when they're wrong.
I've been the guy holding through a pullback telling myself it was healthy. Watched a 40% winner turn into a 15% loser. That's why I watch the floor more than the ceiling now.
Above 5.050 and I'm watching 5.578 first, then 5.780.
Lose 4.717 and I'm done. No second conversation.
The kill level matters more than the targets. A break of 4.717 puts price below every higher low since August. That changes the entire character of the trade.
Until then, the burden of proof sits on sellers. They haven't met it.
$NEAR $BTC
Are you holding through the next test, or waiting for the floor to prove itself?
Six Weeks Of Climbing, And The Room Still Wants More
$NEAR has been climbing for six straight weeks. From 1.538 in mid-August to a peak at 5.578.
Then it pulled back. And the pullback didn't give back much.
Current print sits at 4.961, up 4.73% on the day. 24-hour range is 4.717 to 5.050. Tight box, and price is pressing the top of it.
Here's what I'm watching.
The move to 5.578 got rejected. Price slid back. Now it's grinding up again into 5.050 without panic and without losing the 4.717 floor.
Two failed pushes at a ceiling usually mean sellers are parked there. One clean floor that holds usually means they're not parked deep enough.
The tape is arguing with itself.
RSI on the 4-hour sits at 69. That's warm. It hit 90 earlier in this climb, so there's room — but another push into resistance without cooling off invites a fade.
Volume over 24 hours: 17.86M NEAR, 86.83M USDT. Real participation. Nobody is drifting this market on thin air.
Here's what I keep coming back to. A six-week advance that never fully unwound means longs have been holding, not scalping. Held longs are fuel. They fund the next leg when they're right, and they deepen the drop when they're wrong.
I've been the guy holding through a pullback telling myself it was healthy. Watched a 40% winner turn into a 15% loser. That's why I watch the floor more than the ceiling now.
Above 5.050 and I'm watching 5.578 first, then 5.780.
Lose 4.717 and I'm done. No second conversation.
The kill level matters more than the targets. A break of 4.717 puts price below every higher low since August. That changes the entire character of the trade.
Until then, the burden of proof sits on sellers. They haven't met it.
$NEAR $BTC
Are you holding through the next test, or waiting for the floor to prove itself?
Then it pulled back. And the pullback didn't give back much.
Current print sits at 4.961, up 4.73% on the day. 24-hour range is 4.717 to 5.050. Tight box, and price is pressing the top of it.
Here's what I'm watching.
The move to 5.578 got rejected. Price slid back. Now it's grinding up again into 5.050 without panic and without losing the 4.717 floor.
Two failed pushes at a ceiling usually mean sellers are parked there. One clean floor that holds usually means they're not parked deep enough.
The tape is arguing with itself.
RSI on the 4-hour sits at 69. That's warm. It hit 90 earlier in this climb, so there's room — but another push into resistance without cooling off invites a fade.
Volume over 24 hours: 17.86M NEAR, 86.83M USDT. Real participation. Nobody is drifting this market on thin air.
Here's what I keep coming back to. A six-week advance that never fully unwound means longs have been holding, not scalping. Held longs are fuel. They fund the next leg when they're right, and they deepen the drop when they're wrong.
I've been the guy holding through a pullback telling myself it was healthy. Watched a 40% winner turn into a 15% loser. That's why I watch the floor more than the ceiling now.
Above 5.050 and I'm watching 5.578 first, then 5.780.
Lose 4.717 and I'm done. No second conversation.
The kill level matters more than the targets. A break of 4.717 puts price below every higher low since August. That changes the entire character of the trade.
Until then, the burden of proof sits on sellers. They haven't met it.
$NEAR $BTC
Are you holding through the next test, or waiting for the floor to prove itself?
21
·
--
𝗚𝗼𝘁 𝘄𝗿𝗲𝗰𝗸𝗲𝗱 𝗼𝗻 𝗮 𝘀𝗽𝗶𝗸𝗲 𝗹𝗶𝗸𝗲 𝘁𝗵𝗶𝘀 𝗹𝗮𝘀𝘁 𝗺𝗼𝗻𝘁𝗵, 𝘀𝗼 𝗜'𝗺 𝗻𝗼𝘁 𝗰𝗵𝗮𝘀𝗶𝗻𝗴 𝗶𝘁
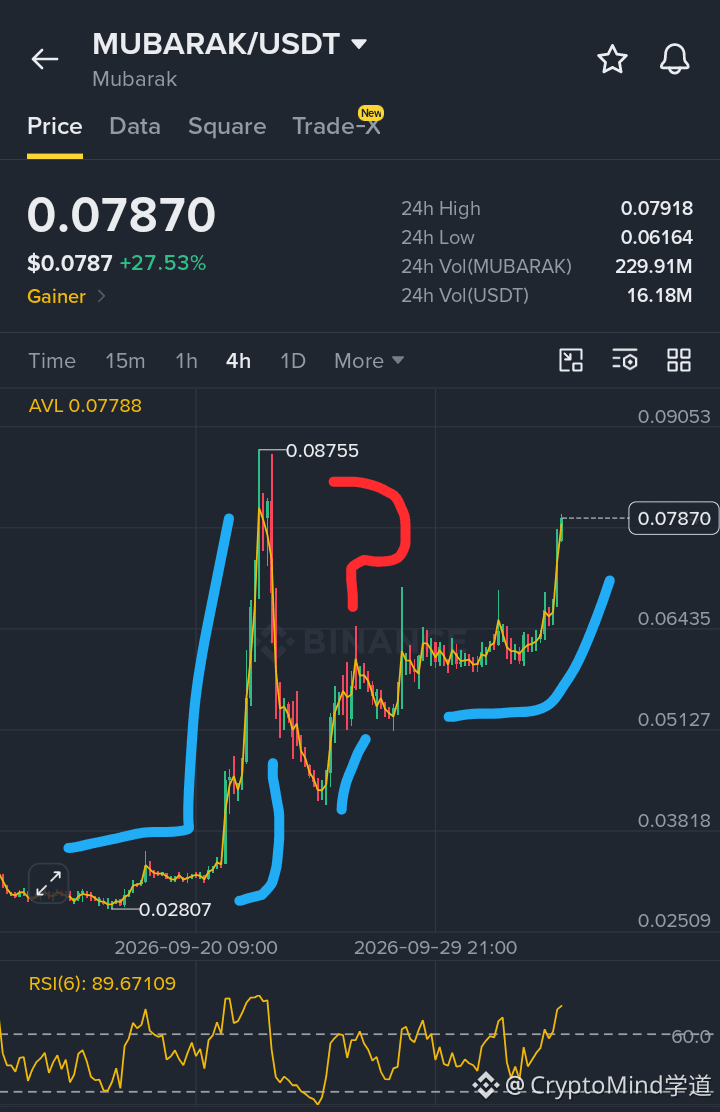
$MUBARAK ran 27% in a day with RSI(6) near 90 That's usually where I get greedy and regret it. I'm waiting for a pullback and only looking long between 0.066 and 0.070. Targets are 0.0792 first, then 0.0875 where it got rejected before. Stop under 0.0610, below the daily low
3x max on this. Thin alts like $MUBARAK wick through stops fast, and funding is probably heating up, so check it before you enter
Honestly, not sure it even dips
{future}(MUBARAKUSDT)
#EthereumValidatorExitQueueJumps392% #SECHaltsCryptoETFReviewsAmidFundingLapse #FedOctoberRateHikeOddsFallTo17% #GreekPoliceBustCryptoScamRingArrest17 #MUBARAK $LUNC
𝗚𝗼𝘁 𝘄𝗿𝗲𝗰𝗸𝗲𝗱 𝗼𝗻 𝗮 𝘀𝗽𝗶𝗸𝗲 𝗹𝗶𝗸𝗲 𝘁𝗵𝗶𝘀 𝗹𝗮𝘀𝘁 𝗺𝗼𝗻𝘁𝗵, 𝘀𝗼 𝗜'𝗺 𝗻𝗼𝘁 𝗰𝗵𝗮𝘀𝗶𝗻𝗴 𝗶𝘁
$MUBARAK ran 27% in a day with RSI(6) near 90 That's usually where I get greedy and regret it. I'm waiting for a pullback and only looking long between 0.066 and 0.070. Targets are 0.0792 first, then 0.0875 where it got rejected before. Stop under 0.0610, below the daily low
3x max on this. Thin alts like $MUBARAK wick through stops fast, and funding is probably heating up, so check it before you enter
Honestly, not sure it even dips
#EthereumValidatorExitQueueJumps392% #SECHaltsCryptoETFReviewsAmidFundingLapse #FedOctoberRateHikeOddsFallTo17% #GreekPoliceBustCryptoScamRingArrest17 #MUBARAK $LUNC
$MUBARAK ran 27% in a day with RSI(6) near 90 That's usually where I get greedy and regret it. I'm waiting for a pullback and only looking long between 0.066 and 0.070. Targets are 0.0792 first, then 0.0875 where it got rejected before. Stop under 0.0610, below the daily low
3x max on this. Thin alts like $MUBARAK wick through stops fast, and funding is probably heating up, so check it before you enter
Honestly, not sure it even dips
#EthereumValidatorExitQueueJumps392% #SECHaltsCryptoETFReviewsAmidFundingLapse #FedOctoberRateHikeOddsFallTo17% #GreekPoliceBustCryptoScamRingArrest17 #MUBARAK $LUNC
24
·
--
The smart money isn't choosing sides; it's building a barbell
Looking at the latest on-chain data, a clear narrative of capital efficiency is emerging. Ethereum remains the undisputed institutional anchor, commanding over $404B in bridged TVL with a steady 7% monthly growth rate. It is the bedrock of security and deep liquidity
Conversely, Solana is capturing the market's tactical appetite. With a 13% monthly TVL expansion, it's evident that traders are aggressively rotating capital toward high-velocity ecosystems. This divergence isn't a zero-sum game—it's a sophisticated rotation between stability and momentum
As we navigate this liquidity bifurcation, how are you balancing your portfolio between Ethereum's security and Solana's velocity?
$ETH $SOL #Crypto #defi #Ethereum #solana
The smart money isn't choosing sides; it's building a barbell
Looking at the latest on-chain data, a clear narrative of capital efficiency is emerging. Ethereum remains the undisputed institutional anchor, commanding over $404B in bridged TVL with a steady 7% monthly growth rate. It is the bedrock of security and deep liquidity
Conversely, Solana is capturing the market's tactical appetite. With a 13% monthly TVL expansion, it's evident that traders are aggressively rotating capital toward high-velocity ecosystems. This divergence isn't a zero-sum game—it's a sophisticated rotation between stability and momentum
As we navigate this liquidity bifurcation, how are you balancing your portfolio between Ethereum's security and Solana's velocity?
$ETH $SOL #Crypto #defi #Ethereum #solana
Looking at the latest on-chain data, a clear narrative of capital efficiency is emerging. Ethereum remains the undisputed institutional anchor, commanding over $404B in bridged TVL with a steady 7% monthly growth rate. It is the bedrock of security and deep liquidity
Conversely, Solana is capturing the market's tactical appetite. With a 13% monthly TVL expansion, it's evident that traders are aggressively rotating capital toward high-velocity ecosystems. This divergence isn't a zero-sum game—it's a sophisticated rotation between stability and momentum
As we navigate this liquidity bifurcation, how are you balancing your portfolio between Ethereum's security and Solana's velocity?
$ETH $SOL #Crypto #defi #Ethereum #solana

1
62
·
--
🚨 XTZ IS GETTING LOUDER… 👀
$XTZ is up 4.7% in 24H with 362K+ social engagements. 📈
That kind of attention can fuel momentum, but it can also create a sharp fakeout.
🔥 Buyers pushing higher? 🛑 Or is this the setup before a pullback?
Watch $XTZ closely. Social hype is rising fast. 👀
#xtz #Tezos #Crypto #altcoins #Binance $ZEC
{future}(XTZUSDT)
🚨 XTZ IS GETTING LOUDER… 👀
$XTZ is up 4.7% in 24H with 362K+ social engagements. 📈
That kind of attention can fuel momentum, but it can also create a sharp fakeout.
🔥 Buyers pushing higher? 🛑 Or is this the setup before a pullback?
Watch $XTZ closely. Social hype is rising fast. 👀
#xtz #Tezos #Crypto #altcoins #Binance $ZEC
$XTZ is up 4.7% in 24H with 362K+ social engagements. 📈
That kind of attention can fuel momentum, but it can also create a sharp fakeout.
🔥 Buyers pushing higher? 🛑 Or is this the setup before a pullback?
Watch $XTZ closely. Social hype is rising fast. 👀
#xtz #Tezos #Crypto #altcoins #Binance $ZEC
1️⃣ Bullish breakout 🚀
2️⃣ Fakeout incoming 🐻
10 နာရီ ကျန်သေးသည်
1
17
·
--
🚨 BITCOIN HOLDS $85K! Is a Massive Breakout Incoming? 🚀
The crypto market is showing incredible strength right now! Bitcoin $BTC is firmly sustaining its position around the $85,199 level. Traders are heavily leaning bullish, and if this key support holds, we might be looking at the next big leg up very soon! 📈
Meanwhile, on the altcoin front, social media data is exploding for $TRUMP It has clocked a massive 737K+ social engagements in the last 24 hours alone, making it one of the most talked-about assets today. 🤯 When social volume spikes like this, expect some heavy volatility ahead!
What is your move? 👇
Will BTC smash through $88K this week, or are we due for a short-term correction? Let me know your predictions in the comments below!
{future}(TRUMPUSDT)
{future}(BTCUSDT)
#Bitcoin #TRUMP #CryptoNews #TradingUpdates #Crypto
🚨 BITCOIN HOLDS $85K! Is a Massive Breakout Incoming? 🚀
The crypto market is showing incredible strength right now! Bitcoin $BTC is firmly sustaining its position around the $85,199 level. Traders are heavily leaning bullish, and if this key support holds, we might be looking at the next big leg up very soon! 📈
Meanwhile, on the altcoin front, social media data is exploding for $TRUMP It has clocked a massive 737K+ social engagements in the last 24 hours alone, making it one of the most talked-about assets today. 🤯 When social volume spikes like this, expect some heavy volatility ahead!
What is your move? 👇
Will BTC smash through $88K this week, or are we due for a short-term correction? Let me know your predictions in the comments below!
#Bitcoin #TRUMP #CryptoNews #TradingUpdates #Crypto
The crypto market is showing incredible strength right now! Bitcoin $BTC is firmly sustaining its position around the $85,199 level. Traders are heavily leaning bullish, and if this key support holds, we might be looking at the next big leg up very soon! 📈
Meanwhile, on the altcoin front, social media data is exploding for $TRUMP It has clocked a massive 737K+ social engagements in the last 24 hours alone, making it one of the most talked-about assets today. 🤯 When social volume spikes like this, expect some heavy volatility ahead!
What is your move? 👇
Will BTC smash through $88K this week, or are we due for a short-term correction? Let me know your predictions in the comments below!
#Bitcoin #TRUMP #CryptoNews #TradingUpdates #Crypto
Smash $88K! 🚀
Short-term Drop 📉
9 နာရီ ကျန်သေးသည်
1
67
·
--
Article
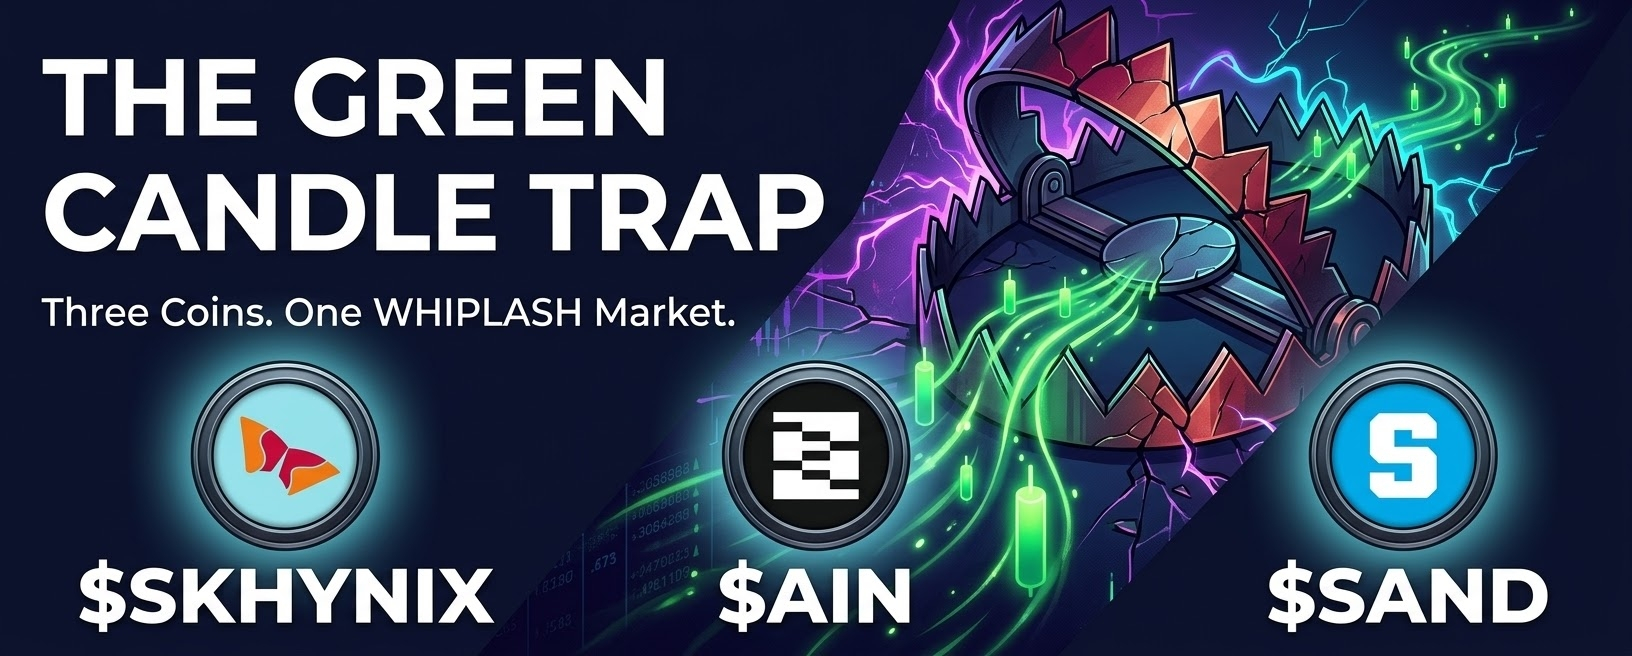
Every Time I Chase A Green Candle, I Hand My Wallet To Someone ElseThe first thing I noticed wasn't a price. It was the whiplash. One of these charts ran from 0.019 to 0.217 in a single session, then gave almost all of it back before most people finished their coffee.
That's the tape. It doesn't reward urgency. It punishes it. I've been on the wrong side of that exact candle more times than I care to count.
$SKHYNIX is the first one. This is the AI memory play that came to market with a $26.5 billion Nasdaq listing, the largest ever by a foreign company. The tape has been a slow climb from 976 to a high of 1,439, and it's now sitting around 1,373.
Funding is essentially neutral at 0.0000% on most venues. Open interest on Hyperliquid alone was over $571 million earlier this year, with Binance another $501 million. That's a lot of leveraged money sitting in this name. The headline is the Intel partnership talks. If that translates into a manufacturing deal at Intel's Ohio complex, it changes the US supply chain story.
The level that matters is $1,439. A clean break above it opens the door toward $1,600. Lose $1,232 and the bid thins out.
Above $1,439 and I'm watching $1,600 first, then $1,750. Lose $1,232 and I'm done. I've held a slow grinder too long before, watching a solid gain turn into a round trip because I got bored and stopped paying attention.
{future}(SKHYNIXUSDT)
$AIN is the second chart. And this one is a different beast entirely. It ran from 0.019 to 0.217 in a single session, then got absolutely crushed back to 0.055. That's a 90% swing in both directions.
Funding is positive at 0.3069% on KuCoin. That's not a typo. Longs are paying shorts nearly a third of a percent every eight hours. That's the market telling you the crowd is leaning one way, hard. The headline is the brand evolution plan, a ticker replacement that doesn't change the contract or tokenomics.
The level that matters is $0.217. That's the high from the spike. A clean reclaim opens the door toward $0.25. Lose $0.055 and the bid disappears.
Above $0.217 and I'm watching $0.25 first, then $0.30. Lose $0.055 and I'm out. I once held a ticker-change "catalyst" all the way to zero because I thought a rebrand meant a new product. It didn't.
{future}(AINUSDT)
$SAND is the third chart. This is the quietest of the three, but the headline is the cleanest. Upbit and Bithumb removed the "trading caution" label on October 2, and the token ripped 53% in a day. The tape shows a move from 0.032 to a high of 0.084, and it's now sitting around 0.076.
Funding is neutral at 0.0019% on KuCoin. Open interest is around $23.8 million. That's not a crowded trade. The volume is there, but the leverage isn't stretched. The level that matters is $0.084. A clean break above it opens the door toward $0.095. Lose $0.072 and the bid thins out.
Above $0.084 and I'm watching $0.095 first, then $0.11. Lose $0.072 and I'm out.
{future}(SANDUSDT)
The wider market matters here. Bitcoin is holding near $84,000 after tapping $87,000. Dominance is around 58.7%, still below the 60% line that would signal a full risk-off rotation. The Altcoin Season Index is at 61 out of 100, up from 23 a month ago. Still below the 75 threshold, but the direction is clear.
Open interest across crypto perps is elevated. The crowd is leaning into new listings and narrative plays. Where I could be wrong is if Bitcoin dominance reclaims 60% and this rotation stalls. Then the late longs get paid and these breakouts fail.
I've been on the wrong side of a "confirmed breakout" before. The chart looked perfect, every box checked, and then the bid vanished. That's why I don't trust a wick at the high.
The levels are the levels. The tape will tell you which ones matter.
Are you a trader, or are you a spectator?
Every Time I Chase A Green Candle, I Hand My Wallet To Someone Else
The first thing I noticed wasn't a price. It was the whiplash. One of these charts ran from 0.019 to 0.217 in a single session, then gave almost all of it back before most people finished their coffee.
That's the tape. It doesn't reward urgency. It punishes it. I've been on the wrong side of that exact candle more times than I care to count.
$SKHYNIX is the first one. This is the AI memory play that came to market with a $26.5 billion Nasdaq listing, the largest ever by a foreign company. The tape has been a slow climb from 976 to a high of 1,439, and it's now sitting around 1,373.
Funding is essentially neutral at 0.0000% on most venues. Open interest on Hyperliquid alone was over $571 million earlier this year, with Binance another $501 million. That's a lot of leveraged money sitting in this name. The headline is the Intel partnership talks. If that translates into a manufacturing deal at Intel's Ohio complex, it changes the US supply chain story.
The level that matters is $1,439. A clean break above it opens the door toward $1,600. Lose $1,232 and the bid thins out.
Above $1,439 and I'm watching $1,600 first, then $1,750. Lose $1,232 and I'm done. I've held a slow grinder too long before, watching a solid gain turn into a round trip because I got bored and stopped paying attention.
$AIN is the second chart. And this one is a different beast entirely. It ran from 0.019 to 0.217 in a single session, then got absolutely crushed back to 0.055. That's a 90% swing in both directions.
Funding is positive at 0.3069% on KuCoin. That's not a typo. Longs are paying shorts nearly a third of a percent every eight hours. That's the market telling you the crowd is leaning one way, hard. The headline is the brand evolution plan, a ticker replacement that doesn't change the contract or tokenomics.
The level that matters is $0.217. That's the high from the spike. A clean reclaim opens the door toward $0.25. Lose $0.055 and the bid disappears.
Above $0.217 and I'm watching $0.25 first, then $0.30. Lose $0.055 and I'm out. I once held a ticker-change "catalyst" all the way to zero because I thought a rebrand meant a new product. It didn't.
$SAND is the third chart. This is the quietest of the three, but the headline is the cleanest. Upbit and Bithumb removed the "trading caution" label on October 2, and the token ripped 53% in a day. The tape shows a move from 0.032 to a high of 0.084, and it's now sitting around 0.076.
Funding is neutral at 0.0019% on KuCoin. Open interest is around $23.8 million. That's not a crowded trade. The volume is there, but the leverage isn't stretched. The level that matters is $0.084. A clean break above it opens the door toward $0.095. Lose $0.072 and the bid thins out.
Above $0.084 and I'm watching $0.095 first, then $0.11. Lose $0.072 and I'm out.
The wider market matters here. Bitcoin is holding near $84,000 after tapping $87,000. Dominance is around 58.7%, still below the 60% line that would signal a full risk-off rotation. The Altcoin Season Index is at 61 out of 100, up from 23 a month ago. Still below the 75 threshold, but the direction is clear.
Open interest across crypto perps is elevated. The crowd is leaning into new listings and narrative plays. Where I could be wrong is if Bitcoin dominance reclaims 60% and this rotation stalls. Then the late longs get paid and these breakouts fail.
I've been on the wrong side of a "confirmed breakout" before. The chart looked perfect, every box checked, and then the bid vanished. That's why I don't trust a wick at the high.
The levels are the levels. The tape will tell you which ones matter.
Are you a trader, or are you a spectator?
That's the tape. It doesn't reward urgency. It punishes it. I've been on the wrong side of that exact candle more times than I care to count.
$SKHYNIX is the first one. This is the AI memory play that came to market with a $26.5 billion Nasdaq listing, the largest ever by a foreign company. The tape has been a slow climb from 976 to a high of 1,439, and it's now sitting around 1,373.
Funding is essentially neutral at 0.0000% on most venues. Open interest on Hyperliquid alone was over $571 million earlier this year, with Binance another $501 million. That's a lot of leveraged money sitting in this name. The headline is the Intel partnership talks. If that translates into a manufacturing deal at Intel's Ohio complex, it changes the US supply chain story.
The level that matters is $1,439. A clean break above it opens the door toward $1,600. Lose $1,232 and the bid thins out.
Above $1,439 and I'm watching $1,600 first, then $1,750. Lose $1,232 and I'm done. I've held a slow grinder too long before, watching a solid gain turn into a round trip because I got bored and stopped paying attention.
$AIN is the second chart. And this one is a different beast entirely. It ran from 0.019 to 0.217 in a single session, then got absolutely crushed back to 0.055. That's a 90% swing in both directions.
Funding is positive at 0.3069% on KuCoin. That's not a typo. Longs are paying shorts nearly a third of a percent every eight hours. That's the market telling you the crowd is leaning one way, hard. The headline is the brand evolution plan, a ticker replacement that doesn't change the contract or tokenomics.
The level that matters is $0.217. That's the high from the spike. A clean reclaim opens the door toward $0.25. Lose $0.055 and the bid disappears.
Above $0.217 and I'm watching $0.25 first, then $0.30. Lose $0.055 and I'm out. I once held a ticker-change "catalyst" all the way to zero because I thought a rebrand meant a new product. It didn't.
$SAND is the third chart. This is the quietest of the three, but the headline is the cleanest. Upbit and Bithumb removed the "trading caution" label on October 2, and the token ripped 53% in a day. The tape shows a move from 0.032 to a high of 0.084, and it's now sitting around 0.076.
Funding is neutral at 0.0019% on KuCoin. Open interest is around $23.8 million. That's not a crowded trade. The volume is there, but the leverage isn't stretched. The level that matters is $0.084. A clean break above it opens the door toward $0.095. Lose $0.072 and the bid thins out.
Above $0.084 and I'm watching $0.095 first, then $0.11. Lose $0.072 and I'm out.
The wider market matters here. Bitcoin is holding near $84,000 after tapping $87,000. Dominance is around 58.7%, still below the 60% line that would signal a full risk-off rotation. The Altcoin Season Index is at 61 out of 100, up from 23 a month ago. Still below the 75 threshold, but the direction is clear.
Open interest across crypto perps is elevated. The crowd is leaning into new listings and narrative plays. Where I could be wrong is if Bitcoin dominance reclaims 60% and this rotation stalls. Then the late longs get paid and these breakouts fail.
I've been on the wrong side of a "confirmed breakout" before. The chart looked perfect, every box checked, and then the bid vanished. That's why I don't trust a wick at the high.
The levels are the levels. The tape will tell you which ones matter.
Are you a trader, or are you a spectator?
232
·
--
တက်ရိပ်ရှိသည်
Chasing this candle is how you get trapped
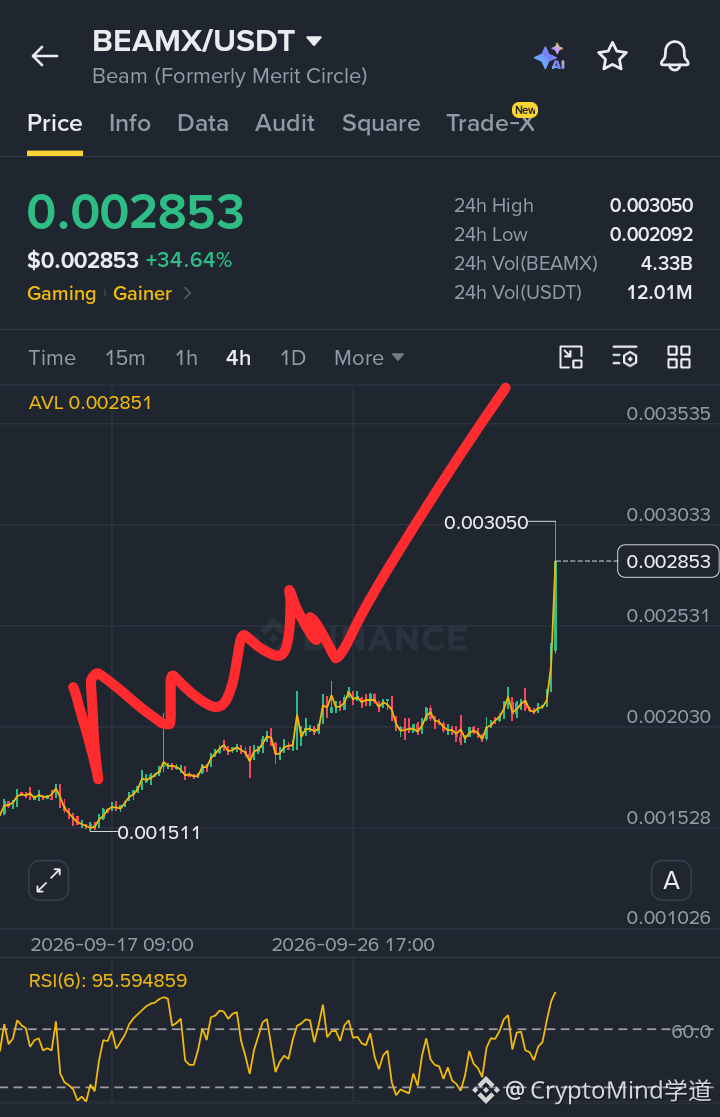
$BEAMX just ran from 0.001511 to 0.003050 without a pause. The RSI is sitting at 95. I've been the exit liquidity on moves like this plenty of times.
Buy Zone: 0.002400 - 0.002700
TP1: 0.003050
TP2: 0.003600
Invalidation: 0.002000
I'll let $BEAMX cool off and come to me, not the other way around
Are you buying this $BEAMX breakout or waiting for the pullback? Follow for elite spot setups
{spot}(BEAMXUSDT)
Chasing this candle is how you get trapped
$BEAMX just ran from 0.001511 to 0.003050 without a pause. The RSI is sitting at 95. I've been the exit liquidity on moves like this plenty of times.
Buy Zone: 0.002400 - 0.002700
TP1: 0.003050
TP2: 0.003600
Invalidation: 0.002000
I'll let $BEAMX cool off and come to me, not the other way around
Are you buying this $BEAMX breakout or waiting for the pullback? Follow for elite spot setups
$BEAMX just ran from 0.001511 to 0.003050 without a pause. The RSI is sitting at 95. I've been the exit liquidity on moves like this plenty of times.
Buy Zone: 0.002400 - 0.002700
TP1: 0.003050
TP2: 0.003600
Invalidation: 0.002000
I'll let $BEAMX cool off and come to me, not the other way around
Are you buying this $BEAMX breakout or waiting for the pullback? Follow for elite spot setups
96
·
--
ကျရိပ်ရှိသည်
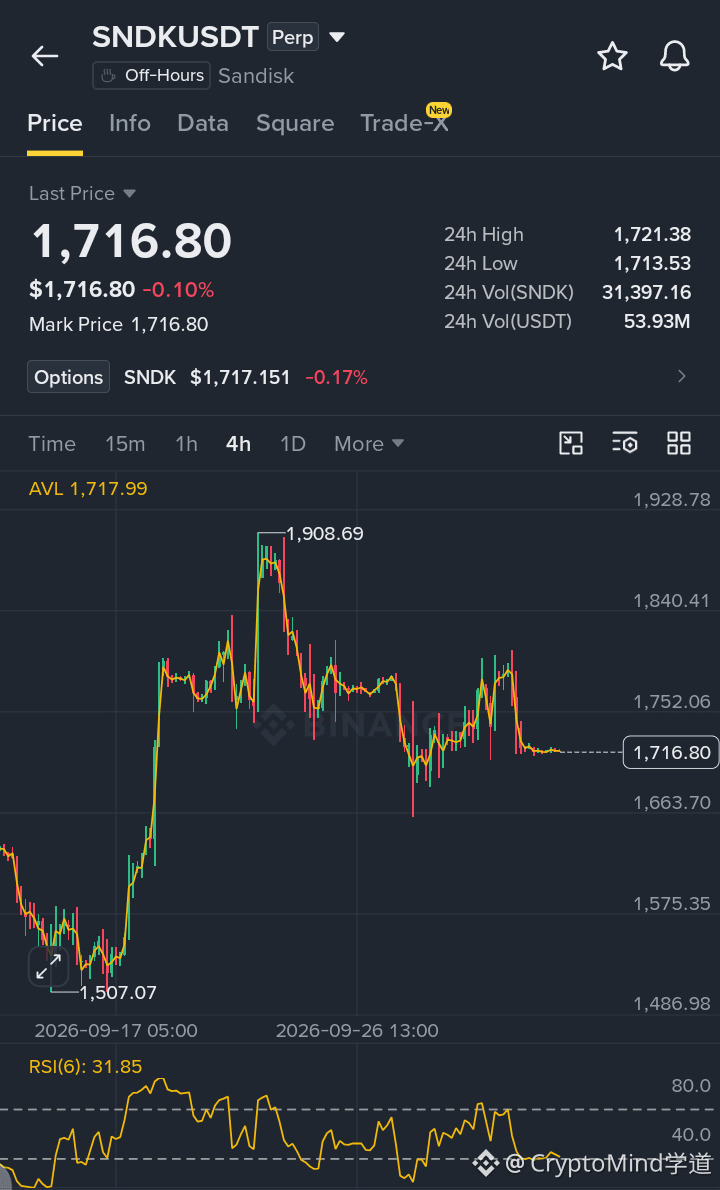
Lost 1,800. RSI 31.85. Structure's broken. 📉
🔴 Short $SNDK
🚪 Entry 1716.80
💰 Targets 1650.00, 1580.00
🛑 Stop 1760.00
Which level matters most to you?
{future}(SNDKUSDT)
Lost 1,800. RSI 31.85. Structure's broken. 📉
🔴 Short $SNDK
🚪 Entry 1716.80
💰 Targets 1650.00, 1580.00
🛑 Stop 1760.00
Which level matters most to you?
🔴 Short $SNDK
🚪 Entry 1716.80
💰 Targets 1650.00, 1580.00
🛑 Stop 1760.00
Which level matters most to you?
79
·
--
Article
I Watched $806 Million Vanish OvernightI was about to close my laptop Thursday night when the alert hit. Bitcoin had just touched $87,200. Ten minutes later it was under $84,000. I sat back down.
A friend called me at 11 p.m. His voice was different. He’d been long since $82K, leveraged, feeling smart. He wasn’t feeling smart anymore.
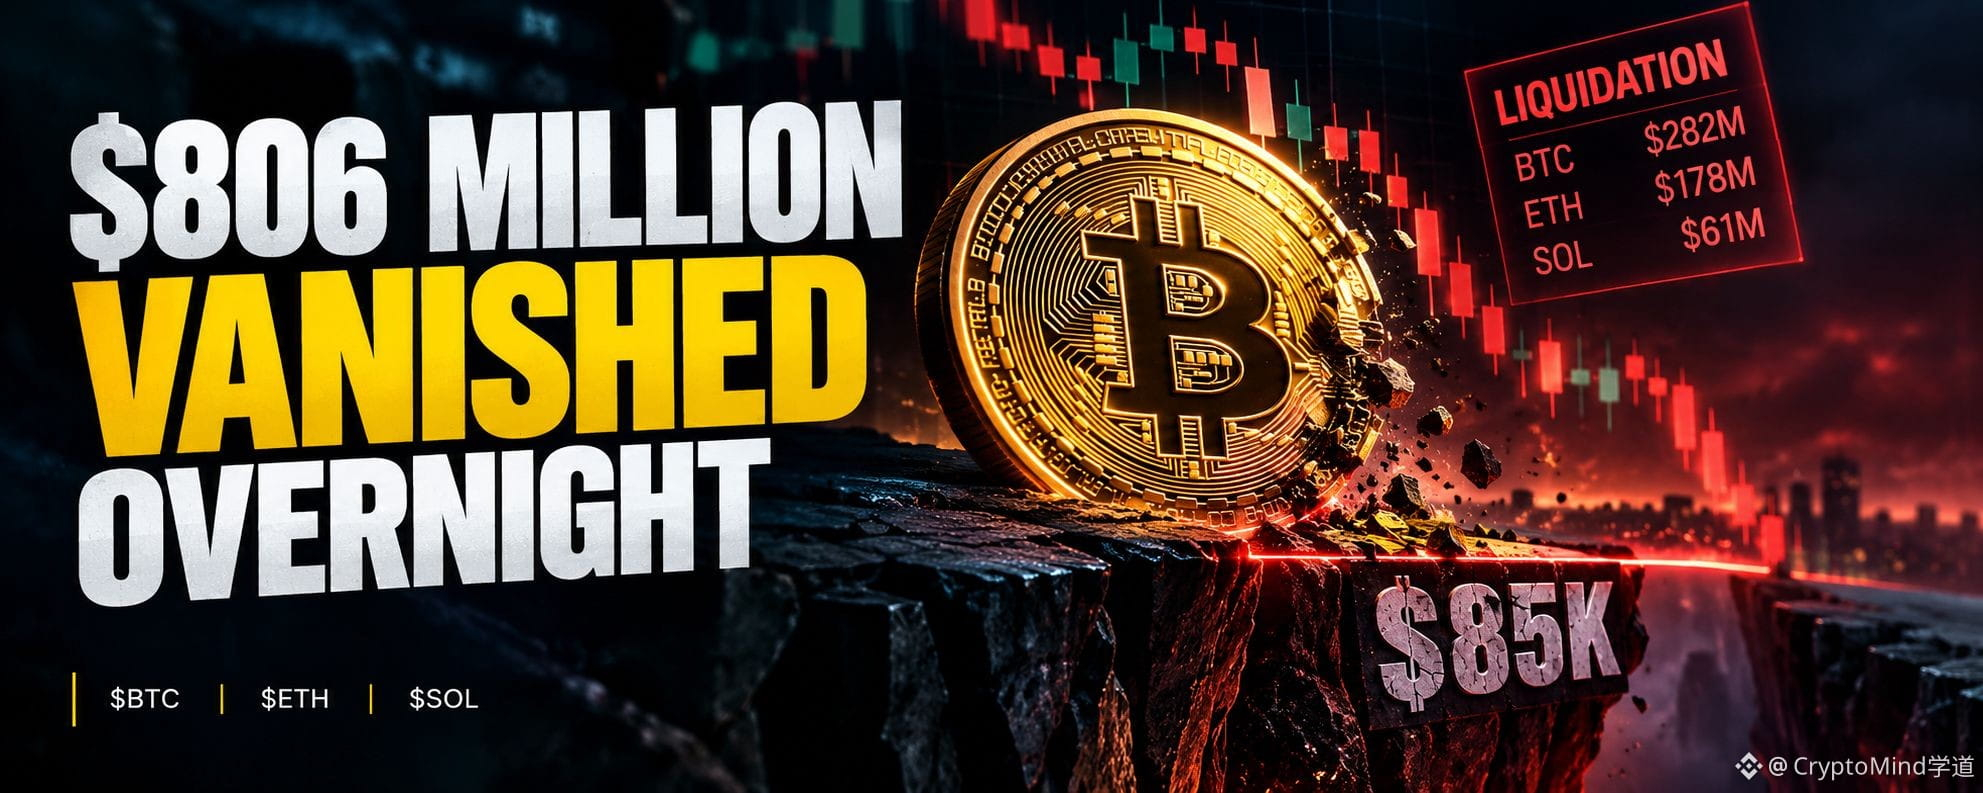
Over $806 million in futures positions were liquidated across crypto in the 24 hours ending October 3. Bitcoin led with $282 million. Ethereum followed at $178 million. Solana and XRP bled another $61 million combined.
I’ve been on that side before. Back in 2021, I was long ETH at what I thought was a sure thing. The funding was positive, the crowd was euphoric, everything looked perfect. Then a single red candle took me out in under three minutes. I remember refreshing the page like the number would come back. It didn’t.
Here’s what actually happened.
The U.S. jobs report dropped Thursday morning. September nonfarm payrolls grew by just 29,000 — roughly a third of what consensus expected. Unemployment ticked up to 4.2%. The initial reaction made sense: weak jobs data means the Fed might hold off on rate hikes, which is good for risk assets. Bitcoin jumped from $86,000 to $87,200 in moments. Then the reversal started.
BTC shed more than $3,000 in a few hours. First $85,500. Then below $84,000. A single Binance liquidation order of nearly $12 million hit the tape. That’s not a trader exiting a position. That’s a forced sale. A margin call executed at market, no negotiation, no waiting for a better price.
Here’s the part nobody’s saying. Everyone’s blaming the jobs report. But the report wasn’t bearish. It was the excuse. The real setup was the leverage that built up before the data dropped. Open interest on Bitcoin futures climbed by $2.3 billion in the days leading up to Thursday. Funding rates tripled from around 3% to 10%. That means traders were paying 10% annualized just to hold long positions. They were that confident. They were that crowded. And they were that vulnerable.
I’m not bearish. I’m just saying the people who got liquidated weren’t unlucky. They were positioned badly in a market that punishes that.
The contrarian angle is this: everyone’s watching the jobs report headlines, but the real signal was the order book. A wall of sell orders sat around $85,000 all week. Once buyers cleared that wall, the remaining sell orders got pulled. That’s what let price accelerate upward to $86,857. Then the same thin liquidity that helped the pump made the dump violent. When forced selling hit, there was nothing underneath to catch it.
Liquidation cascades don’t tell you direction. They tell you positioning. The longs were positioned for $90K. The market showed them $83K instead.
The level that matters now is $85,000. BTC broke above it during Friday’s short squeeze, triggering $122 million in short liquidations. That’s the flip side of Thursday’s pain. The same mechanism that destroyed longs on Thursday destroyed shorts on Friday. Over $210 million in shorts across crypto got liquidated when BTC pushed back toward $87,000.
If $85,000 holds as support on a daily close, the shorts that just got liquidated will start rebuilding. They’ll cluster above $87,000. If the pattern holds, those clusters become the fuel for the next squeeze. If $85,000 breaks? The forced buying that drove Friday’s rally disappears. The spot bid underneath was thin. The same cascade can run in reverse. Again.
What’s happening on the whale side tells a different story. Bitcoin whales reduced their holdings by about 30,000 BTC — roughly $2.52 billion — during the recent sideways stretch. Ethereum whales added 60,000 ETH. Solana’s stablecoin market cap just crossed $15 billion, with Fiserv putting a live bank stablecoin on the network this week. That’s not a uniform signal. It’s a market where big money is rotating, not accumulating everything.
Spot Bitcoin ETFs flipped back to inflows on the first trading day of October, pulling in $102.7 million after their strongest quarter of 2026. Ethereum ETFs bled $55.4 million the same day — their third straight day of outflows. The fear and greed index sits at 72. Greed. Down two points from yesterday. Still greed.
$BTC $ETH $SOL
#Bitcoin #crypto #liquidation
The move was real. $806 million in forced closes is real. But real moves still need a base to stand on. Right now, the base is $85,000. Everything above it is leverage and hope. Everything below it is a vacuum.
If you got liquidated Thursday night, did you learn something — or did you just get angry?
I Watched $806 Million Vanish Overnight
I was about to close my laptop Thursday night when the alert hit. Bitcoin had just touched $87,200. Ten minutes later it was under $84,000. I sat back down.
A friend called me at 11 p.m. His voice was different. He’d been long since $82K, leveraged, feeling smart. He wasn’t feeling smart anymore.
Over $806 million in futures positions were liquidated across crypto in the 24 hours ending October 3. Bitcoin led with $282 million. Ethereum followed at $178 million. Solana and XRP bled another $61 million combined.
I’ve been on that side before. Back in 2021, I was long ETH at what I thought was a sure thing. The funding was positive, the crowd was euphoric, everything looked perfect. Then a single red candle took me out in under three minutes. I remember refreshing the page like the number would come back. It didn’t.
Here’s what actually happened.
The U.S. jobs report dropped Thursday morning. September nonfarm payrolls grew by just 29,000 — roughly a third of what consensus expected. Unemployment ticked up to 4.2%. The initial reaction made sense: weak jobs data means the Fed might hold off on rate hikes, which is good for risk assets. Bitcoin jumped from $86,000 to $87,200 in moments. Then the reversal started.
BTC shed more than $3,000 in a few hours. First $85,500. Then below $84,000. A single Binance liquidation order of nearly $12 million hit the tape. That’s not a trader exiting a position. That’s a forced sale. A margin call executed at market, no negotiation, no waiting for a better price.
Here’s the part nobody’s saying. Everyone’s blaming the jobs report. But the report wasn’t bearish. It was the excuse. The real setup was the leverage that built up before the data dropped. Open interest on Bitcoin futures climbed by $2.3 billion in the days leading up to Thursday. Funding rates tripled from around 3% to 10%. That means traders were paying 10% annualized just to hold long positions. They were that confident. They were that crowded. And they were that vulnerable.
I’m not bearish. I’m just saying the people who got liquidated weren’t unlucky. They were positioned badly in a market that punishes that.
The contrarian angle is this: everyone’s watching the jobs report headlines, but the real signal was the order book. A wall of sell orders sat around $85,000 all week. Once buyers cleared that wall, the remaining sell orders got pulled. That’s what let price accelerate upward to $86,857. Then the same thin liquidity that helped the pump made the dump violent. When forced selling hit, there was nothing underneath to catch it.
Liquidation cascades don’t tell you direction. They tell you positioning. The longs were positioned for $90K. The market showed them $83K instead.
The level that matters now is $85,000. BTC broke above it during Friday’s short squeeze, triggering $122 million in short liquidations. That’s the flip side of Thursday’s pain. The same mechanism that destroyed longs on Thursday destroyed shorts on Friday. Over $210 million in shorts across crypto got liquidated when BTC pushed back toward $87,000.
If $85,000 holds as support on a daily close, the shorts that just got liquidated will start rebuilding. They’ll cluster above $87,000. If the pattern holds, those clusters become the fuel for the next squeeze. If $85,000 breaks? The forced buying that drove Friday’s rally disappears. The spot bid underneath was thin. The same cascade can run in reverse. Again.
What’s happening on the whale side tells a different story. Bitcoin whales reduced their holdings by about 30,000 BTC — roughly $2.52 billion — during the recent sideways stretch. Ethereum whales added 60,000 ETH. Solana’s stablecoin market cap just crossed $15 billion, with Fiserv putting a live bank stablecoin on the network this week. That’s not a uniform signal. It’s a market where big money is rotating, not accumulating everything.
Spot Bitcoin ETFs flipped back to inflows on the first trading day of October, pulling in $102.7 million after their strongest quarter of 2026. Ethereum ETFs bled $55.4 million the same day — their third straight day of outflows. The fear and greed index sits at 72. Greed. Down two points from yesterday. Still greed.
$BTC $ETH $SOL
#Bitcoin #crypto #liquidation
The move was real. $806 million in forced closes is real. But real moves still need a base to stand on. Right now, the base is $85,000. Everything above it is leverage and hope. Everything below it is a vacuum.
If you got liquidated Thursday night, did you learn something — or did you just get angry?
A friend called me at 11 p.m. His voice was different. He’d been long since $82K, leveraged, feeling smart. He wasn’t feeling smart anymore.
Over $806 million in futures positions were liquidated across crypto in the 24 hours ending October 3. Bitcoin led with $282 million. Ethereum followed at $178 million. Solana and XRP bled another $61 million combined.
I’ve been on that side before. Back in 2021, I was long ETH at what I thought was a sure thing. The funding was positive, the crowd was euphoric, everything looked perfect. Then a single red candle took me out in under three minutes. I remember refreshing the page like the number would come back. It didn’t.
Here’s what actually happened.
The U.S. jobs report dropped Thursday morning. September nonfarm payrolls grew by just 29,000 — roughly a third of what consensus expected. Unemployment ticked up to 4.2%. The initial reaction made sense: weak jobs data means the Fed might hold off on rate hikes, which is good for risk assets. Bitcoin jumped from $86,000 to $87,200 in moments. Then the reversal started.
BTC shed more than $3,000 in a few hours. First $85,500. Then below $84,000. A single Binance liquidation order of nearly $12 million hit the tape. That’s not a trader exiting a position. That’s a forced sale. A margin call executed at market, no negotiation, no waiting for a better price.
Here’s the part nobody’s saying. Everyone’s blaming the jobs report. But the report wasn’t bearish. It was the excuse. The real setup was the leverage that built up before the data dropped. Open interest on Bitcoin futures climbed by $2.3 billion in the days leading up to Thursday. Funding rates tripled from around 3% to 10%. That means traders were paying 10% annualized just to hold long positions. They were that confident. They were that crowded. And they were that vulnerable.
I’m not bearish. I’m just saying the people who got liquidated weren’t unlucky. They were positioned badly in a market that punishes that.
The contrarian angle is this: everyone’s watching the jobs report headlines, but the real signal was the order book. A wall of sell orders sat around $85,000 all week. Once buyers cleared that wall, the remaining sell orders got pulled. That’s what let price accelerate upward to $86,857. Then the same thin liquidity that helped the pump made the dump violent. When forced selling hit, there was nothing underneath to catch it.
Liquidation cascades don’t tell you direction. They tell you positioning. The longs were positioned for $90K. The market showed them $83K instead.
The level that matters now is $85,000. BTC broke above it during Friday’s short squeeze, triggering $122 million in short liquidations. That’s the flip side of Thursday’s pain. The same mechanism that destroyed longs on Thursday destroyed shorts on Friday. Over $210 million in shorts across crypto got liquidated when BTC pushed back toward $87,000.
If $85,000 holds as support on a daily close, the shorts that just got liquidated will start rebuilding. They’ll cluster above $87,000. If the pattern holds, those clusters become the fuel for the next squeeze. If $85,000 breaks? The forced buying that drove Friday’s rally disappears. The spot bid underneath was thin. The same cascade can run in reverse. Again.
What’s happening on the whale side tells a different story. Bitcoin whales reduced their holdings by about 30,000 BTC — roughly $2.52 billion — during the recent sideways stretch. Ethereum whales added 60,000 ETH. Solana’s stablecoin market cap just crossed $15 billion, with Fiserv putting a live bank stablecoin on the network this week. That’s not a uniform signal. It’s a market where big money is rotating, not accumulating everything.
Spot Bitcoin ETFs flipped back to inflows on the first trading day of October, pulling in $102.7 million after their strongest quarter of 2026. Ethereum ETFs bled $55.4 million the same day — their third straight day of outflows. The fear and greed index sits at 72. Greed. Down two points from yesterday. Still greed.
$BTC $ETH $SOL
#Bitcoin #crypto #liquidation
The move was real. $806 million in forced closes is real. But real moves still need a base to stand on. Right now, the base is $85,000. Everything above it is leverage and hope. Everything below it is a vacuum.
If you got liquidated Thursday night, did you learn something — or did you just get angry?
1
65
·
--
တက်ရိပ်ရှိသည်
Guys Most ignore $AR as just storage, but the AO upgrade makes it a decentralized hyper-parallel computer. That is a massive moat.
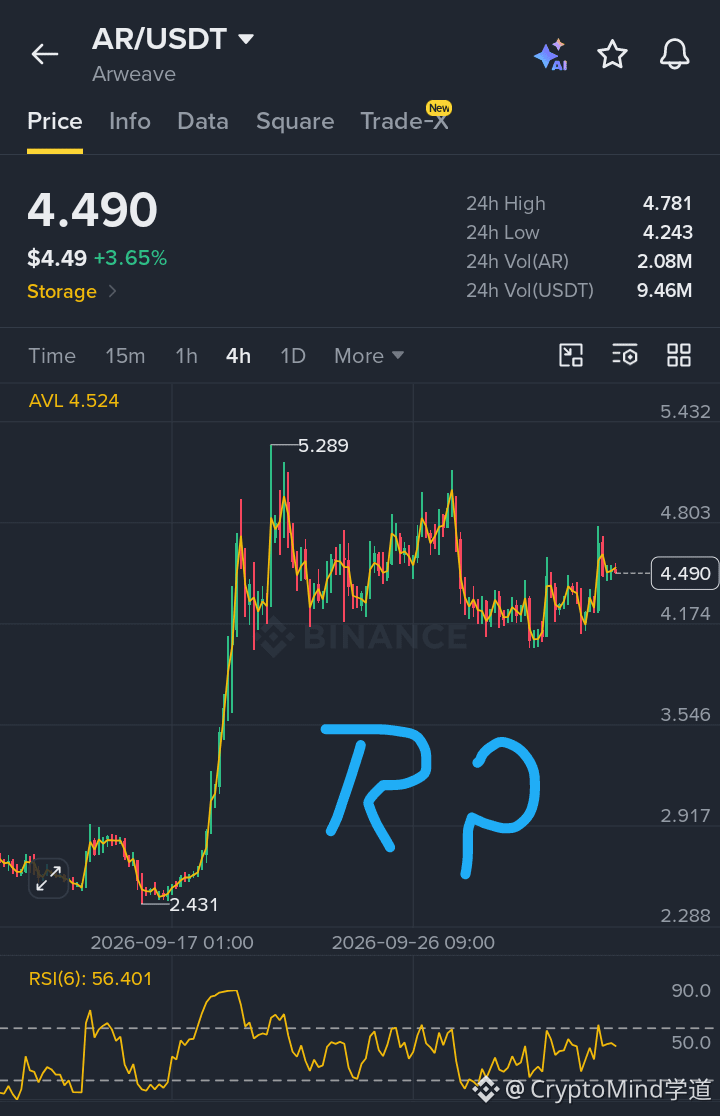
RSI is a healthy 56, plenty of room before overheating. I am DCAing into this chop.
I am accumulating around 4.20, flipping old resistance to support. Targets are 4.80 and a retest of 5.28. Invalidated if we lose 3.50
{spot}(ARUSDT)
Is the market pricing in the compute pivot yet?
Guys Most ignore $AR as just storage, but the AO upgrade makes it a decentralized hyper-parallel computer. That is a massive moat.
RSI is a healthy 56, plenty of room before overheating. I am DCAing into this chop.
I am accumulating around 4.20, flipping old resistance to support. Targets are 4.80 and a retest of 5.28. Invalidated if we lose 3.50
Is the market pricing in the compute pivot yet?
RSI is a healthy 56, plenty of room before overheating. I am DCAing into this chop.
I am accumulating around 4.20, flipping old resistance to support. Targets are 4.80 and a retest of 5.28. Invalidated if we lose 3.50
Is the market pricing in the compute pivot yet?

115
·
--
တစ်စိတ်တစ်ပိုင်း မှန်ကန်

Article
STRK Surges Ahead Of Network Upgrade As Traders Pile InThe Asian session closed hours ago.
London is halfway through its day.
New York hasn't opened yet.
This is when the tape goes quiet and the real read shows up.
The last four hours barely moved the needle.
But that wick to 0.05344 said something.
$STRK funding sits at 0.0100% across Binance, Bybit, and Hyperliquid.
Kraken is screaming at 0.1467%, signaling crowded longs on that venue.
Open interest exploded 25.71% in 24 hours to $74.68 million.
Bybit OI jumped 64%, Hyperliquid up 69%, Gate nearly doubled at 73%.
Starknet's v0.14.4 mainnet upgrade drops tomorrow, October 5, 2026.
The network is pushing support for 1.1 billion Layer-2 gas transactions.
Price ripped from 0.02594 to 0.05066, a 95% climb in weeks.
RSI(6) prints 81.49, deep in overbought territory.
Above 0.05344 and I'm watching 0.05928, then 0.06500.
Lose 0.04485 and I'm done.
{future}(STRKUSDT)
Bitcoin trades around $84,800, up modestly on the day.
Dominance hovers near 59%, pressing against the 60% ceiling.
Total crypto market cap sits at $2.99 trillion.
Alts are catching selective bids, but BTC.D holding here caps the rally.
Capital is rotating into specific narratives, not broad alt season.
I chased a Layer-2 breakout in September without waiting for the pullback.
The upgrade catalyst was real, but my entry was greedy.
This hour between sessions reveals what the noise hides.
Tomorrow's upgrade is priced in, but the funding tells the truth.
What position are you holding that you're pretending isn't already over?
STRK Surges Ahead Of Network Upgrade As Traders Pile In
The Asian session closed hours ago.
London is halfway through its day.
New York hasn't opened yet.
This is when the tape goes quiet and the real read shows up.
The last four hours barely moved the needle.
But that wick to 0.05344 said something.
$STRK funding sits at 0.0100% across Binance, Bybit, and Hyperliquid.
Kraken is screaming at 0.1467%, signaling crowded longs on that venue.
Open interest exploded 25.71% in 24 hours to $74.68 million.
Bybit OI jumped 64%, Hyperliquid up 69%, Gate nearly doubled at 73%.
Starknet's v0.14.4 mainnet upgrade drops tomorrow, October 5, 2026.
The network is pushing support for 1.1 billion Layer-2 gas transactions.
Price ripped from 0.02594 to 0.05066, a 95% climb in weeks.
RSI(6) prints 81.49, deep in overbought territory.
Above 0.05344 and I'm watching 0.05928, then 0.06500.
Lose 0.04485 and I'm done.
Bitcoin trades around $84,800, up modestly on the day.
Dominance hovers near 59%, pressing against the 60% ceiling.
Total crypto market cap sits at $2.99 trillion.
Alts are catching selective bids, but BTC.D holding here caps the rally.
Capital is rotating into specific narratives, not broad alt season.
I chased a Layer-2 breakout in September without waiting for the pullback.
The upgrade catalyst was real, but my entry was greedy.
This hour between sessions reveals what the noise hides.
Tomorrow's upgrade is priced in, but the funding tells the truth.
What position are you holding that you're pretending isn't already over?
London is halfway through its day.
New York hasn't opened yet.
This is when the tape goes quiet and the real read shows up.
The last four hours barely moved the needle.
But that wick to 0.05344 said something.
$STRK funding sits at 0.0100% across Binance, Bybit, and Hyperliquid.
Kraken is screaming at 0.1467%, signaling crowded longs on that venue.
Open interest exploded 25.71% in 24 hours to $74.68 million.
Bybit OI jumped 64%, Hyperliquid up 69%, Gate nearly doubled at 73%.
Starknet's v0.14.4 mainnet upgrade drops tomorrow, October 5, 2026.
The network is pushing support for 1.1 billion Layer-2 gas transactions.
Price ripped from 0.02594 to 0.05066, a 95% climb in weeks.
RSI(6) prints 81.49, deep in overbought territory.
Above 0.05344 and I'm watching 0.05928, then 0.06500.
Lose 0.04485 and I'm done.
Bitcoin trades around $84,800, up modestly on the day.
Dominance hovers near 59%, pressing against the 60% ceiling.
Total crypto market cap sits at $2.99 trillion.
Alts are catching selective bids, but BTC.D holding here caps the rally.
Capital is rotating into specific narratives, not broad alt season.
I chased a Layer-2 breakout in September without waiting for the pullback.
The upgrade catalyst was real, but my entry was greedy.
This hour between sessions reveals what the noise hides.
Tomorrow's upgrade is priced in, but the funding tells the truth.
What position are you holding that you're pretending isn't already over?
26
·
--
ကျရိပ်ရှိသည်
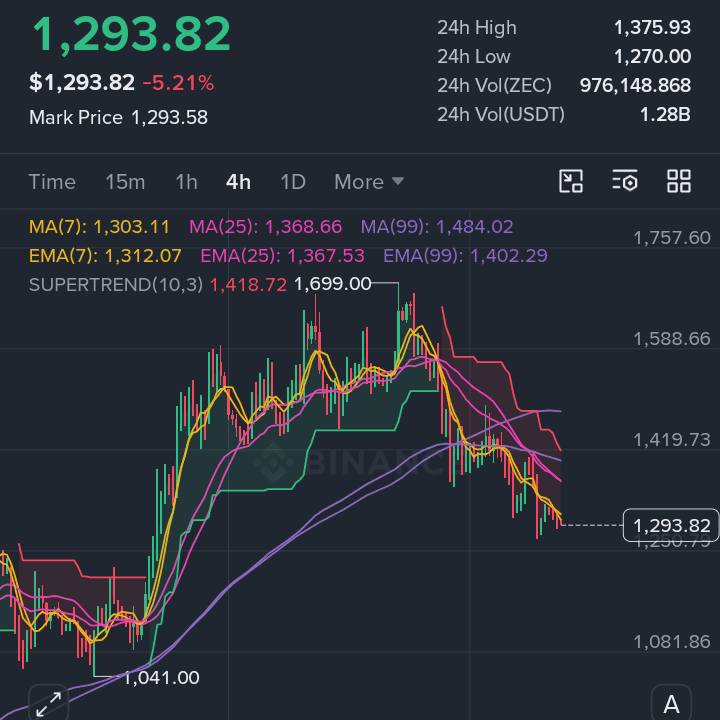
Listen guys Every bounce in $ZEC keeps getting sold. I'm fading the next one... 📉
Looking for a short entry around 1,300 - 1,310
That's where the last two rallies died, so it's my line in the sand
First target 1,270. 🎯
The recent low. Once it breaks, sellers pile in fast
Then 1,200. 🎯
Round numbers pull price like a magnet
If it really gives way, 1,081. 🎯
Old floor from last month, sitting there waiting
Stop at 1,370. 🛑
Above that, the sell story is wrong and I'm out, no arguing
Learned this the hard way: I once held a losing short through a bounce because I moved my stop just once. Gave back a whole good month. The stop stays where I put it
Size small so a wick up doesn't knock you out before the move even comes
Does $ZEC bounce here or flush lower? Curious what you guys think
{future}(ZECUSDT)
#ZECUSDT $AIN
Listen guys Every bounce in $ZEC keeps getting sold. I'm fading the next one... 📉
Looking for a short entry around 1,300 - 1,310
That's where the last two rallies died, so it's my line in the sand
First target 1,270. 🎯
The recent low. Once it breaks, sellers pile in fast
Then 1,200. 🎯
Round numbers pull price like a magnet
If it really gives way, 1,081. 🎯
Old floor from last month, sitting there waiting
Stop at 1,370. 🛑
Above that, the sell story is wrong and I'm out, no arguing
Learned this the hard way: I once held a losing short through a bounce because I moved my stop just once. Gave back a whole good month. The stop stays where I put it
Size small so a wick up doesn't knock you out before the move even comes
Does $ZEC bounce here or flush lower? Curious what you guys think
#ZECUSDT $AIN
Looking for a short entry around 1,300 - 1,310
That's where the last two rallies died, so it's my line in the sand
First target 1,270. 🎯
The recent low. Once it breaks, sellers pile in fast
Then 1,200. 🎯
Round numbers pull price like a magnet
If it really gives way, 1,081. 🎯
Old floor from last month, sitting there waiting
Stop at 1,370. 🛑
Above that, the sell story is wrong and I'm out, no arguing
Learned this the hard way: I once held a losing short through a bounce because I moved my stop just once. Gave back a whole good month. The stop stays where I put it
Size small so a wick up doesn't knock you out before the move even comes
Does $ZEC bounce here or flush lower? Curious what you guys think
#ZECUSDT $AIN
38
·
--
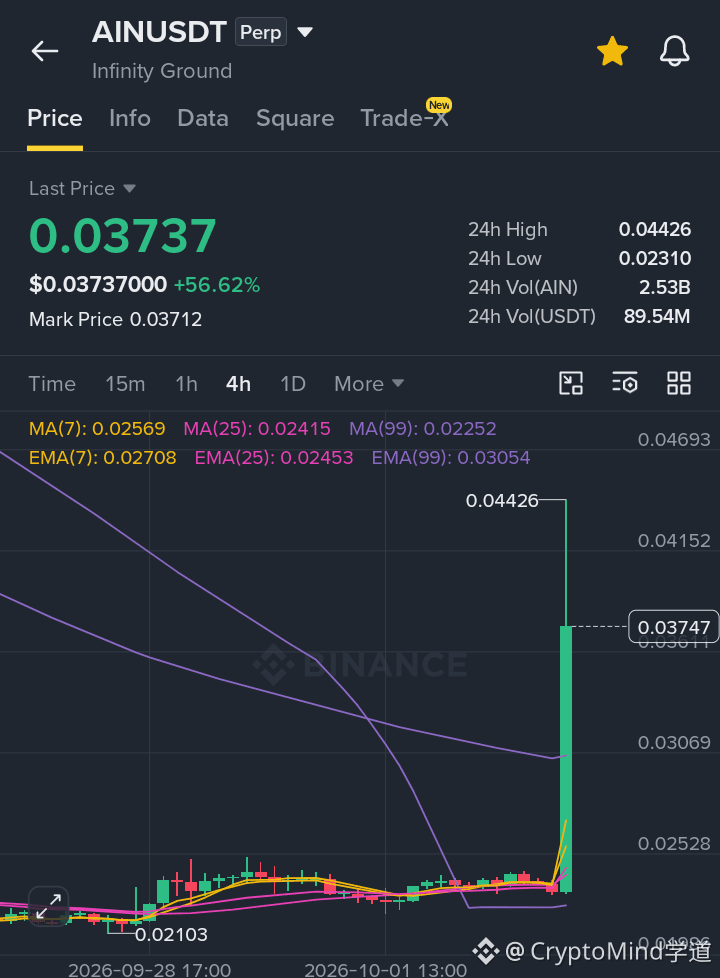
The 0.04426 wick got rejected hard. Heavy volume spike but buyers vanished, leaving a long upper shadow. 🧊
🔴 Short $AIN
🚪 Entry 0.03747
💰 Targets 0.02528, 0.02103
Stop 0.04450
Are you shorting the breakdown? 👀
{future}(AINUSDT)
The 0.04426 wick got rejected hard. Heavy volume spike but buyers vanished, leaving a long upper shadow. 🧊
🔴 Short $AIN
🚪 Entry 0.03747
💰 Targets 0.02528, 0.02103
Stop 0.04450
Are you shorting the breakdown? 👀
🔴 Short $AIN
🚪 Entry 0.03747
💰 Targets 0.02528, 0.02103
Stop 0.04450
Are you shorting the breakdown? 👀
170
·
--
တက်ရိပ်ရှိသည်
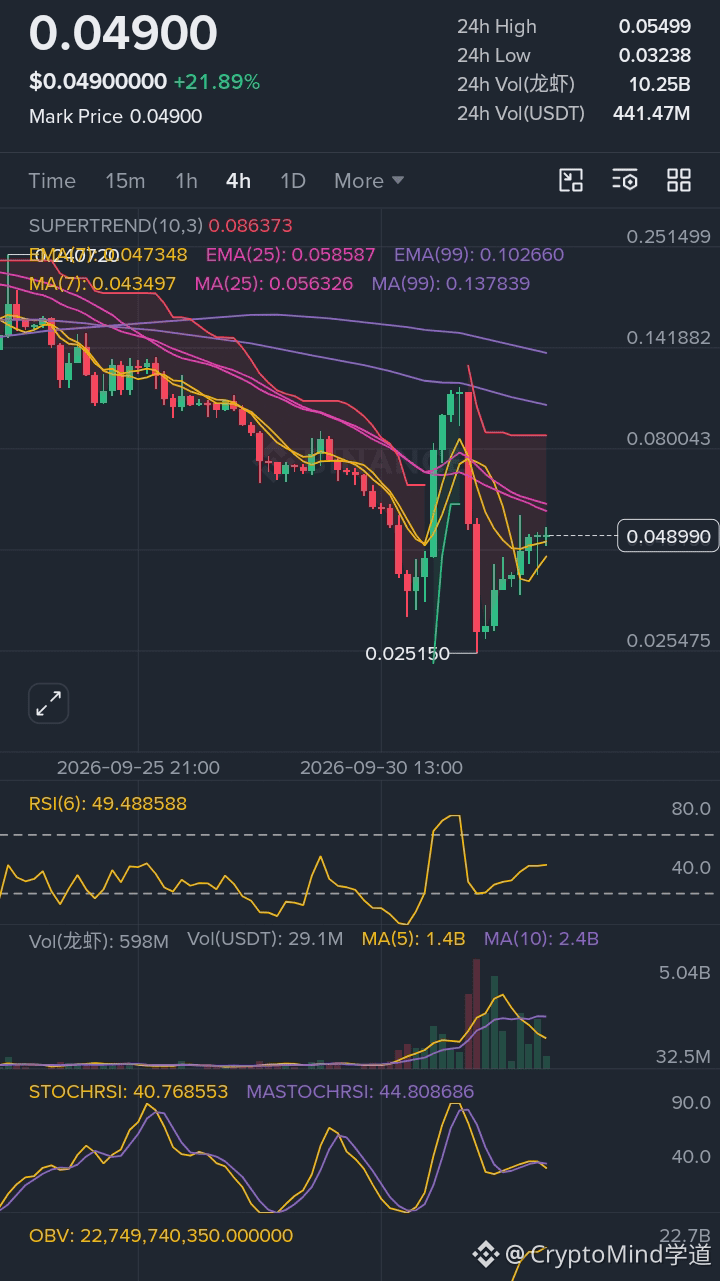
Binance Alpha listing just gave this token the volume it needed, while the other two are still searching for a real narrative. 📉
🐂 Long $龙虾
🚪 Entry 0.04900
💰 Targets 0.05400, 0.06000
🛑 Stop 0.04300
Trade here 👇🏽
{future}(龙虾USDT)
Why 龙虾 Is the Best Trade 🚀
The setup here is the cleanest of the three. The core catalyst is the Binance Alpha listing, which brought in retail volume and direct access via Binance Wallet Perpetuals with 0% maker fees. The chart shows a bounce from 0.02515 and is now consolidating around 0.04900. Funding is sitting at 0%, meaning there is no premium to pay — a clean entry. RSI is at 49, right in the safe zone, not overbought or oversold. Open interest is sitting at $86.92M, showing there is enough leverage in the market for a short squeeze if price breaks upward.
Why VELVET and ONE Are Not Worth the Risk
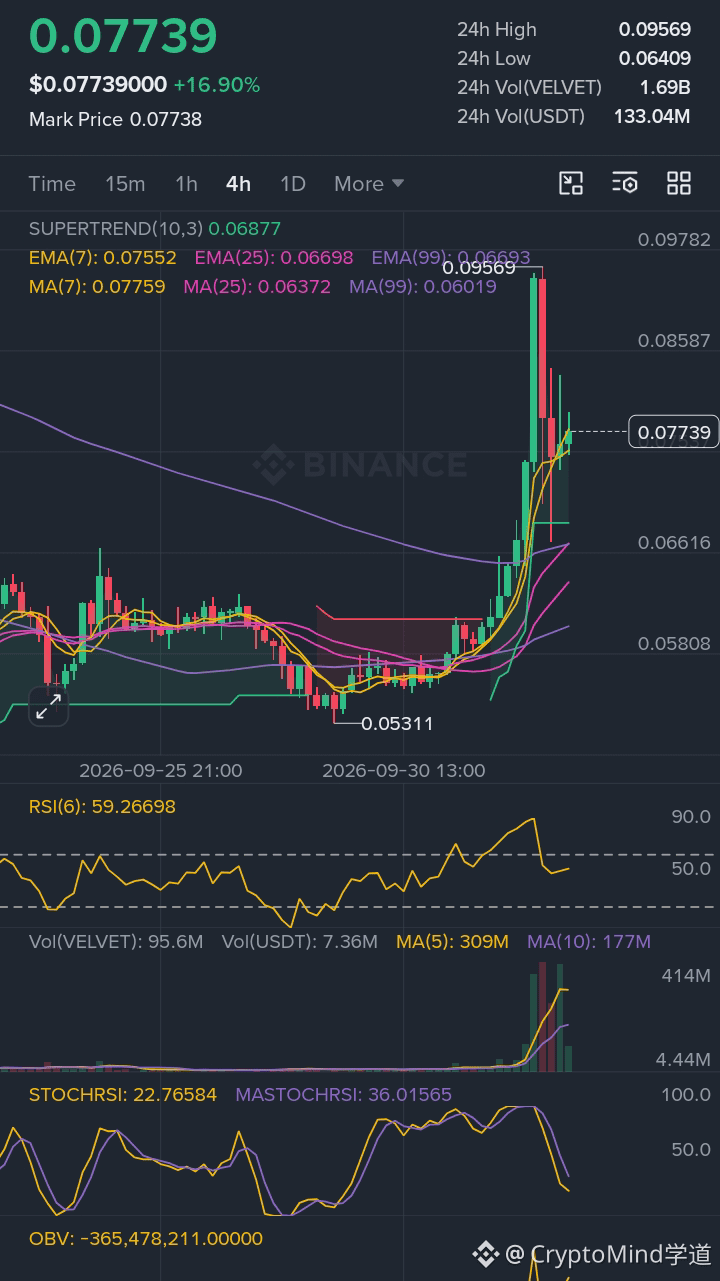
· $VELVET (0.07739): RSI is at 59, but the funding rate is positive and climbing, meaning longs are already paying heavily. Open interest is at $9.35M, which creates a massive long-squeeze risk if price dips — a setup where late longs get trapped.
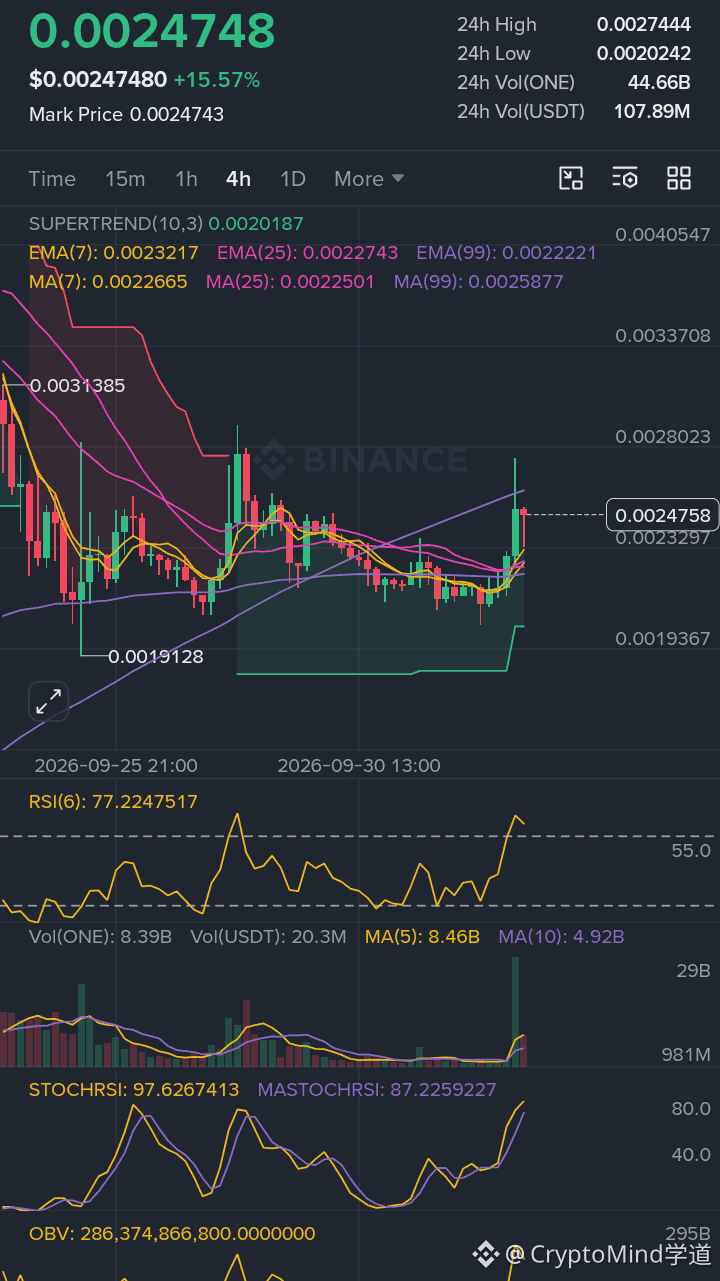
· $ONE (0.0024748): RSI is at 77 (overbought) and funding is negative at -0.1134%, showing mixed sentiment. The bigger issue is that Harmony has proposed a full mainnet shutdown and migration of the ONE token to Ethereum, with users told to exit all smart contracts by September 10, 2026. This is a narrative pump with no real utility left — trading it is gambling on news.
Are you shorting the breakdown?
{future}(VELVETUSDT)
{future}(ONEUSDT)
Binance Alpha listing just gave this token the volume it needed, while the other two are still searching for a real narrative. 📉
🐂 Long $龙虾
🚪 Entry 0.04900
💰 Targets 0.05400, 0.06000
🛑 Stop 0.04300
Trade here 👇🏽
Why 龙虾 Is the Best Trade 🚀
The setup here is the cleanest of the three. The core catalyst is the Binance Alpha listing, which brought in retail volume and direct access via Binance Wallet Perpetuals with 0% maker fees. The chart shows a bounce from 0.02515 and is now consolidating around 0.04900. Funding is sitting at 0%, meaning there is no premium to pay — a clean entry. RSI is at 49, right in the safe zone, not overbought or oversold. Open interest is sitting at $86.92M, showing there is enough leverage in the market for a short squeeze if price breaks upward.
Why VELVET and ONE Are Not Worth the Risk
· $VELVET (0.07739): RSI is at 59, but the funding rate is positive and climbing, meaning longs are already paying heavily. Open interest is at $9.35M, which creates a massive long-squeeze risk if price dips — a setup where late longs get trapped.
· $ONE (0.0024748): RSI is at 77 (overbought) and funding is negative at -0.1134%, showing mixed sentiment. The bigger issue is that Harmony has proposed a full mainnet shutdown and migration of the ONE token to Ethereum, with users told to exit all smart contracts by September 10, 2026. This is a narrative pump with no real utility left — trading it is gambling on news.
Are you shorting the breakdown?
🐂 Long $龙虾
🚪 Entry 0.04900
💰 Targets 0.05400, 0.06000
🛑 Stop 0.04300
Trade here 👇🏽
Why 龙虾 Is the Best Trade 🚀
The setup here is the cleanest of the three. The core catalyst is the Binance Alpha listing, which brought in retail volume and direct access via Binance Wallet Perpetuals with 0% maker fees. The chart shows a bounce from 0.02515 and is now consolidating around 0.04900. Funding is sitting at 0%, meaning there is no premium to pay — a clean entry. RSI is at 49, right in the safe zone, not overbought or oversold. Open interest is sitting at $86.92M, showing there is enough leverage in the market for a short squeeze if price breaks upward.
Why VELVET and ONE Are Not Worth the Risk
· $VELVET (0.07739): RSI is at 59, but the funding rate is positive and climbing, meaning longs are already paying heavily. Open interest is at $9.35M, which creates a massive long-squeeze risk if price dips — a setup where late longs get trapped.
· $ONE (0.0024748): RSI is at 77 (overbought) and funding is negative at -0.1134%, showing mixed sentiment. The bigger issue is that Harmony has proposed a full mainnet shutdown and migration of the ONE token to Ethereum, with users told to exit all smart contracts by September 10, 2026. This is a narrative pump with no real utility left — trading it is gambling on news.
Are you shorting the breakdown?
128
·
--
Article
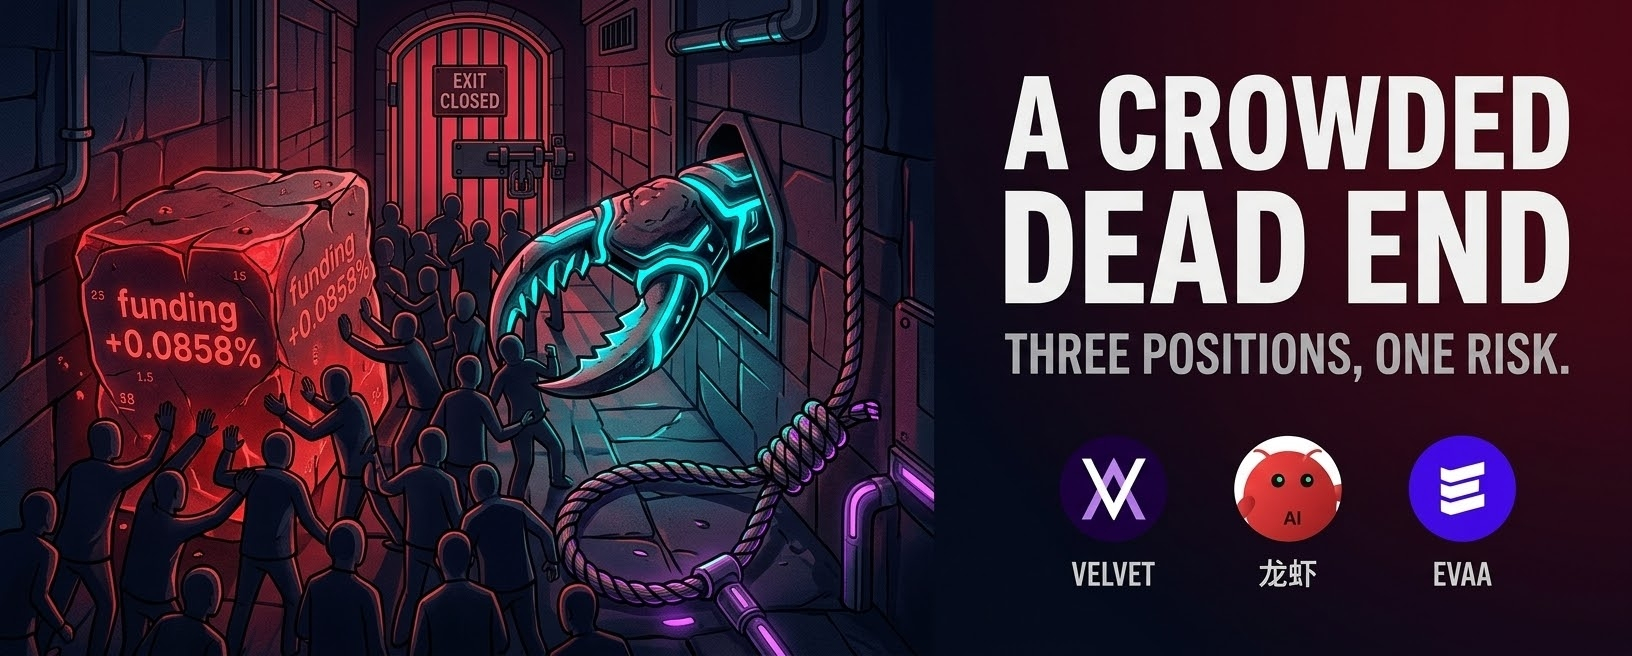
Bro, The Only Chart That Matters Is The One You Can Walk Away From...👀The first thing I saw was the funding rate. +0.0858% on one of these. That's not a market. That's a crowded room with one exit
I've traded through enough cycles to know that number. It's the number that tells you everyone is on the same side of the boat. And when everyone is on the same side, the boat tips
$VELVET is the first one. It ran from 0.048 to 0.0956 in a single session, then gave half of it back. That's not a breakout. That's a liquidation cascade in both directions
The headline is the airdrop deadline on October 10. Over $1M per epoch, and the next snapshot is seven days away. The perp trading gives you double the gems, and consecutive participation rewards can reach 150%. That's a direct financial incentive to trade and lock tokens before the deadline. It's real. It's also a trap
Funding is positive at +0.0293%. Longs are paying shorts. Open interest sits around $16.68M, down 12.63% in 24 hours. That tells you the leveraged longs are already getting flushed out
The level that matters is $0.0956. A clean reclaim opens the door toward $0.11. Lose $0.0687 and the structure breaks
Above $0.0956 and I'm watching $0.11 first, then $0.13. Lose $0.0687 and I'm done. I've bought an airdrop snapshot play before and watched it bleed for a week straight because everyone else had the same idea
{future}(VELVETUSDT)
$龙虾 is the second chart. And this one is worse. Up 71% on the day, but the 24-hour range is from $0.028 to $0.054. That's a 90% swing. Funding sits at +0.0858% on Binance. Open interest is $86.92M. For a meme coin, that's enormous
The story is ugly. A trader lost $200K in under 20 hours buying the top and selling the bottom. The token surged 244%, then dumped 73% in a single session. Market cap fell below $30M at one point. Binance launched the perpetual contract with up to 5x leverage, and that's what fueled the initial spike
This isn't a chart. It's a slot machine with a withdrawal limit
The level that matters is $0.0549. A clean break above it opens the door toward $0.07. Lose $0.0288 and the bid disappears
Above $0.0549 and I'm watching $0.07 first, then $0.09. Lose $0.0288 and I'm out
{future}(龙虾USDT)
$EVAA is the third chart. And it's the opposite of the first two. Down 14% on the day, but up 51% over the past week. Funding is negative at -0.0296%. Shorts are paying longs. The crowd is leaning short even as the token grinds higher
The headline is the listing. Binance Alpha, Binance Futures perpetuals, MEXC, and Gate all listed the token on October 3. That's a massive liquidity injection. But there's a catch. A multi-sig address distributed 2.5 million EVAA to ten addresses in the past ten minutes. That's 37.8% of the circulating supply. That's a red flag, not a green one
The level that matters is $0.8498. A clean break above it opens the door toward $1.00. Lose $0.6774 and the bid thins out
Above $0.8498 and I'm watching $1.00 first, then $1.15. Lose $0.6774 and I'm out
{future}(EVAAUSDT)
The wider market matters here. Bitcoin is holding near $84,600 after tapping $87,000. Dominance slipped to 58.6% as of October 3, down from nearly 60% a week ago. That's the spine of this whole trade
When dominance falls while the aggregate cap rises, the marginal dollar moves down the risk curve. The Altcoin Season Index is at 61 out of 100. A month ago it was 23. Still below the 75 threshold that confirms a full rotation, but the direction is clear
Open interest in perpetual futures across crypto is elevated. The crowd is leaning into these new listings and the meme plays. Where I could be wrong is if Bitcoin dominance reclaims 60% and the rotation stalls. Then the late longs get paid and these breakouts fail
I've been on the wrong side of a "confirmed breakout" before. The chart looked perfect, every box checked, and then the bid vanished. That's why I don't trust a wick at the high
The levels are the levels. The tape will tell you which ones matter.
How much of this rotation did you actually catch, and how much did you watch from the sidelines?
Bro, The Only Chart That Matters Is The One You Can Walk Away From...👀
The first thing I saw was the funding rate. +0.0858% on one of these. That's not a market. That's a crowded room with one exit
I've traded through enough cycles to know that number. It's the number that tells you everyone is on the same side of the boat. And when everyone is on the same side, the boat tips
$VELVET is the first one. It ran from 0.048 to 0.0956 in a single session, then gave half of it back. That's not a breakout. That's a liquidation cascade in both directions
The headline is the airdrop deadline on October 10. Over $1M per epoch, and the next snapshot is seven days away. The perp trading gives you double the gems, and consecutive participation rewards can reach 150%. That's a direct financial incentive to trade and lock tokens before the deadline. It's real. It's also a trap
Funding is positive at +0.0293%. Longs are paying shorts. Open interest sits around $16.68M, down 12.63% in 24 hours. That tells you the leveraged longs are already getting flushed out
The level that matters is $0.0956. A clean reclaim opens the door toward $0.11. Lose $0.0687 and the structure breaks
Above $0.0956 and I'm watching $0.11 first, then $0.13. Lose $0.0687 and I'm done. I've bought an airdrop snapshot play before and watched it bleed for a week straight because everyone else had the same idea
$龙虾 is the second chart. And this one is worse. Up 71% on the day, but the 24-hour range is from $0.028 to $0.054. That's a 90% swing. Funding sits at +0.0858% on Binance. Open interest is $86.92M. For a meme coin, that's enormous
The story is ugly. A trader lost $200K in under 20 hours buying the top and selling the bottom. The token surged 244%, then dumped 73% in a single session. Market cap fell below $30M at one point. Binance launched the perpetual contract with up to 5x leverage, and that's what fueled the initial spike
This isn't a chart. It's a slot machine with a withdrawal limit
The level that matters is $0.0549. A clean break above it opens the door toward $0.07. Lose $0.0288 and the bid disappears
Above $0.0549 and I'm watching $0.07 first, then $0.09. Lose $0.0288 and I'm out
$EVAA is the third chart. And it's the opposite of the first two. Down 14% on the day, but up 51% over the past week. Funding is negative at -0.0296%. Shorts are paying longs. The crowd is leaning short even as the token grinds higher
The headline is the listing. Binance Alpha, Binance Futures perpetuals, MEXC, and Gate all listed the token on October 3. That's a massive liquidity injection. But there's a catch. A multi-sig address distributed 2.5 million EVAA to ten addresses in the past ten minutes. That's 37.8% of the circulating supply. That's a red flag, not a green one
The level that matters is $0.8498. A clean break above it opens the door toward $1.00. Lose $0.6774 and the bid thins out
Above $0.8498 and I'm watching $1.00 first, then $1.15. Lose $0.6774 and I'm out
The wider market matters here. Bitcoin is holding near $84,600 after tapping $87,000. Dominance slipped to 58.6% as of October 3, down from nearly 60% a week ago. That's the spine of this whole trade
When dominance falls while the aggregate cap rises, the marginal dollar moves down the risk curve. The Altcoin Season Index is at 61 out of 100. A month ago it was 23. Still below the 75 threshold that confirms a full rotation, but the direction is clear
Open interest in perpetual futures across crypto is elevated. The crowd is leaning into these new listings and the meme plays. Where I could be wrong is if Bitcoin dominance reclaims 60% and the rotation stalls. Then the late longs get paid and these breakouts fail
I've been on the wrong side of a "confirmed breakout" before. The chart looked perfect, every box checked, and then the bid vanished. That's why I don't trust a wick at the high
The levels are the levels. The tape will tell you which ones matter.
How much of this rotation did you actually catch, and how much did you watch from the sidelines?
I've traded through enough cycles to know that number. It's the number that tells you everyone is on the same side of the boat. And when everyone is on the same side, the boat tips
$VELVET is the first one. It ran from 0.048 to 0.0956 in a single session, then gave half of it back. That's not a breakout. That's a liquidation cascade in both directions
The headline is the airdrop deadline on October 10. Over $1M per epoch, and the next snapshot is seven days away. The perp trading gives you double the gems, and consecutive participation rewards can reach 150%. That's a direct financial incentive to trade and lock tokens before the deadline. It's real. It's also a trap
Funding is positive at +0.0293%. Longs are paying shorts. Open interest sits around $16.68M, down 12.63% in 24 hours. That tells you the leveraged longs are already getting flushed out
The level that matters is $0.0956. A clean reclaim opens the door toward $0.11. Lose $0.0687 and the structure breaks
Above $0.0956 and I'm watching $0.11 first, then $0.13. Lose $0.0687 and I'm done. I've bought an airdrop snapshot play before and watched it bleed for a week straight because everyone else had the same idea
$龙虾 is the second chart. And this one is worse. Up 71% on the day, but the 24-hour range is from $0.028 to $0.054. That's a 90% swing. Funding sits at +0.0858% on Binance. Open interest is $86.92M. For a meme coin, that's enormous
The story is ugly. A trader lost $200K in under 20 hours buying the top and selling the bottom. The token surged 244%, then dumped 73% in a single session. Market cap fell below $30M at one point. Binance launched the perpetual contract with up to 5x leverage, and that's what fueled the initial spike
This isn't a chart. It's a slot machine with a withdrawal limit
The level that matters is $0.0549. A clean break above it opens the door toward $0.07. Lose $0.0288 and the bid disappears
Above $0.0549 and I'm watching $0.07 first, then $0.09. Lose $0.0288 and I'm out
$EVAA is the third chart. And it's the opposite of the first two. Down 14% on the day, but up 51% over the past week. Funding is negative at -0.0296%. Shorts are paying longs. The crowd is leaning short even as the token grinds higher
The headline is the listing. Binance Alpha, Binance Futures perpetuals, MEXC, and Gate all listed the token on October 3. That's a massive liquidity injection. But there's a catch. A multi-sig address distributed 2.5 million EVAA to ten addresses in the past ten minutes. That's 37.8% of the circulating supply. That's a red flag, not a green one
The level that matters is $0.8498. A clean break above it opens the door toward $1.00. Lose $0.6774 and the bid thins out
Above $0.8498 and I'm watching $1.00 first, then $1.15. Lose $0.6774 and I'm out
The wider market matters here. Bitcoin is holding near $84,600 after tapping $87,000. Dominance slipped to 58.6% as of October 3, down from nearly 60% a week ago. That's the spine of this whole trade
When dominance falls while the aggregate cap rises, the marginal dollar moves down the risk curve. The Altcoin Season Index is at 61 out of 100. A month ago it was 23. Still below the 75 threshold that confirms a full rotation, but the direction is clear
Open interest in perpetual futures across crypto is elevated. The crowd is leaning into these new listings and the meme plays. Where I could be wrong is if Bitcoin dominance reclaims 60% and the rotation stalls. Then the late longs get paid and these breakouts fail
I've been on the wrong side of a "confirmed breakout" before. The chart looked perfect, every box checked, and then the bid vanished. That's why I don't trust a wick at the high
The levels are the levels. The tape will tell you which ones matter.
How much of this rotation did you actually catch, and how much did you watch from the sidelines?
233
·
--
Guys this chart flipped its structure last week
$CHR bounced hard off 0.02078 and is quietly building a base. I've bought this exact pattern before, only to get chopped out when volume dries up.
Buy Zone: 0.02200 to 0.02250
TP1: 0.02400
TP2: 0.02596
Invalidation: 0.02070
If $CHR doesn't come to my zone, I don't force it
Are you adding to your $CHR bags here? 🤔
Follow for elite spot setups.
{spot}(CHRUSDT)
#CHRUSDT
Guys this chart flipped its structure last week
$CHR bounced hard off 0.02078 and is quietly building a base. I've bought this exact pattern before, only to get chopped out when volume dries up.
Buy Zone: 0.02200 to 0.02250
TP1: 0.02400
TP2: 0.02596
Invalidation: 0.02070
If $CHR doesn't come to my zone, I don't force it
Are you adding to your $CHR bags here? 🤔
Follow for elite spot setups.
#CHRUSDT
$CHR bounced hard off 0.02078 and is quietly building a base. I've bought this exact pattern before, only to get chopped out when volume dries up.
Buy Zone: 0.02200 to 0.02250
TP1: 0.02400
TP2: 0.02596
Invalidation: 0.02070
If $CHR doesn't come to my zone, I don't force it
Are you adding to your $CHR bags here? 🤔
Follow for elite spot setups.
#CHRUSDT
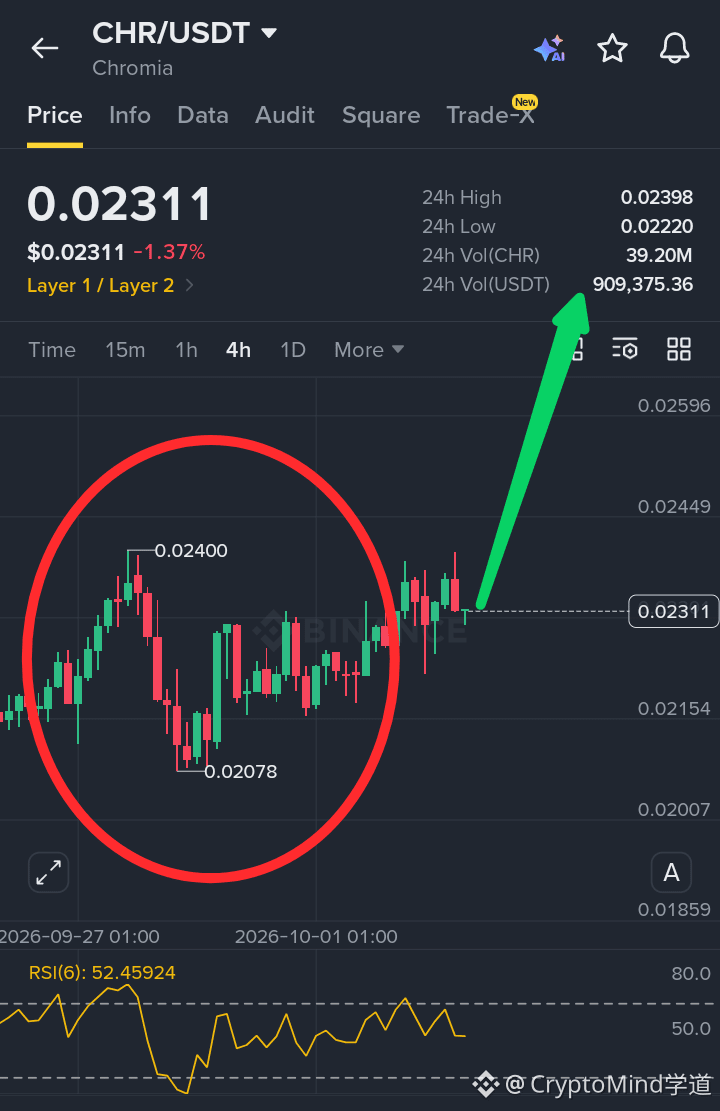
48
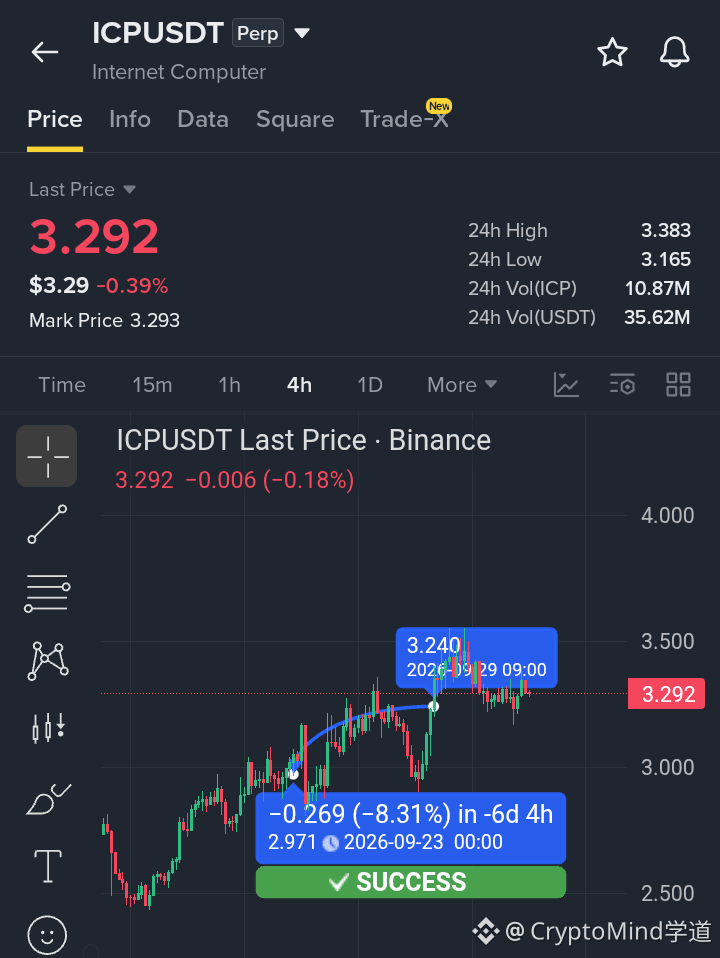
·
--
Article
I Watched $570 Million Vanish in an HourI was about to close my laptop on Thursday night when the alert hit. Bitcoin had just touched $87,200. Ten minutes later it was under $85,000. I sat back down.
A friend called me at 11 p.m. His voice was different. He'd been long since $82K, leveraged, feeling smart. He wasn't feeling smart anymore.
Over $570 million in crypto positions were liquidated in the 24 hours ending October 2. In one single hour, $186 million got wiped out. Ninety-nine percent of those forced closures were longs. People who bet on higher prices, destroyed in minutes.
I've been on that side before. Back in 2021, I was long ETH at what I thought was a sure thing. The funding was positive, the crowd was euphoric, everything looked perfect. Then a single red candle took me out in under three minutes. I remember refreshing the page like the number would come back. It didn't. That feeling doesn't leave you.
Here's what actually happened.
The U.S. jobs report came out Thursday. September nonfarm payrolls grew by just 29,000 — roughly a third of what consensus expected. Unemployment ticked up to 4.2%. The initial reaction made sense: weak jobs data means the Fed might hold off on rate hikes, which is good for risk assets. Bitcoin jumped from $86,000 to $87,200 in moments.
Then the reversal started.
BTC shed more than $3,000 in a few hours. First $85,500. Then below $84,000. A single Binance liquidation order of nearly $12 million hit the tape. That's not a trader exiting a position. That's a forced sale. A margin call executed at market, no negotiation, no waiting for a better price.
Here's the part nobody's saying.
Everyone's blaming the jobs report. But the report wasn't bearish. It was the excuse. The real setup was the leverage that built up before the data dropped. Open interest on Bitcoin futures had climbed by $2.3 billion in the days leading up to Thursday. Funding rates tripled from around 3% to 10%.
That means traders were paying 10% annualized just to hold long positions. They were that confident. They were that crowded. And they were that vulnerable.
I'm not bearish. I'm just saying the people who got liquidated weren't unlucky. They were positioned badly in a market that punishes that.
The contrarian angle is this: everyone's watching the jobs report headlines, but the real signal was the order book. Glassnode data showed a massive wall of sell orders sitting around $85,000 all week. Once buyers cleared that wall, the remaining sell orders got pulled. That's what let price accelerate upward to $86,857. Then the same thin liquidity that helped the pump made the dump violent. When forced selling hit, there was nothing underneath to catch it.
Liquidation cascades don't tell you direction. They tell you positioning. The longs were positioned for $90K. The market showed them $83K instead.
The level that matters now is $85,000.
BTC broke above it during Friday's short squeeze, triggering $122 million in short liquidations. That's the flip side of Thursday's pain. The same mechanism that destroyed longs on Thursday destroyed shorts on Friday. Over $210 million in shorts across crypto got liquidated when BTC pushed back toward $87,000.
If $85,000 holds as support on a daily close, the shorts that just got liquidated will start rebuilding. They'll cluster above $87,000. If the pattern holds, those clusters become the fuel for the next squeeze.
If $85,000 breaks? The forced buying that drove Friday's rally disappears. The spot bid underneath was thin. The same cascade can run in reverse. Again.
What's happening on the whale side tells a different story. Bitcoin whales reduced their holdings by about 30,000 BTC — roughly $2.52 billion — during the recent sideways stretch. Ethereum whales added 60,000 ETH, about $162 million. XRP whales stayed flat.
That's not a uniform signal. It's a market where big money is rotating, not accumulating everything. Bitcoin gets sold. Ethereum gets bought. $XRP gets watched.
The crypto fear and greed index sits at 72. Greed. Two points down from yesterday. Still greed.
$BTC $ETH $ZEC
#bitcoin #crypto #liquidation
The move was real. $570 million in forced closes is real. But real moves still need a base to stand on. And right now, the base is $85,000. Everything above it is leverage and hope. Everything below it is a vacuum.
If you got liquidated Thursday night, did you learn something — or did you just get angry?
I Watched $570 Million Vanish in an Hour
I was about to close my laptop on Thursday night when the alert hit. Bitcoin had just touched $87,200. Ten minutes later it was under $85,000. I sat back down.
A friend called me at 11 p.m. His voice was different. He'd been long since $82K, leveraged, feeling smart. He wasn't feeling smart anymore.
Over $570 million in crypto positions were liquidated in the 24 hours ending October 2. In one single hour, $186 million got wiped out. Ninety-nine percent of those forced closures were longs. People who bet on higher prices, destroyed in minutes.
I've been on that side before. Back in 2021, I was long ETH at what I thought was a sure thing. The funding was positive, the crowd was euphoric, everything looked perfect. Then a single red candle took me out in under three minutes. I remember refreshing the page like the number would come back. It didn't. That feeling doesn't leave you.
Here's what actually happened.
The U.S. jobs report came out Thursday. September nonfarm payrolls grew by just 29,000 — roughly a third of what consensus expected. Unemployment ticked up to 4.2%. The initial reaction made sense: weak jobs data means the Fed might hold off on rate hikes, which is good for risk assets. Bitcoin jumped from $86,000 to $87,200 in moments.
Then the reversal started.
BTC shed more than $3,000 in a few hours. First $85,500. Then below $84,000. A single Binance liquidation order of nearly $12 million hit the tape. That's not a trader exiting a position. That's a forced sale. A margin call executed at market, no negotiation, no waiting for a better price.
Here's the part nobody's saying.
Everyone's blaming the jobs report. But the report wasn't bearish. It was the excuse. The real setup was the leverage that built up before the data dropped. Open interest on Bitcoin futures had climbed by $2.3 billion in the days leading up to Thursday. Funding rates tripled from around 3% to 10%.
That means traders were paying 10% annualized just to hold long positions. They were that confident. They were that crowded. And they were that vulnerable.
I'm not bearish. I'm just saying the people who got liquidated weren't unlucky. They were positioned badly in a market that punishes that.
The contrarian angle is this: everyone's watching the jobs report headlines, but the real signal was the order book. Glassnode data showed a massive wall of sell orders sitting around $85,000 all week. Once buyers cleared that wall, the remaining sell orders got pulled. That's what let price accelerate upward to $86,857. Then the same thin liquidity that helped the pump made the dump violent. When forced selling hit, there was nothing underneath to catch it.
Liquidation cascades don't tell you direction. They tell you positioning. The longs were positioned for $90K. The market showed them $83K instead.
The level that matters now is $85,000.
BTC broke above it during Friday's short squeeze, triggering $122 million in short liquidations. That's the flip side of Thursday's pain. The same mechanism that destroyed longs on Thursday destroyed shorts on Friday. Over $210 million in shorts across crypto got liquidated when BTC pushed back toward $87,000.
If $85,000 holds as support on a daily close, the shorts that just got liquidated will start rebuilding. They'll cluster above $87,000. If the pattern holds, those clusters become the fuel for the next squeeze.
If $85,000 breaks? The forced buying that drove Friday's rally disappears. The spot bid underneath was thin. The same cascade can run in reverse. Again.
What's happening on the whale side tells a different story. Bitcoin whales reduced their holdings by about 30,000 BTC — roughly $2.52 billion — during the recent sideways stretch. Ethereum whales added 60,000 ETH, about $162 million. XRP whales stayed flat.
That's not a uniform signal. It's a market where big money is rotating, not accumulating everything. Bitcoin gets sold. Ethereum gets bought. $XRP gets watched.
The crypto fear and greed index sits at 72. Greed. Two points down from yesterday. Still greed.
$BTC $ETH $ZEC
#bitcoin #crypto #liquidation
The move was real. $570 million in forced closes is real. But real moves still need a base to stand on. And right now, the base is $85,000. Everything above it is leverage and hope. Everything below it is a vacuum.
If you got liquidated Thursday night, did you learn something — or did you just get angry?
A friend called me at 11 p.m. His voice was different. He'd been long since $82K, leveraged, feeling smart. He wasn't feeling smart anymore.
Over $570 million in crypto positions were liquidated in the 24 hours ending October 2. In one single hour, $186 million got wiped out. Ninety-nine percent of those forced closures were longs. People who bet on higher prices, destroyed in minutes.
I've been on that side before. Back in 2021, I was long ETH at what I thought was a sure thing. The funding was positive, the crowd was euphoric, everything looked perfect. Then a single red candle took me out in under three minutes. I remember refreshing the page like the number would come back. It didn't. That feeling doesn't leave you.
Here's what actually happened.
The U.S. jobs report came out Thursday. September nonfarm payrolls grew by just 29,000 — roughly a third of what consensus expected. Unemployment ticked up to 4.2%. The initial reaction made sense: weak jobs data means the Fed might hold off on rate hikes, which is good for risk assets. Bitcoin jumped from $86,000 to $87,200 in moments.
Then the reversal started.
BTC shed more than $3,000 in a few hours. First $85,500. Then below $84,000. A single Binance liquidation order of nearly $12 million hit the tape. That's not a trader exiting a position. That's a forced sale. A margin call executed at market, no negotiation, no waiting for a better price.
Here's the part nobody's saying.
Everyone's blaming the jobs report. But the report wasn't bearish. It was the excuse. The real setup was the leverage that built up before the data dropped. Open interest on Bitcoin futures had climbed by $2.3 billion in the days leading up to Thursday. Funding rates tripled from around 3% to 10%.
That means traders were paying 10% annualized just to hold long positions. They were that confident. They were that crowded. And they were that vulnerable.
I'm not bearish. I'm just saying the people who got liquidated weren't unlucky. They were positioned badly in a market that punishes that.
The contrarian angle is this: everyone's watching the jobs report headlines, but the real signal was the order book. Glassnode data showed a massive wall of sell orders sitting around $85,000 all week. Once buyers cleared that wall, the remaining sell orders got pulled. That's what let price accelerate upward to $86,857. Then the same thin liquidity that helped the pump made the dump violent. When forced selling hit, there was nothing underneath to catch it.
Liquidation cascades don't tell you direction. They tell you positioning. The longs were positioned for $90K. The market showed them $83K instead.
The level that matters now is $85,000.
BTC broke above it during Friday's short squeeze, triggering $122 million in short liquidations. That's the flip side of Thursday's pain. The same mechanism that destroyed longs on Thursday destroyed shorts on Friday. Over $210 million in shorts across crypto got liquidated when BTC pushed back toward $87,000.
If $85,000 holds as support on a daily close, the shorts that just got liquidated will start rebuilding. They'll cluster above $87,000. If the pattern holds, those clusters become the fuel for the next squeeze.
If $85,000 breaks? The forced buying that drove Friday's rally disappears. The spot bid underneath was thin. The same cascade can run in reverse. Again.
What's happening on the whale side tells a different story. Bitcoin whales reduced their holdings by about 30,000 BTC — roughly $2.52 billion — during the recent sideways stretch. Ethereum whales added 60,000 ETH, about $162 million. XRP whales stayed flat.
That's not a uniform signal. It's a market where big money is rotating, not accumulating everything. Bitcoin gets sold. Ethereum gets bought. $XRP gets watched.
The crypto fear and greed index sits at 72. Greed. Two points down from yesterday. Still greed.
$BTC $ETH $ZEC
#bitcoin #crypto #liquidation
The move was real. $570 million in forced closes is real. But real moves still need a base to stand on. And right now, the base is $85,000. Everything above it is leverage and hope. Everything below it is a vacuum.
If you got liquidated Thursday night, did you learn something — or did you just get angry?
224
Log in to explore more content
Join global crypto users on Binance Square
⚡️ Get latest and useful information about crypto.
💬 Trusted by the world’s largest crypto exchange.
👍 Discover real insights from verified creators.
အီးမေးလ် / ဖုန်းနံပါတ်
ရေပန်းစားနေသော ခေါင်းစဉ်များ
DriftHackVictimsBeginClaims
7,363 views
132 Discussing
#DriftHackVictimsBeginClaims
El Drift Protocol, el destacado intercambio de futuros perpetuos descentralizado basado en Solana, abrió oficialmente su portal de reclamaciones y redenciones para el token de recuperación DFX. Esta medida busca compensar a los usuarios afectados por el devastador hackeo masivo del 1 de abril, que drenó aproximadamente 295.4 millones de dólares de la plataforma en un ataque perpetrado por actores vinculados a Corea del Norte. Los afectados recibirán un token DFX por cada USDT de pérdida verificada en la instantánea (snapshot) de ese día. Sin embargo, la asignación inicial del fondo de recuperación, que cuenta con unos 3.11 millones de USDT, sitúa la tasa de redención inicial en apenas 0.0104 USDT por cada DFX; es decir, los usuarios recibirán aproximadamente un centavo por cada dólar perdido en esta primera fase. Los afectados tienen hasta el 1 de enero de 2028 para reclamar sus tokens a través del portal oficial, fecha tras la cual todo el suministro de DFX que no haya sido reclamado será quemado de forma permanente.
A continuación se presentan imágenes reales relacionadas con portales y anuncios de alertas financieras digitales:
WorldWideWeb The World ARPANET Archie EFF
·နှစ်သက်မှု 1 ခု
·252 views
SolanaTokenizedStockVolumeTops$4.4BInSeptember
1,491 views
18 Discussing
BitcoinSpotETFsDraw$6.34BInflowsInQ3
9,354 views
131 Discussing