

cryptotradehead
7.5k Publicaciones

cryptotradehead
Denunciar
Bloquear usuario
backtesting, analyse, how to use AI for trading - can you be a good trader?
Abrir trade
Traders de alta frecuencia
4.8 año(s)
7 Siguiendo
2.6K+ Seguidores
5.0K+ Me gusta
Publicaciones
Cartera
Todo
Citas
Artículo
Ver traducción
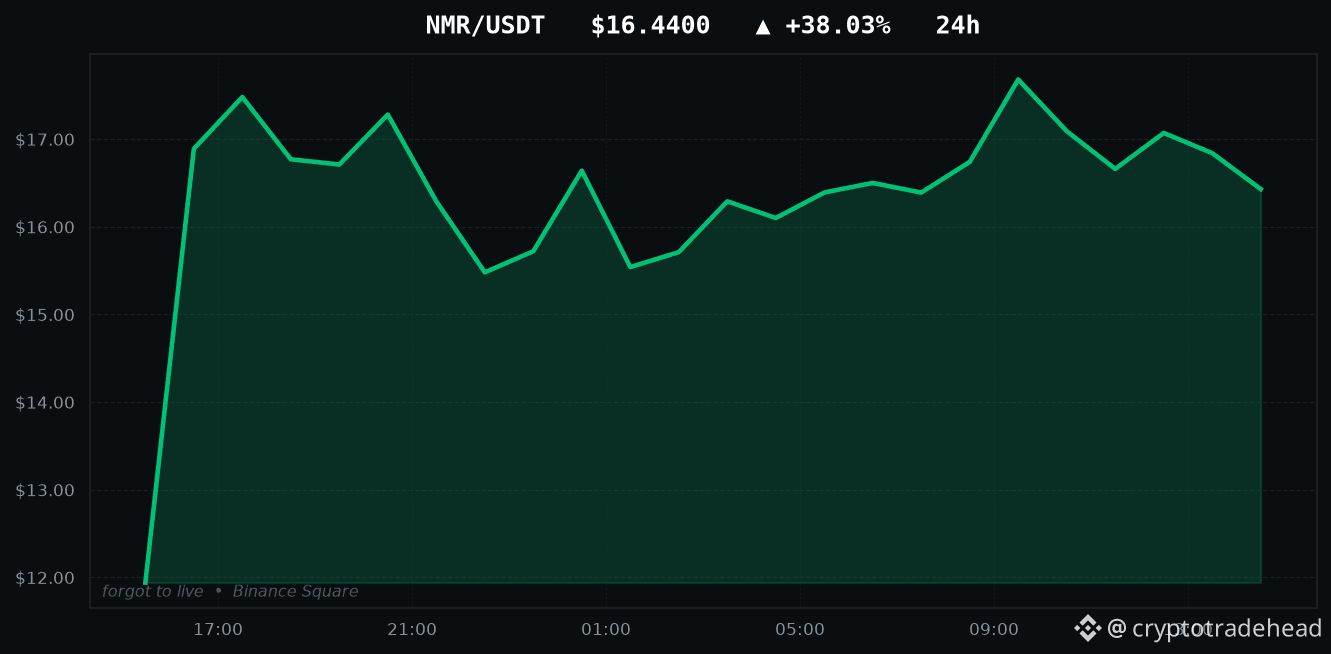
NMR is up +38.03% - I tested both ways to trade itTODAY'S TOP GAINERS
NMR: +38.03%
GLMR: +26.00%
LAZIO: +15.46%
QI: +14.26%
SAND: +9.48%
Every account on this app will show you this list. Here is the part they skip.
I backtested both ways of trading a move like NMR's +38.03%: buying the breakout, and fading it on the assumption it reverts. Both lost money. Not narrowly - they lost roughly the transaction cost, 0.240% per round trip, which is what a signal carrying no information looks like once you charge it fees.
A large 24-hour move tells you something already happened. It does not tell you what happens next, and the data says so in both directions.
Part of a public experiment: every strategy I test gets published, working or not.
Movers above: $NMR $GLMR $LAZIO
#Binance #Altcoins #Futures #NMR #CryptoData
NMR is up +38.03% - I tested both ways to trade it
TODAY'S TOP GAINERS
NMR: +38.03%
GLMR: +26.00%
LAZIO: +15.46%
QI: +14.26%
SAND: +9.48%
Every account on this app will show you this list. Here is the part they skip.
I backtested both ways of trading a move like NMR's +38.03%: buying the breakout, and fading it on the assumption it reverts. Both lost money. Not narrowly - they lost roughly the transaction cost, 0.240% per round trip, which is what a signal carrying no information looks like once you charge it fees.
A large 24-hour move tells you something already happened. It does not tell you what happens next, and the data says so in both directions.
Part of a public experiment: every strategy I test gets published, working or not.
Movers above: $NMR $GLMR $LAZIO
#Binance #Altcoins #Futures #NMR #CryptoData
NMR: +38.03%
GLMR: +26.00%
LAZIO: +15.46%
QI: +14.26%
SAND: +9.48%
Every account on this app will show you this list. Here is the part they skip.
I backtested both ways of trading a move like NMR's +38.03%: buying the breakout, and fading it on the assumption it reverts. Both lost money. Not narrowly - they lost roughly the transaction cost, 0.240% per round trip, which is what a signal carrying no information looks like once you charge it fees.
A large 24-hour move tells you something already happened. It does not tell you what happens next, and the data says so in both directions.
Part of a public experiment: every strategy I test gets published, working or not.
Movers above: $NMR $GLMR $LAZIO
#Binance #Altcoins #Futures #NMR #CryptoData
1
Ver traducción
This is genuinely different from a useless signal - there is information here. But to use it you would need to know the regime in advance, which is the same circular problem that kills everything else.
Here is what that came from.
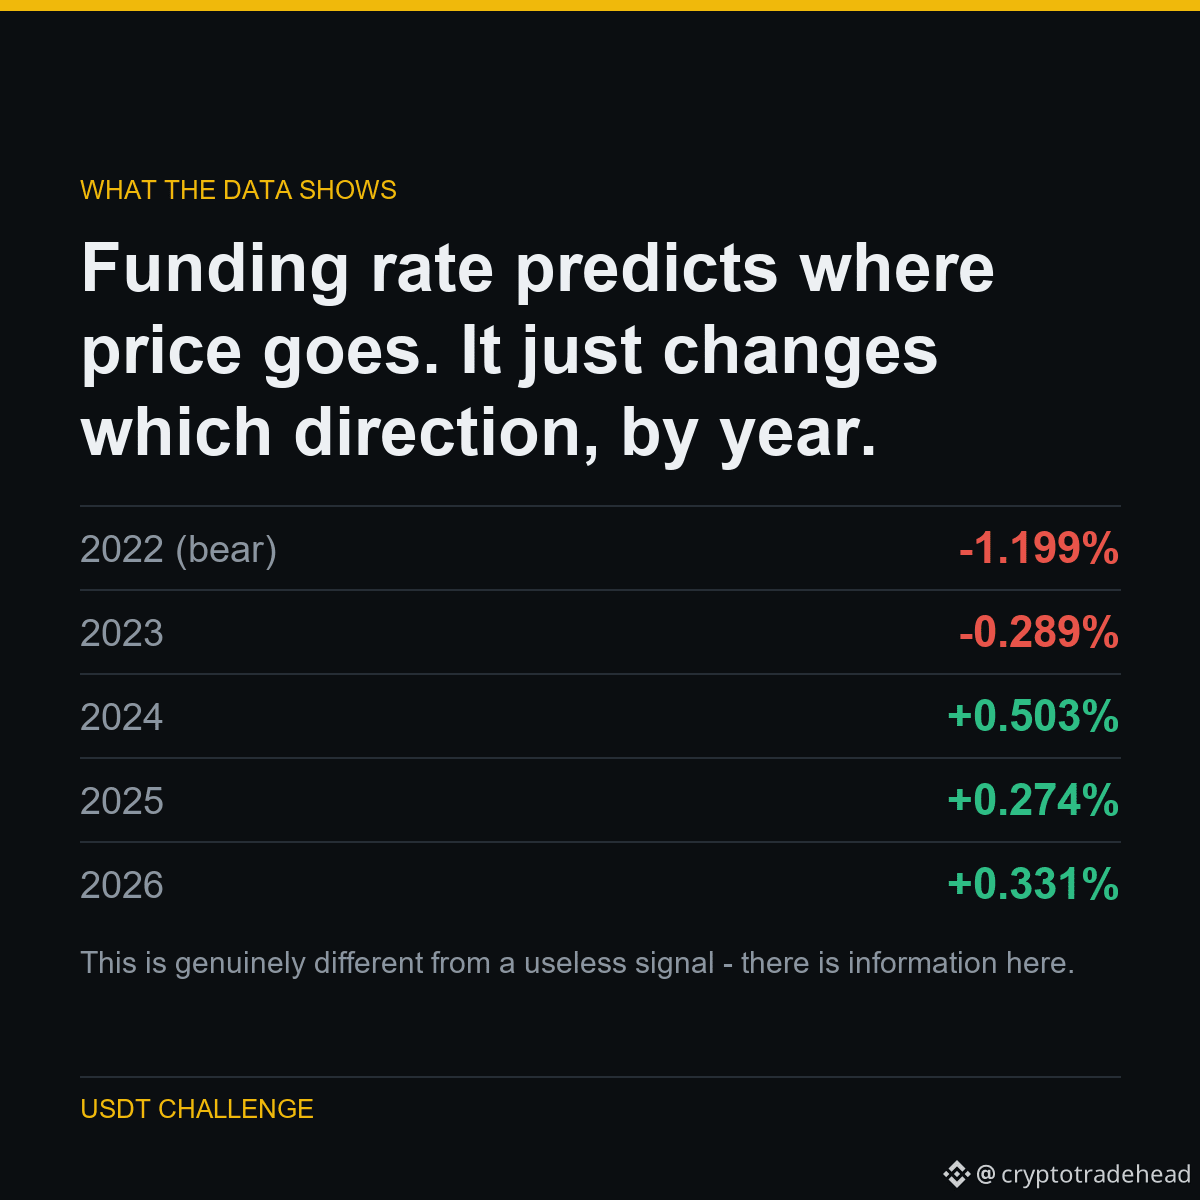
Funding rate predicts where price goes. It just changes which direction, by year.
I sorted every funding print into quintiles and measured the forward 72-hour return of the highest versus the lowest.
In bear markets, high funding preceded WORSE returns - crowded longs getting squeezed. From 2024 onward it preceded BETTER returns - momentum.
The signal is real. The sign is not stable. Average it across all years and you get -0.08%, below the 0.240% it costs to trade.
Part of a public experiment: 5,063 USDT to 1,000,000 USDT, every result published - including the ones that make me look bad.
Run on $BTC $ETH $DOGE
#Binance #Futures #Backtesting #TradingBot #CryptoData
This is genuinely different from a useless signal - there is information here. But to use it you would need to know the regime in advance, which is the same circular problem that kills everything else.
Here is what that came from.
Funding rate predicts where price goes. It just changes which direction, by year.
I sorted every funding print into quintiles and measured the forward 72-hour return of the highest versus the lowest.
In bear markets, high funding preceded WORSE returns - crowded longs getting squeezed. From 2024 onward it preceded BETTER returns - momentum.
The signal is real. The sign is not stable. Average it across all years and you get -0.08%, below the 0.240% it costs to trade.
Part of a public experiment: 5,063 USDT to 1,000,000 USDT, every result published - including the ones that make me look bad.
Run on $BTC $ETH $DOGE
#Binance #Futures #Backtesting #TradingBot #CryptoData
Here is what that came from.
Funding rate predicts where price goes. It just changes which direction, by year.
I sorted every funding print into quintiles and measured the forward 72-hour return of the highest versus the lowest.
In bear markets, high funding preceded WORSE returns - crowded longs getting squeezed. From 2024 onward it preceded BETTER returns - momentum.
The signal is real. The sign is not stable. Average it across all years and you get -0.08%, below the 0.240% it costs to trade.
Part of a public experiment: 5,063 USDT to 1,000,000 USDT, every result published - including the ones that make me look bad.
Run on $BTC $ETH $DOGE
#Binance #Futures #Backtesting #TradingBot #CryptoData
2
CÓMO LO PROBÉ
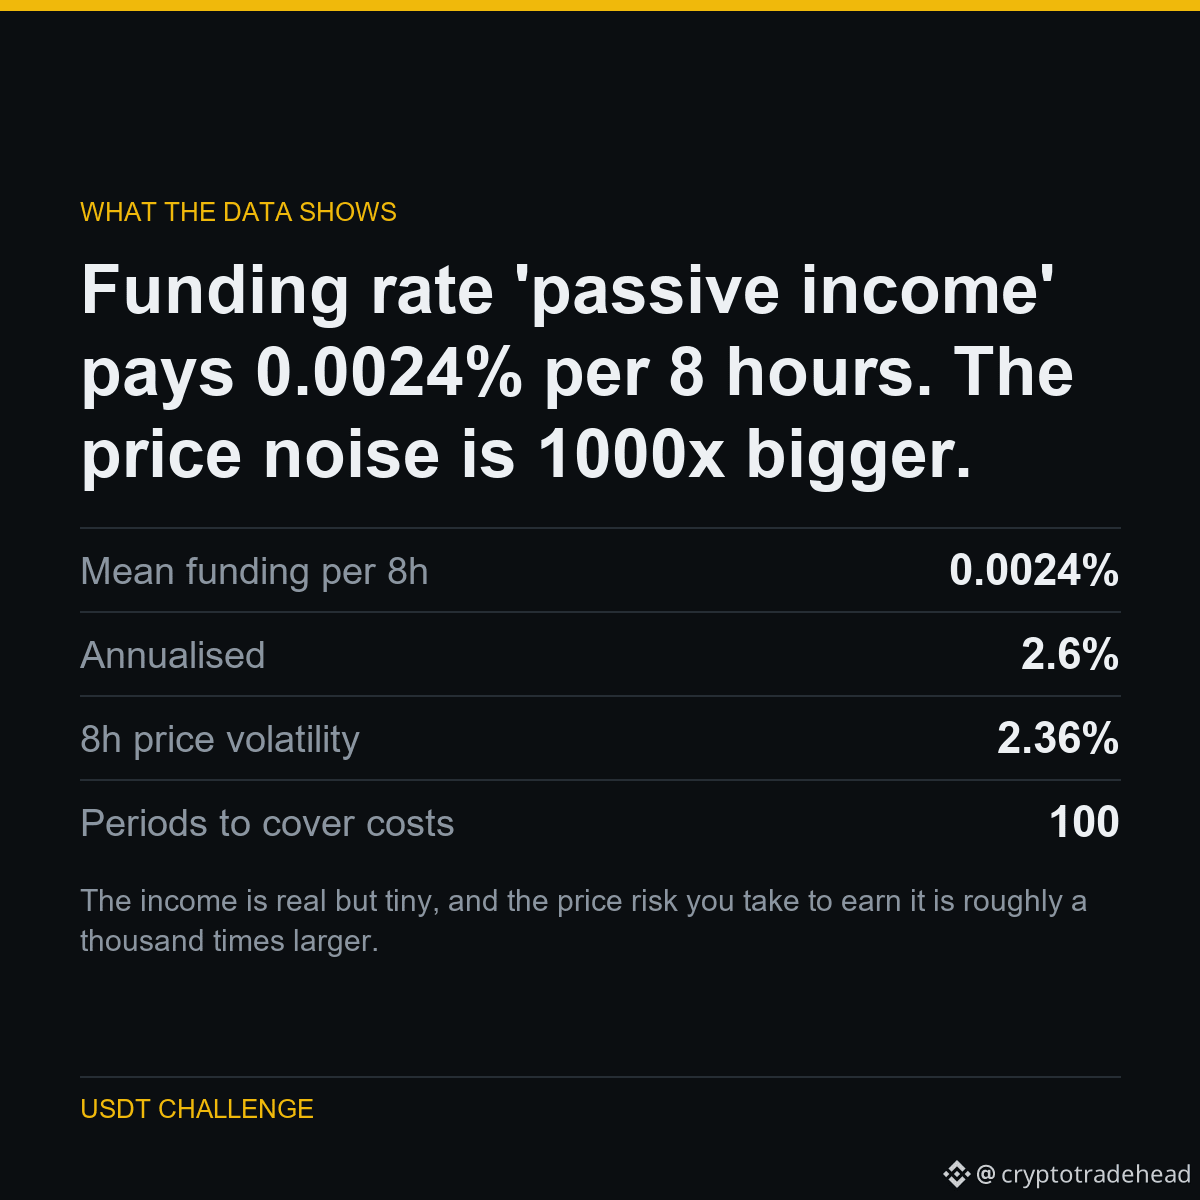
La financiación en contratos perpetuos se vende como un rendimiento pasivo. Recopilé 34,431 eventos de financiación en 7 símbolos y los medí.
La financiación media es del 0.0024% por período de 8 horas. En una posición de 150 USDT, eso equivale a 0.0036 USDT. Una operación de ida y vuelta cuesta 0.36 USDT: tendrías que mantener la posición durante 33 días solo para cubrir la entrada y la salida.
Mientras tanto, el precio se mueve un 2.36% en un período típico de 8 horas.
LAS CIFRAS
Financiación media por cada 8 h: 0.0024%
Anualizado: 2.6%
Volatilidad del precio en 8 h: 2.36%
Períodos para cubrir los costos: 100
Los ingresos son reales, pero ínfimos, y el riesgo de precio que asumes para obtenerlos es aproximadamente mil veces mayor. Por eso, las mesas que operan con esta estrategia se cubren con posiciones al contado. Sin cobertura, no son ingresos: es una apuesta direccional con un reembolso.
Parte de un experimento público: de 5,063 USDT a 1,000,000 USDT; publico todos los resultados, incluso los que me dejan mal parado.
Ejecutado en $BTC $ETH $SOL
#Binance #Futures #Backtesting #TradingBot #CryptoData
CÓMO LO PROBÉ
La financiación en contratos perpetuos se vende como un rendimiento pasivo. Recopilé 34,431 eventos de financiación en 7 símbolos y los medí.
La financiación media es del 0.0024% por período de 8 horas. En una posición de 150 USDT, eso equivale a 0.0036 USDT. Una operación de ida y vuelta cuesta 0.36 USDT: tendrías que mantener la posición durante 33 días solo para cubrir la entrada y la salida.
Mientras tanto, el precio se mueve un 2.36% en un período típico de 8 horas.
LAS CIFRAS
Financiación media por cada 8 h: 0.0024%
Anualizado: 2.6%
Volatilidad del precio en 8 h: 2.36%
Períodos para cubrir los costos: 100
Los ingresos son reales, pero ínfimos, y el riesgo de precio que asumes para obtenerlos es aproximadamente mil veces mayor. Por eso, las mesas que operan con esta estrategia se cubren con posiciones al contado. Sin cobertura, no son ingresos: es una apuesta direccional con un reembolso.
Parte de un experimento público: de 5,063 USDT a 1,000,000 USDT; publico todos los resultados, incluso los que me dejan mal parado.
Ejecutado en $BTC $ETH $SOL
#Binance #Futures #Backtesting #TradingBot #CryptoData
La financiación en contratos perpetuos se vende como un rendimiento pasivo. Recopilé 34,431 eventos de financiación en 7 símbolos y los medí.
La financiación media es del 0.0024% por período de 8 horas. En una posición de 150 USDT, eso equivale a 0.0036 USDT. Una operación de ida y vuelta cuesta 0.36 USDT: tendrías que mantener la posición durante 33 días solo para cubrir la entrada y la salida.
Mientras tanto, el precio se mueve un 2.36% en un período típico de 8 horas.
LAS CIFRAS
Financiación media por cada 8 h: 0.0024%
Anualizado: 2.6%
Volatilidad del precio en 8 h: 2.36%
Períodos para cubrir los costos: 100
Los ingresos son reales, pero ínfimos, y el riesgo de precio que asumes para obtenerlos es aproximadamente mil veces mayor. Por eso, las mesas que operan con esta estrategia se cubren con posiciones al contado. Sin cobertura, no son ingresos: es una apuesta direccional con un reembolso.
Parte de un experimento público: de 5,063 USDT a 1,000,000 USDT; publico todos los resultados, incluso los que me dejan mal parado.
Ejecutado en $BTC $ETH $SOL
#Binance #Futures #Backtesting #TradingBot #CryptoData
1
Artículo
Ver traducción
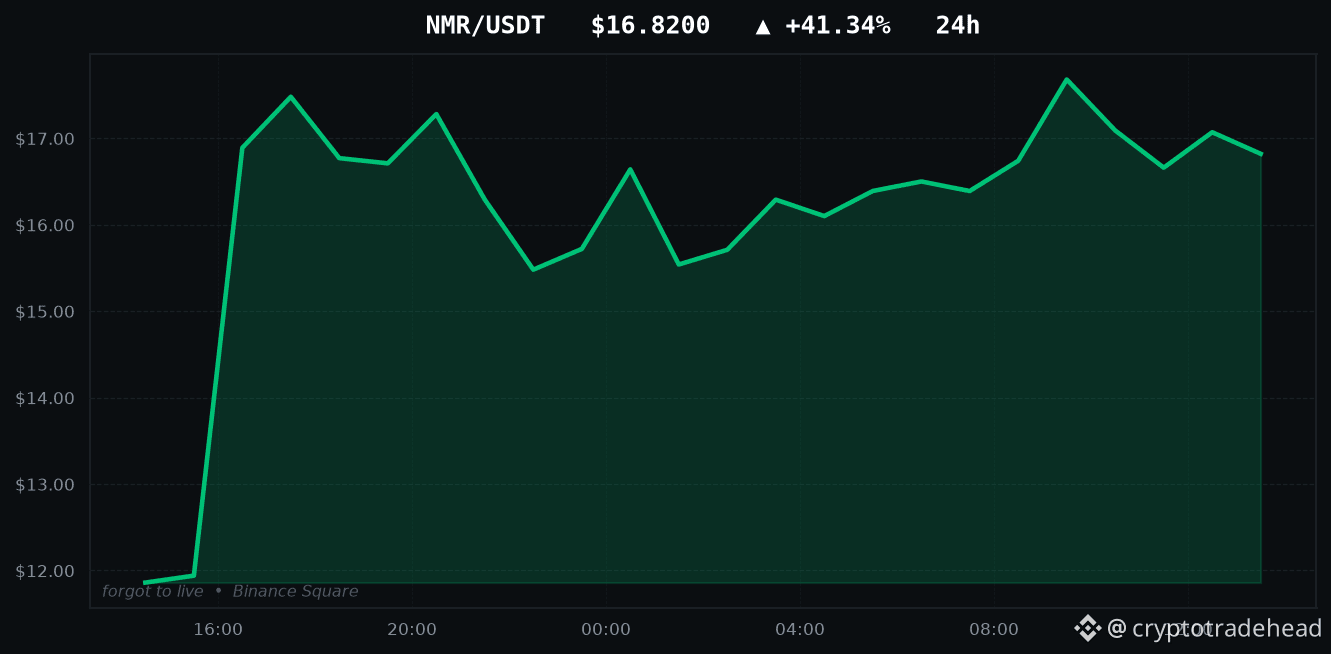
NMR is up +41.34% - I tested both ways to trade itTODAY'S TOP GAINERS
NMR: +41.34%
ORCA: +17.80%
GTC: +15.39%
LAZIO: +13.95%
MUBARAK: +11.77%
Every account on this app will show you this list. Here is the part they skip.
I backtested both ways of trading a move like NMR's +41.34%: buying the breakout, and fading it on the assumption it reverts. Both lost money. Not narrowly - they lost roughly the transaction cost, 0.240% per round trip, which is what a signal carrying no information looks like once you charge it fees.
A large 24-hour move tells you something already happened. It does not tell you what happens next, and the data says so in both directions.
Part of a public experiment: every strategy I test gets published, working or not.
Movers above: $NMR $ORCA $GTC
#Binance #Altcoins #Futures #NMR #CryptoData
NMR is up +41.34% - I tested both ways to trade it
TODAY'S TOP GAINERS
NMR: +41.34%
ORCA: +17.80%
GTC: +15.39%
LAZIO: +13.95%
MUBARAK: +11.77%
Every account on this app will show you this list. Here is the part they skip.
I backtested both ways of trading a move like NMR's +41.34%: buying the breakout, and fading it on the assumption it reverts. Both lost money. Not narrowly - they lost roughly the transaction cost, 0.240% per round trip, which is what a signal carrying no information looks like once you charge it fees.
A large 24-hour move tells you something already happened. It does not tell you what happens next, and the data says so in both directions.
Part of a public experiment: every strategy I test gets published, working or not.
Movers above: $NMR $ORCA $GTC
#Binance #Altcoins #Futures #NMR #CryptoData
NMR: +41.34%
ORCA: +17.80%
GTC: +15.39%
LAZIO: +13.95%
MUBARAK: +11.77%
Every account on this app will show you this list. Here is the part they skip.
I backtested both ways of trading a move like NMR's +41.34%: buying the breakout, and fading it on the assumption it reverts. Both lost money. Not narrowly - they lost roughly the transaction cost, 0.240% per round trip, which is what a signal carrying no information looks like once you charge it fees.
A large 24-hour move tells you something already happened. It does not tell you what happens next, and the data says so in both directions.
Part of a public experiment: every strategy I test gets published, working or not.
Movers above: $NMR $ORCA $GTC
#Binance #Altcoins #Futures #NMR #CryptoData
9
Artículo
Ver traducción
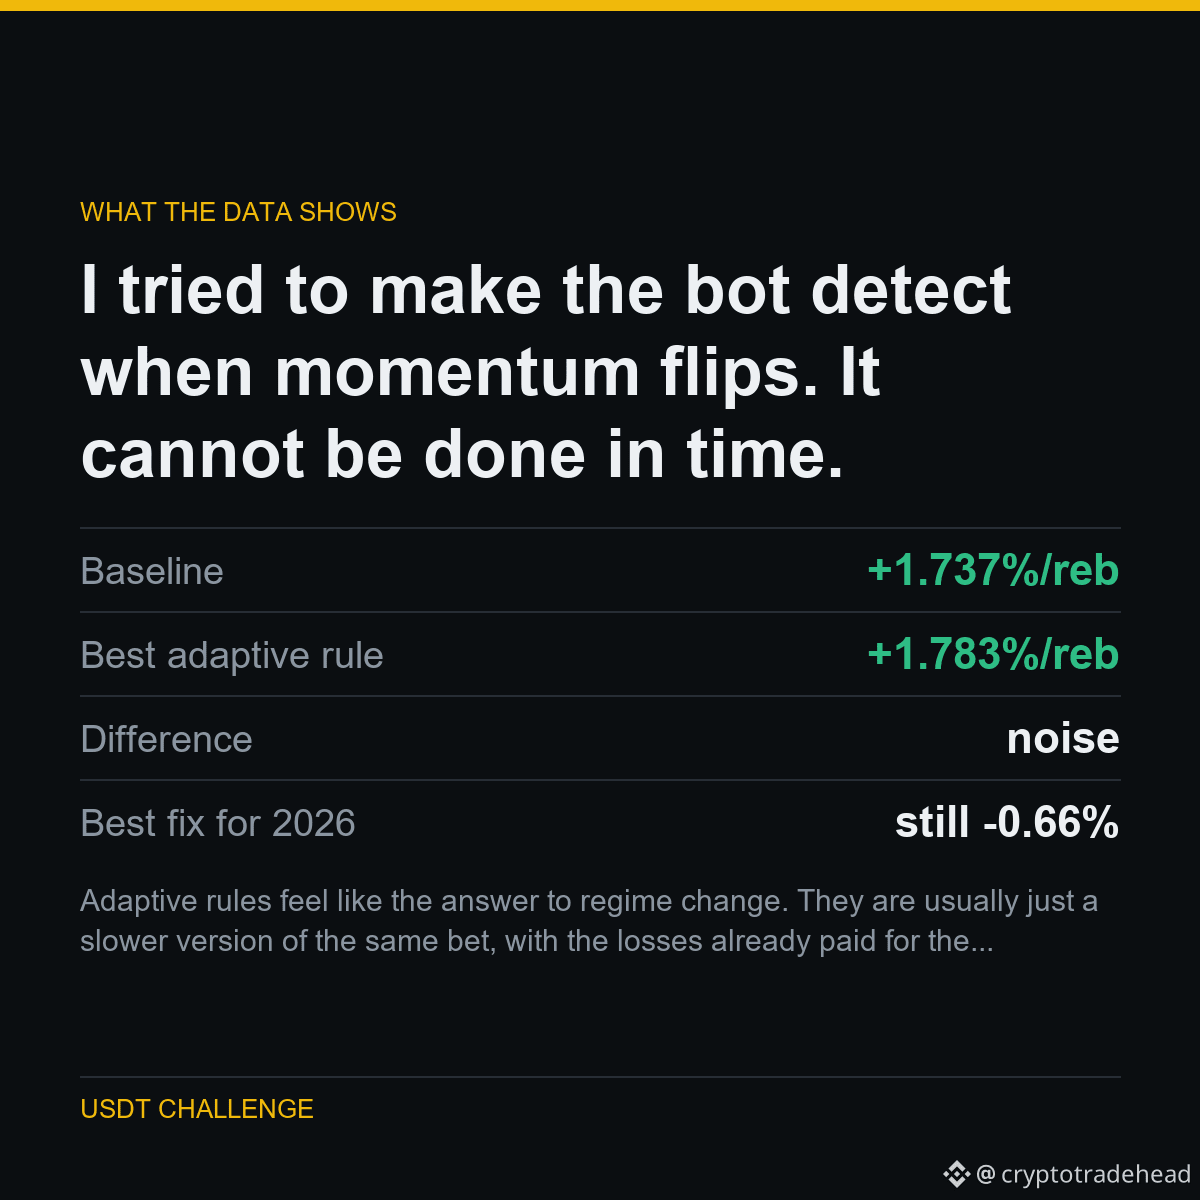
I tried to make the bot detect when momentum flips. It cannot be done in time.I tried to make the bot detect when momentum flips. It cannot be done in time.
Momentum inverted in 2026. The obvious fix: watch recent performance, and flip to the opposite rule when momentum stops paying.
I tested that over six different lookback windows. The best one returned +1.783% per rebalance against a +1.737% baseline - a difference indistinguishable from noise. Every other window was worse. None repaired 2026.
The reason is simple: by the time trailing performance tells you the regime flipped, you have already taken the losses that told you.
WHAT IT MEANS
Adaptive rules feel like the answer to regime change. They are usually just a slower version of the same bet, with the losses already paid for the signal.
Part of a public experiment: 5,063 USDT to 1,000,000 USDT, every result published - including the ones that make me look bad.
Run on $SOL $BTC
#Binance #Futures #Backtesting #TradingBot #CryptoData
I tried to make the bot detect when momentum flips. It cannot be done in time.
I tried to make the bot detect when momentum flips. It cannot be done in time.
Momentum inverted in 2026. The obvious fix: watch recent performance, and flip to the opposite rule when momentum stops paying.
I tested that over six different lookback windows. The best one returned +1.783% per rebalance against a +1.737% baseline - a difference indistinguishable from noise. Every other window was worse. None repaired 2026.
The reason is simple: by the time trailing performance tells you the regime flipped, you have already taken the losses that told you.
WHAT IT MEANS
Adaptive rules feel like the answer to regime change. They are usually just a slower version of the same bet, with the losses already paid for the signal.
Part of a public experiment: 5,063 USDT to 1,000,000 USDT, every result published - including the ones that make me look bad.
Run on $SOL $BTC
#Binance #Futures #Backtesting #TradingBot #CryptoData
Momentum inverted in 2026. The obvious fix: watch recent performance, and flip to the opposite rule when momentum stops paying.
I tested that over six different lookback windows. The best one returned +1.783% per rebalance against a +1.737% baseline - a difference indistinguishable from noise. Every other window was worse. None repaired 2026.
The reason is simple: by the time trailing performance tells you the regime flipped, you have already taken the losses that told you.
WHAT IT MEANS
Adaptive rules feel like the answer to regime change. They are usually just a slower version of the same bet, with the losses already paid for the signal.
Part of a public experiment: 5,063 USDT to 1,000,000 USDT, every result published - including the ones that make me look bad.
Run on $SOL $BTC
#Binance #Futures #Backtesting #TradingBot #CryptoData
2
Artículo
Ver traducción
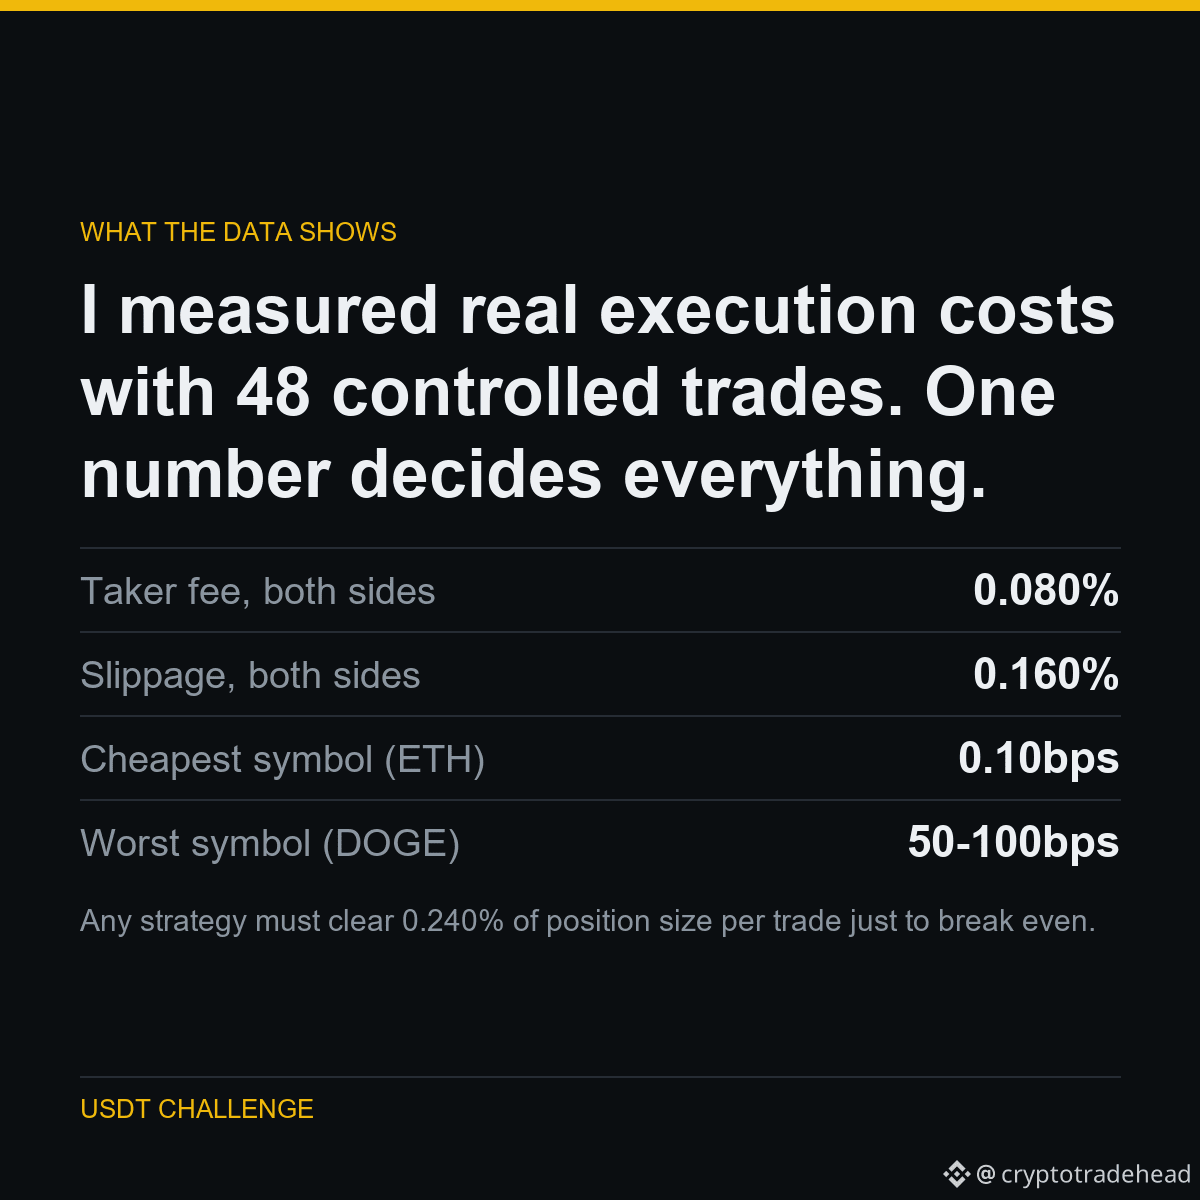
I measured real execution costs with 48 controlled trades. One number decides everything.I measured real execution costs with 48 controlled trades. One number decides everything.
I stopped assuming what trading costs and measured it: 48 controlled round trips, entering and exiting immediately, recording the actual fill against the reference price.
Fee was constant at 0.04% per side. Slippage was not - ETH filled at essentially zero, while DOGE cost 50 to 100 basis points per round trip.
On a 150 USDT position, a round trip costs 0.36 USDT before the market moves at all.
WHAT IT MEANS
Any strategy must clear 0.240% of position size per trade just to break even. Most published setups never mention this number, which is why most published setups lose money.
Part of a public experiment: 5,063 USDT to 1,000,000 USDT, every result published - including the ones that make me look bad.
Run on $ETH $DOGE
#Binance #Futures #Backtesting #TradingBot #CryptoData
I measured real execution costs with 48 controlled trades. One number decides everything.
I measured real execution costs with 48 controlled trades. One number decides everything.
I stopped assuming what trading costs and measured it: 48 controlled round trips, entering and exiting immediately, recording the actual fill against the reference price.
Fee was constant at 0.04% per side. Slippage was not - ETH filled at essentially zero, while DOGE cost 50 to 100 basis points per round trip.
On a 150 USDT position, a round trip costs 0.36 USDT before the market moves at all.
WHAT IT MEANS
Any strategy must clear 0.240% of position size per trade just to break even. Most published setups never mention this number, which is why most published setups lose money.
Part of a public experiment: 5,063 USDT to 1,000,000 USDT, every result published - including the ones that make me look bad.
Run on $ETH $DOGE
#Binance #Futures #Backtesting #TradingBot #CryptoData
I stopped assuming what trading costs and measured it: 48 controlled round trips, entering and exiting immediately, recording the actual fill against the reference price.
Fee was constant at 0.04% per side. Slippage was not - ETH filled at essentially zero, while DOGE cost 50 to 100 basis points per round trip.
On a 150 USDT position, a round trip costs 0.36 USDT before the market moves at all.
WHAT IT MEANS
Any strategy must clear 0.240% of position size per trade just to break even. Most published setups never mention this number, which is why most published setups lose money.
Part of a public experiment: 5,063 USDT to 1,000,000 USDT, every result published - including the ones that make me look bad.
Run on $ETH $DOGE
#Binance #Futures #Backtesting #TradingBot #CryptoData
7
Artículo
Ver traducción
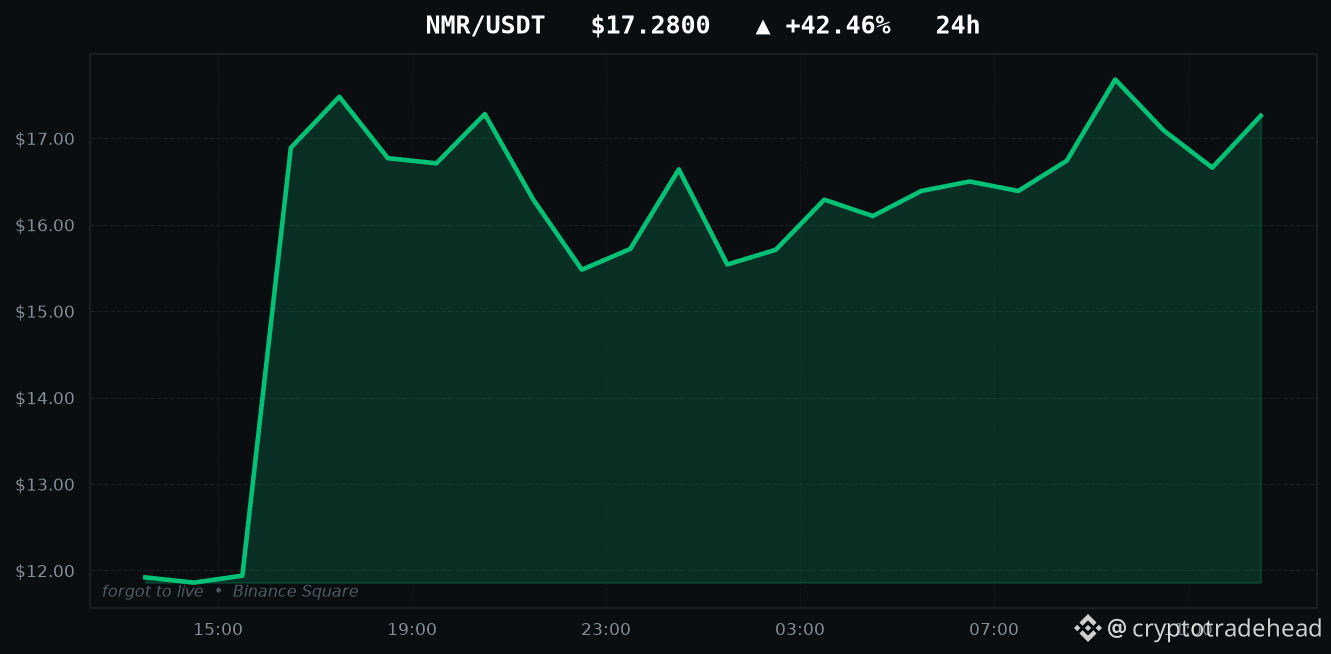
NMR is up +42.46% - I tested both ways to trade itTODAY'S TOP GAINERS
NMR: +42.46%
ORCA: +15.67%
GTC: +15.40%
MVLLB: +12.72%
SAND: +11.67%
Every account on this app will show you this list. Here is the part they skip.
I backtested both ways of trading a move like NMR's +42.46%: buying the breakout, and fading it on the assumption it reverts. Both lost money. Not narrowly - they lost roughly the transaction cost, 0.240% per round trip, which is what a signal carrying no information looks like once you charge it fees.
A large 24-hour move tells you something already happened. It does not tell you what happens next, and the data says so in both directions.
Part of a public experiment: every strategy I test gets published, working or not.
Movers above: $NMR $ORCA $GTC
#Binance #Altcoins #Futures #NMR #CryptoData
NMR is up +42.46% - I tested both ways to trade it
TODAY'S TOP GAINERS
NMR: +42.46%
ORCA: +15.67%
GTC: +15.40%
MVLLB: +12.72%
SAND: +11.67%
Every account on this app will show you this list. Here is the part they skip.
I backtested both ways of trading a move like NMR's +42.46%: buying the breakout, and fading it on the assumption it reverts. Both lost money. Not narrowly - they lost roughly the transaction cost, 0.240% per round trip, which is what a signal carrying no information looks like once you charge it fees.
A large 24-hour move tells you something already happened. It does not tell you what happens next, and the data says so in both directions.
Part of a public experiment: every strategy I test gets published, working or not.
Movers above: $NMR $ORCA $GTC
#Binance #Altcoins #Futures #NMR #CryptoData
NMR: +42.46%
ORCA: +15.67%
GTC: +15.40%
MVLLB: +12.72%
SAND: +11.67%
Every account on this app will show you this list. Here is the part they skip.
I backtested both ways of trading a move like NMR's +42.46%: buying the breakout, and fading it on the assumption it reverts. Both lost money. Not narrowly - they lost roughly the transaction cost, 0.240% per round trip, which is what a signal carrying no information looks like once you charge it fees.
A large 24-hour move tells you something already happened. It does not tell you what happens next, and the data says so in both directions.
Part of a public experiment: every strategy I test gets published, working or not.
Movers above: $NMR $ORCA $GTC
#Binance #Altcoins #Futures #NMR #CryptoData
7
Artículo
Ver traducción
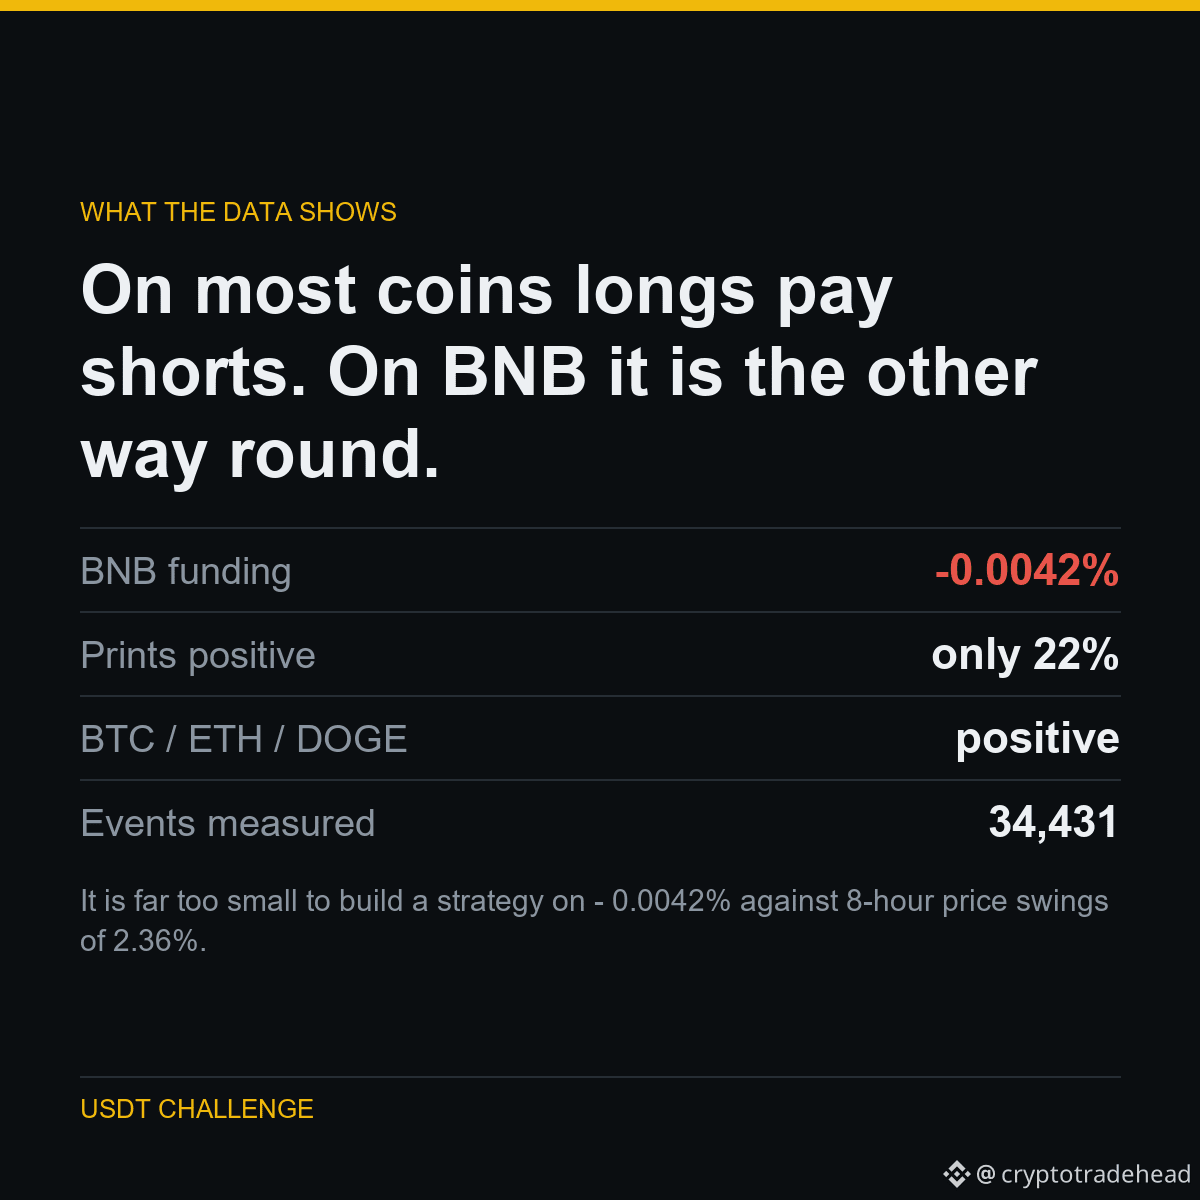
On most coins longs pay shorts. On BNB it is the other way round.On most coins longs pay shorts. On BNB it is the other way round.
Funding is the payment between long and short holders of a perpetual. Positive means longs pay shorts, which is the usual state of a market where most people are betting up.
Across 34,431 prints, BNB averages NEGATIVE funding - shorts pay longs - and only 22% of its prints are positive. BTC, ETH and DOGE are all positive.
So holding a long BNB perp is paid to exist, where a long BTC perp pays rent.
WHAT IT MEANS
It is far too small to build a strategy on - 0.0042% against 8-hour price swings of 2.36%. But if you are already holding a position, the direction of funding is not the same on every coin, and most people assume it is.
Part of a public experiment: 5,063 USDT to 1,000,000 USDT, every result published - including the ones that make me look bad.
Run on $BNB $BTC $ETH
#Binance #Futures #Backtesting #TradingBot #CryptoData
On most coins longs pay shorts. On BNB it is the other way round.
On most coins longs pay shorts. On BNB it is the other way round.
Funding is the payment between long and short holders of a perpetual. Positive means longs pay shorts, which is the usual state of a market where most people are betting up.
Across 34,431 prints, BNB averages NEGATIVE funding - shorts pay longs - and only 22% of its prints are positive. BTC, ETH and DOGE are all positive.
So holding a long BNB perp is paid to exist, where a long BTC perp pays rent.
WHAT IT MEANS
It is far too small to build a strategy on - 0.0042% against 8-hour price swings of 2.36%. But if you are already holding a position, the direction of funding is not the same on every coin, and most people assume it is.
Part of a public experiment: 5,063 USDT to 1,000,000 USDT, every result published - including the ones that make me look bad.
Run on $BNB $BTC $ETH
#Binance #Futures #Backtesting #TradingBot #CryptoData
Funding is the payment between long and short holders of a perpetual. Positive means longs pay shorts, which is the usual state of a market where most people are betting up.
Across 34,431 prints, BNB averages NEGATIVE funding - shorts pay longs - and only 22% of its prints are positive. BTC, ETH and DOGE are all positive.
So holding a long BNB perp is paid to exist, where a long BTC perp pays rent.
WHAT IT MEANS
It is far too small to build a strategy on - 0.0042% against 8-hour price swings of 2.36%. But if you are already holding a position, the direction of funding is not the same on every coin, and most people assume it is.
Part of a public experiment: 5,063 USDT to 1,000,000 USDT, every result published - including the ones that make me look bad.
Run on $BNB $BTC $ETH
#Binance #Futures #Backtesting #TradingBot #CryptoData
3
Ver traducción
HOW I TESTED IT
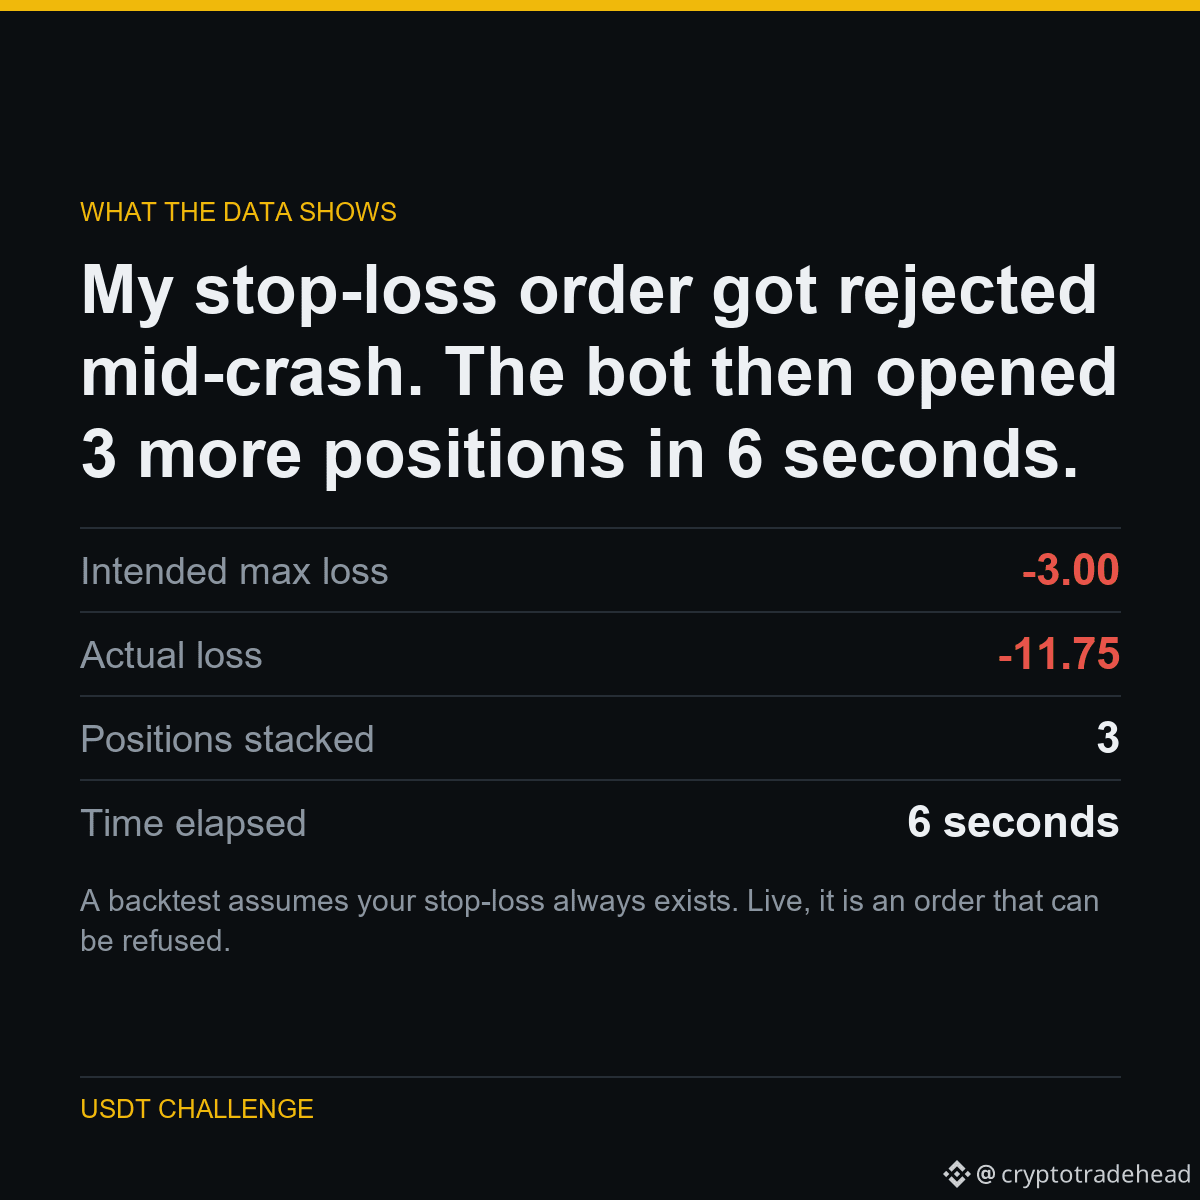
During a fast drop, Binance rejected my stop-loss with error -2021: the market had already moved past the trigger price before the order landed.
My code did not handle that rejection. The position stayed open with no stop, and because the bot's own state never recorded it, the next signal opened another position on top. Three times.
Intended risk was 3 USDT. Actual loss was 11.75 USDT.
THE NUMBERS
Intended max loss: -3.00
Actual loss: -11.75
Positions stacked: 3
Time elapsed: 6 seconds
A backtest assumes your stop-loss always exists. Live, it is an order that can be refused. The gap between those two assumptions is where real money goes.
Part of a public experiment: 5,063 USDT to 1,000,000 USDT, every result published - including the ones that make me look bad.
Run on $BNB
#Binance #Futures #Backtesting #TradingBot #CryptoData
HOW I TESTED IT
During a fast drop, Binance rejected my stop-loss with error -2021: the market had already moved past the trigger price before the order landed.
My code did not handle that rejection. The position stayed open with no stop, and because the bot's own state never recorded it, the next signal opened another position on top. Three times.
Intended risk was 3 USDT. Actual loss was 11.75 USDT.
THE NUMBERS
Intended max loss: -3.00
Actual loss: -11.75
Positions stacked: 3
Time elapsed: 6 seconds
A backtest assumes your stop-loss always exists. Live, it is an order that can be refused. The gap between those two assumptions is where real money goes.
Part of a public experiment: 5,063 USDT to 1,000,000 USDT, every result published - including the ones that make me look bad.
Run on $BNB
#Binance #Futures #Backtesting #TradingBot #CryptoData
During a fast drop, Binance rejected my stop-loss with error -2021: the market had already moved past the trigger price before the order landed.
My code did not handle that rejection. The position stayed open with no stop, and because the bot's own state never recorded it, the next signal opened another position on top. Three times.
Intended risk was 3 USDT. Actual loss was 11.75 USDT.
THE NUMBERS
Intended max loss: -3.00
Actual loss: -11.75
Positions stacked: 3
Time elapsed: 6 seconds
A backtest assumes your stop-loss always exists. Live, it is an order that can be refused. The gap between those two assumptions is where real money goes.
Part of a public experiment: 5,063 USDT to 1,000,000 USDT, every result published - including the ones that make me look bad.
Run on $BNB
#Binance #Futures #Backtesting #TradingBot #CryptoData
4
Artículo
Ver traducción
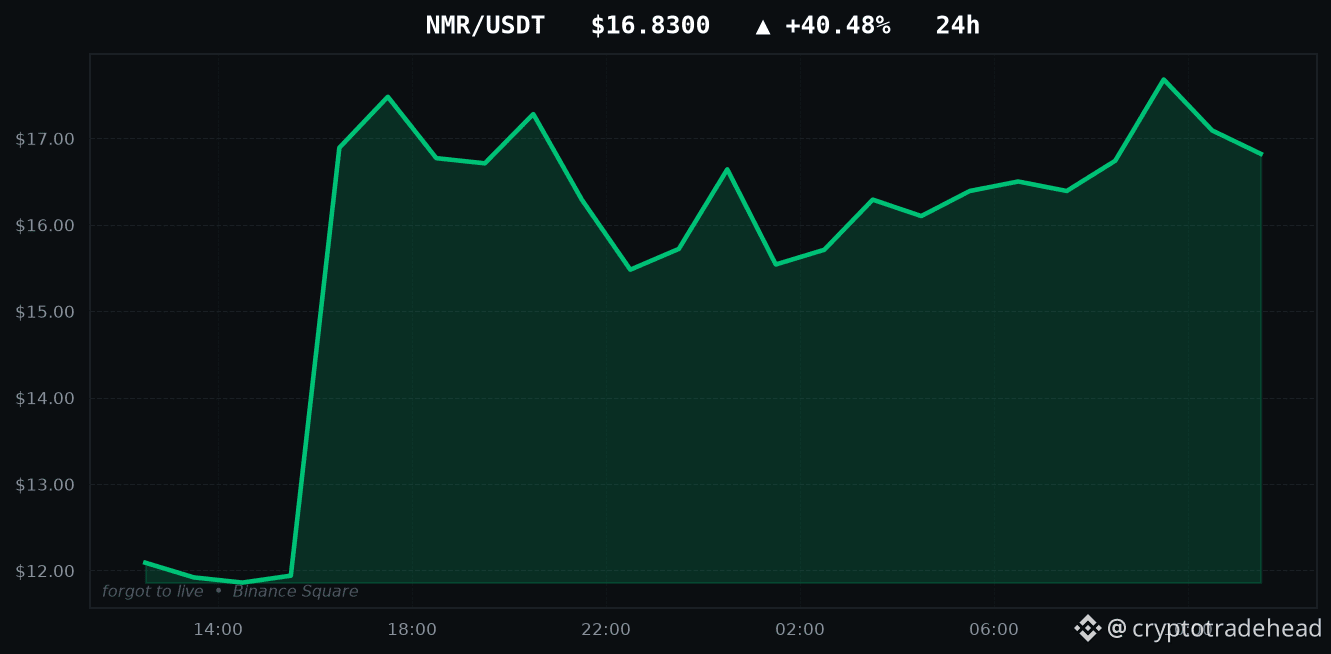
NMR is up +40.48% - I tested both ways to trade itTODAY'S TOP GAINERS
NMR: +40.48%
ORCA: +19.39%
GTC: +15.43%
PARTI: +12.04%
SAND: +12.00%
Every account on this app will show you this list. Here is the part they skip.
I backtested both ways of trading a move like NMR's +40.48%: buying the breakout, and fading it on the assumption it reverts. Both lost money. Not narrowly - they lost roughly the transaction cost, 0.240% per round trip, which is what a signal carrying no information looks like once you charge it fees.
A large 24-hour move tells you something already happened. It does not tell you what happens next, and the data says so in both directions.
Part of a public experiment: every strategy I test gets published, working or not.
Movers above: $NMR $ORCA $GTC
#Binance #Altcoins #Futures #NMR #CryptoData
NMR is up +40.48% - I tested both ways to trade it
TODAY'S TOP GAINERS
NMR: +40.48%
ORCA: +19.39%
GTC: +15.43%
PARTI: +12.04%
SAND: +12.00%
Every account on this app will show you this list. Here is the part they skip.
I backtested both ways of trading a move like NMR's +40.48%: buying the breakout, and fading it on the assumption it reverts. Both lost money. Not narrowly - they lost roughly the transaction cost, 0.240% per round trip, which is what a signal carrying no information looks like once you charge it fees.
A large 24-hour move tells you something already happened. It does not tell you what happens next, and the data says so in both directions.
Part of a public experiment: every strategy I test gets published, working or not.
Movers above: $NMR $ORCA $GTC
#Binance #Altcoins #Futures #NMR #CryptoData
NMR: +40.48%
ORCA: +19.39%
GTC: +15.43%
PARTI: +12.04%
SAND: +12.00%
Every account on this app will show you this list. Here is the part they skip.
I backtested both ways of trading a move like NMR's +40.48%: buying the breakout, and fading it on the assumption it reverts. Both lost money. Not narrowly - they lost roughly the transaction cost, 0.240% per round trip, which is what a signal carrying no information looks like once you charge it fees.
A large 24-hour move tells you something already happened. It does not tell you what happens next, and the data says so in both directions.
Part of a public experiment: every strategy I test gets published, working or not.
Movers above: $NMR $ORCA $GTC
#Binance #Altcoins #Futures #NMR #CryptoData
6
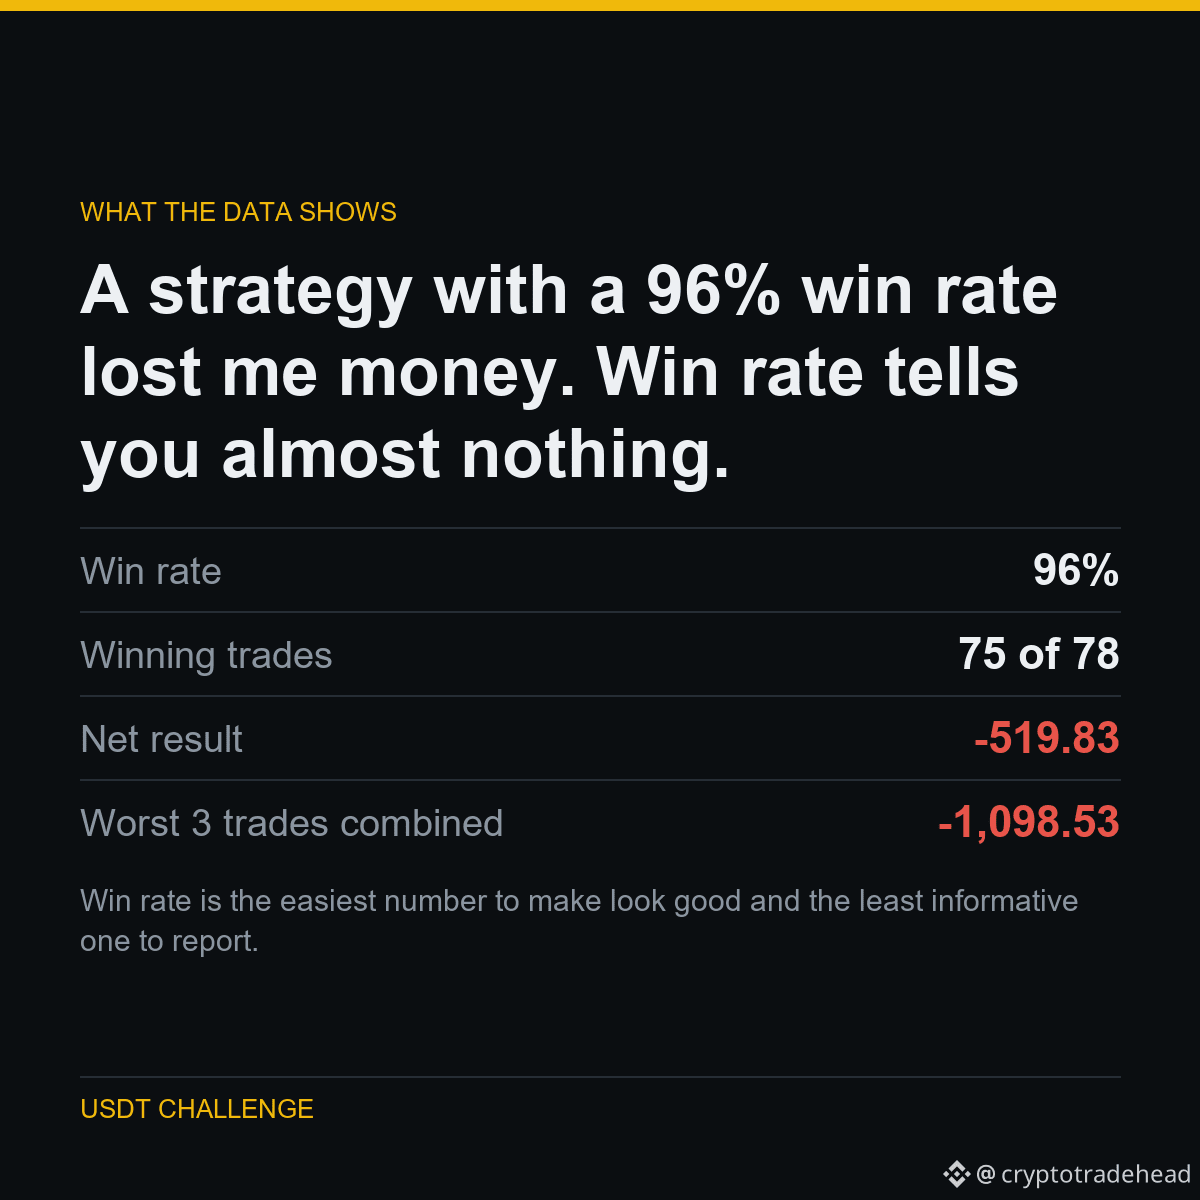
Una estrategia con una tasa de aciertos del 96 % me hizo perder dinero. La tasa de aciertos no te dice casi nada.
Puse a prueba una estrategia martingala: añadir a las posiciones perdedoras y cerrar cuando se recuperan. 75 de las 78 operaciones fueron ganadoras.
Aun así, perdió 519.83 USDT, porque las tres operaciones perdedoras devolvieron más de lo que sumaron las 75 ganadoras.
El margen máximo de esas operaciones llegó a ser 4 veces el de toda la cuenta.
QUÉ SIGNIFICA
La tasa de aciertos es el número más fácil de hacer parecer bueno y el menos informativo de todos. Quien te muestra una tasa de aciertos sin el tamaño de las pérdidas solo te está mostrando la parte de la historia que le favorece.
Parte de un experimento público: de 5,063 USDT a 1,000,000 USDT, con todos los resultados publicados, incluidos los que me dejan mal.
Ejecutado en $BNB
#Binance #Futures #Backtesting #TradingBot #CryptoData
Una estrategia con una tasa de aciertos del 96 % me hizo perder dinero. La tasa de aciertos no te dice casi nada.
Puse a prueba una estrategia martingala: añadir a las posiciones perdedoras y cerrar cuando se recuperan. 75 de las 78 operaciones fueron ganadoras.
Aun así, perdió 519.83 USDT, porque las tres operaciones perdedoras devolvieron más de lo que sumaron las 75 ganadoras.
El margen máximo de esas operaciones llegó a ser 4 veces el de toda la cuenta.
QUÉ SIGNIFICA
La tasa de aciertos es el número más fácil de hacer parecer bueno y el menos informativo de todos. Quien te muestra una tasa de aciertos sin el tamaño de las pérdidas solo te está mostrando la parte de la historia que le favorece.
Parte de un experimento público: de 5,063 USDT a 1,000,000 USDT, con todos los resultados publicados, incluidos los que me dejan mal.
Ejecutado en $BNB
#Binance #Futures #Backtesting #TradingBot #CryptoData
Puse a prueba una estrategia martingala: añadir a las posiciones perdedoras y cerrar cuando se recuperan. 75 de las 78 operaciones fueron ganadoras.
Aun así, perdió 519.83 USDT, porque las tres operaciones perdedoras devolvieron más de lo que sumaron las 75 ganadoras.
El margen máximo de esas operaciones llegó a ser 4 veces el de toda la cuenta.
QUÉ SIGNIFICA
La tasa de aciertos es el número más fácil de hacer parecer bueno y el menos informativo de todos. Quien te muestra una tasa de aciertos sin el tamaño de las pérdidas solo te está mostrando la parte de la historia que le favorece.
Parte de un experimento público: de 5,063 USDT a 1,000,000 USDT, con todos los resultados publicados, incluidos los que me dejan mal.
Ejecutado en $BNB
#Binance #Futures #Backtesting #TradingBot #CryptoData
5
Artículo
Ver traducción
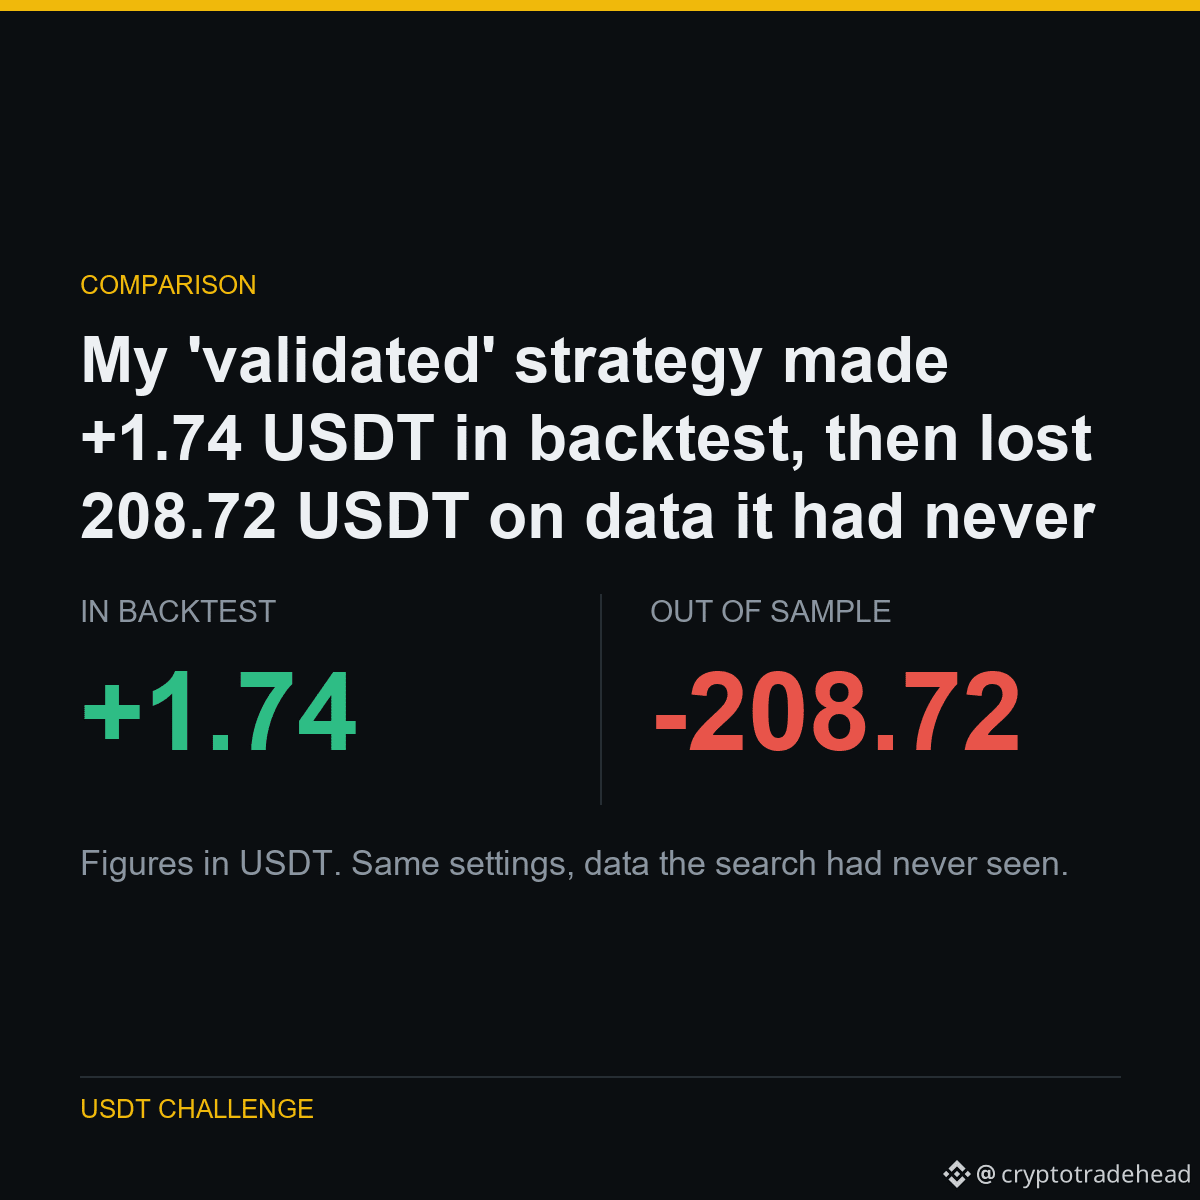
My 'validated' strategy made +1.74 USDT in backtest, then lost 208.72 USDT on data it hadMy 'validated' strategy made +1.74 USDT in backtest, then lost 208.72 USDT on data it had never seen.
I swept 40 symbols and found three that looked profitable. I called them validated and put them live.
Then I tested the exact same settings on 751 days of price history the search had never touched. All three reversed. Not marginally - completely.
Three survivors out of 40 is roughly what pure chance produces at that sample size.
WHAT IT MEANS
Searching hard enough through random data will always produce a winner. The out-of-sample test is the only thing that tells you whether you found an edge or just found noise wearing a costume.
Part of a public experiment: 5,063 USDT to 1,000,000 USDT, every result published - including the ones that make me look bad.
Run on $BTC $ETH $BNB
#Binance #Futures #Backtesting #TradingBot #CryptoData
My 'validated' strategy made +1.74 USDT in backtest, then lost 208.72 USDT on data it had
My 'validated' strategy made +1.74 USDT in backtest, then lost 208.72 USDT on data it had never seen.
I swept 40 symbols and found three that looked profitable. I called them validated and put them live.
Then I tested the exact same settings on 751 days of price history the search had never touched. All three reversed. Not marginally - completely.
Three survivors out of 40 is roughly what pure chance produces at that sample size.
WHAT IT MEANS
Searching hard enough through random data will always produce a winner. The out-of-sample test is the only thing that tells you whether you found an edge or just found noise wearing a costume.
Part of a public experiment: 5,063 USDT to 1,000,000 USDT, every result published - including the ones that make me look bad.
Run on $BTC $ETH $BNB
#Binance #Futures #Backtesting #TradingBot #CryptoData
I swept 40 symbols and found three that looked profitable. I called them validated and put them live.
Then I tested the exact same settings on 751 days of price history the search had never touched. All three reversed. Not marginally - completely.
Three survivors out of 40 is roughly what pure chance produces at that sample size.
WHAT IT MEANS
Searching hard enough through random data will always produce a winner. The out-of-sample test is the only thing that tells you whether you found an edge or just found noise wearing a costume.
Part of a public experiment: 5,063 USDT to 1,000,000 USDT, every result published - including the ones that make me look bad.
Run on $BTC $ETH $BNB
#Binance #Futures #Backtesting #TradingBot #CryptoData
Artículo
Ver traducción
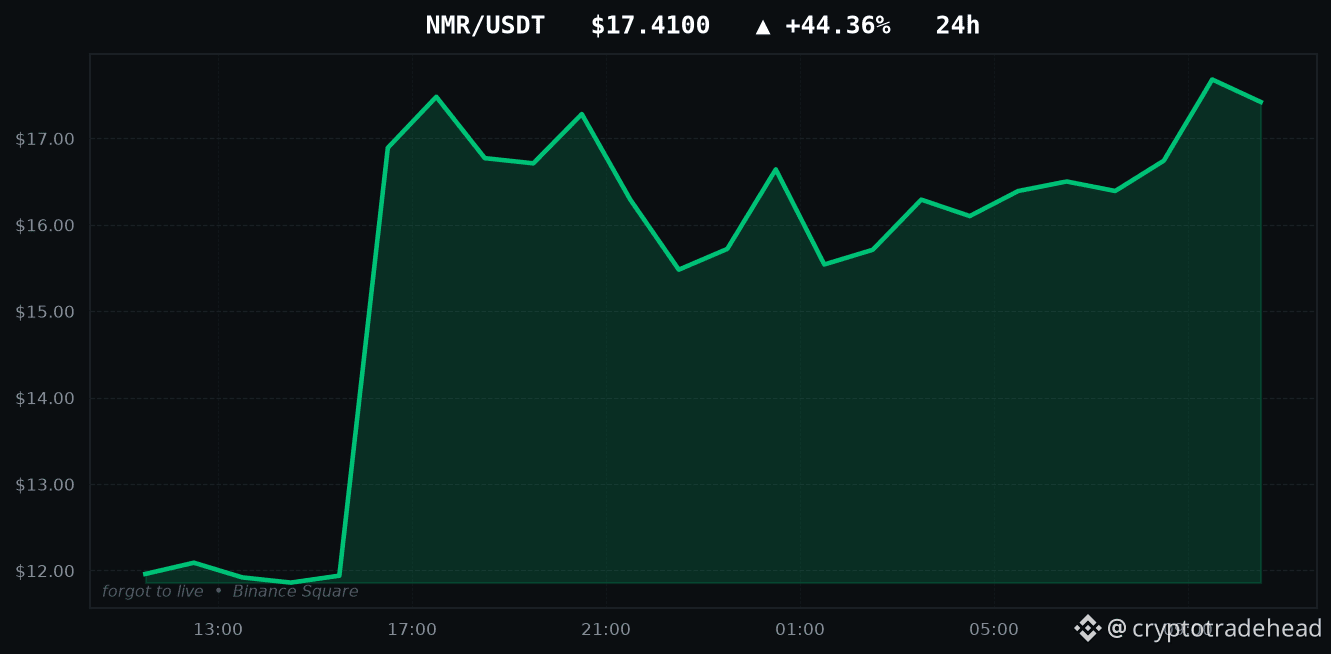
NMR is up +44.36% - I tested both ways to trade itTODAY'S TOP GAINERS
NMR: +44.36%
ORCA: +16.26%
RESOLV: +13.93%
MVLLB: +12.31%
SAND: +10.59%
Every account on this app will show you this list. Here is the part they skip.
I backtested both ways of trading a move like NMR's +44.36%: buying the breakout, and fading it on the assumption it reverts. Both lost money. Not narrowly - they lost roughly the transaction cost, 0.240% per round trip, which is what a signal carrying no information looks like once you charge it fees.
A large 24-hour move tells you something already happened. It does not tell you what happens next, and the data says so in both directions.
Part of a public experiment: every strategy I test gets published, working or not.
Movers above: $NMR $ORCA $RESOLV
#Binance #Altcoins #Futures #NMR #CryptoData
NMR is up +44.36% - I tested both ways to trade it
TODAY'S TOP GAINERS
NMR: +44.36%
ORCA: +16.26%
RESOLV: +13.93%
MVLLB: +12.31%
SAND: +10.59%
Every account on this app will show you this list. Here is the part they skip.
I backtested both ways of trading a move like NMR's +44.36%: buying the breakout, and fading it on the assumption it reverts. Both lost money. Not narrowly - they lost roughly the transaction cost, 0.240% per round trip, which is what a signal carrying no information looks like once you charge it fees.
A large 24-hour move tells you something already happened. It does not tell you what happens next, and the data says so in both directions.
Part of a public experiment: every strategy I test gets published, working or not.
Movers above: $NMR $ORCA $RESOLV
#Binance #Altcoins #Futures #NMR #CryptoData
NMR: +44.36%
ORCA: +16.26%
RESOLV: +13.93%
MVLLB: +12.31%
SAND: +10.59%
Every account on this app will show you this list. Here is the part they skip.
I backtested both ways of trading a move like NMR's +44.36%: buying the breakout, and fading it on the assumption it reverts. Both lost money. Not narrowly - they lost roughly the transaction cost, 0.240% per round trip, which is what a signal carrying no information looks like once you charge it fees.
A large 24-hour move tells you something already happened. It does not tell you what happens next, and the data says so in both directions.
Part of a public experiment: every strategy I test gets published, working or not.
Movers above: $NMR $ORCA $RESOLV
#Binance #Altcoins #Futures #NMR #CryptoData
2
Las criptomonedas caen más rápido de lo que suben: las cascadas de liquidaciones son asimétricas. Es una característica documentada de la estructura del mercado, por eso este resultado es más creíble que uno que solo funciona cuando todo sube.
Esto es lo que lo produjo.
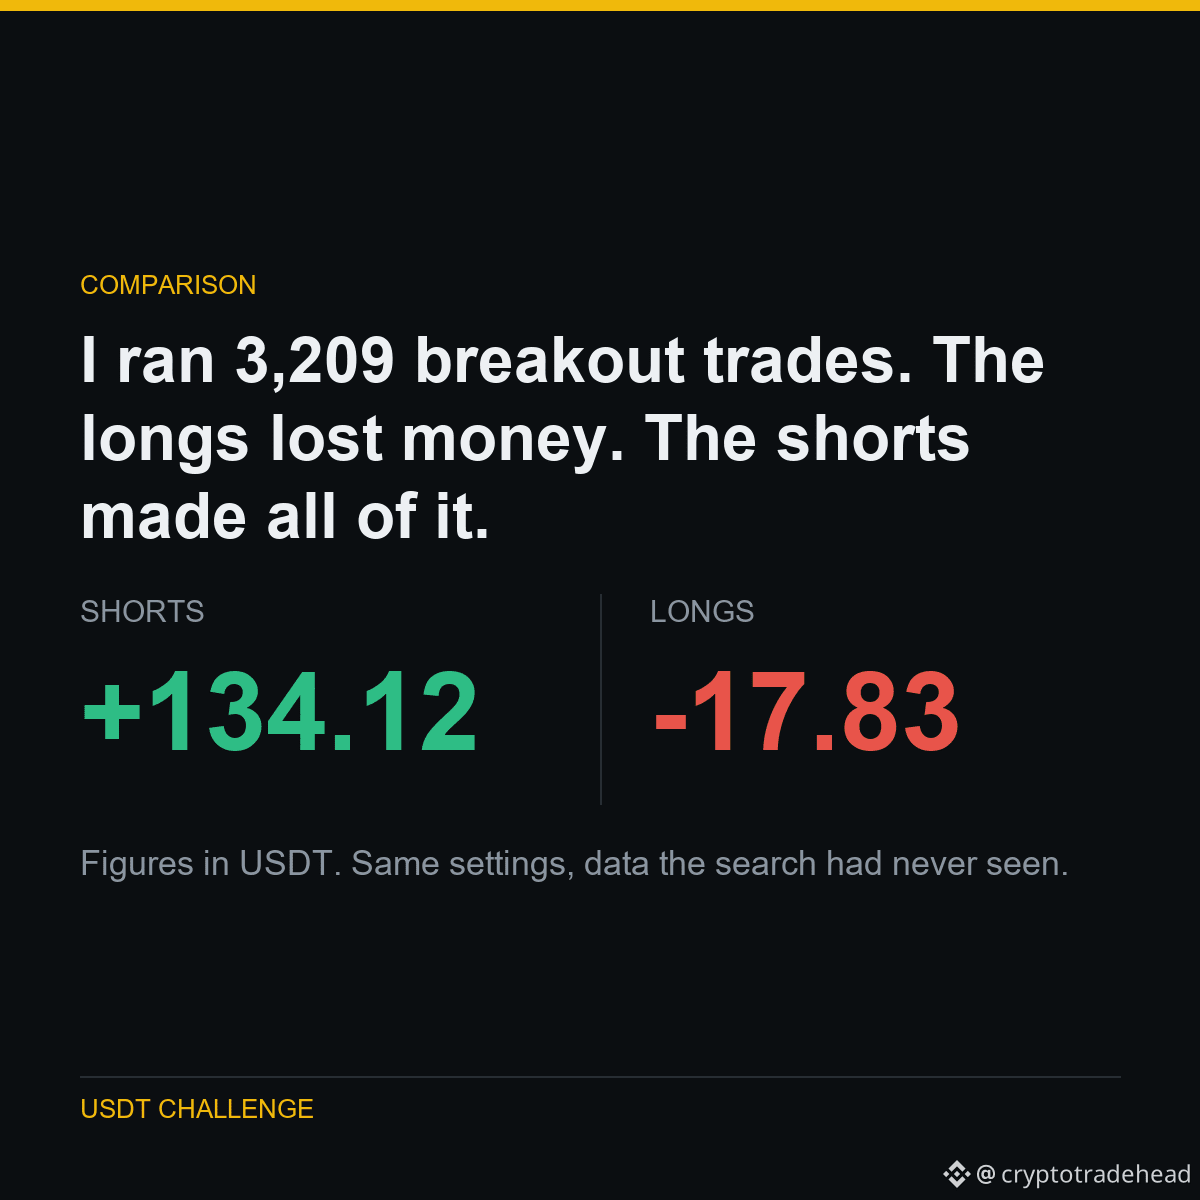
Ejecuté 3,209 operaciones de ruptura. Las posiciones largas perdieron dinero. Las cortas lo ganaron todo.
Canal Donchian de 20 períodos, stop basado en ATR, 10 símbolos, cuatro años y medio.
Si esto fuera simplemente aprovechar un mercado alcista, las posiciones largas serían las ganadoras. No lo son: están en negativo.
Las posiciones cortas incluso ganaron dinero con monedas que SUBIERON durante el período. BTC subió un 94% con una estrategia de comprar y mantener, y aun así vender en corto sus rupturas a la baja generó +22.83 USDT. XRP subió un 87%; las posiciones cortas generaron +24.27 USDT.
Parte de un experimento público: de 5,063 USDT a 1,000,000 USDT, con todos los resultados publicados, incluidos los que me dejan mal parado.
Ejecutado en $BTC $XRP $LTC
#Binance #Futures #Backtesting #TradingBot #CryptoData
Las criptomonedas caen más rápido de lo que suben: las cascadas de liquidaciones son asimétricas. Es una característica documentada de la estructura del mercado, por eso este resultado es más creíble que uno que solo funciona cuando todo sube.
Esto es lo que lo produjo.
Ejecuté 3,209 operaciones de ruptura. Las posiciones largas perdieron dinero. Las cortas lo ganaron todo.
Canal Donchian de 20 períodos, stop basado en ATR, 10 símbolos, cuatro años y medio.
Si esto fuera simplemente aprovechar un mercado alcista, las posiciones largas serían las ganadoras. No lo son: están en negativo.
Las posiciones cortas incluso ganaron dinero con monedas que SUBIERON durante el período. BTC subió un 94% con una estrategia de comprar y mantener, y aun así vender en corto sus rupturas a la baja generó +22.83 USDT. XRP subió un 87%; las posiciones cortas generaron +24.27 USDT.
Parte de un experimento público: de 5,063 USDT a 1,000,000 USDT, con todos los resultados publicados, incluidos los que me dejan mal parado.
Ejecutado en $BTC $XRP $LTC
#Binance #Futures #Backtesting #TradingBot #CryptoData
Esto es lo que lo produjo.
Ejecuté 3,209 operaciones de ruptura. Las posiciones largas perdieron dinero. Las cortas lo ganaron todo.
Canal Donchian de 20 períodos, stop basado en ATR, 10 símbolos, cuatro años y medio.
Si esto fuera simplemente aprovechar un mercado alcista, las posiciones largas serían las ganadoras. No lo son: están en negativo.
Las posiciones cortas incluso ganaron dinero con monedas que SUBIERON durante el período. BTC subió un 94% con una estrategia de comprar y mantener, y aun así vender en corto sus rupturas a la baja generó +22.83 USDT. XRP subió un 87%; las posiciones cortas generaron +24.27 USDT.
Parte de un experimento público: de 5,063 USDT a 1,000,000 USDT, con todos los resultados publicados, incluidos los que me dejan mal parado.
Ejecutado en $BTC $XRP $LTC
#Binance #Futures #Backtesting #TradingBot #CryptoData
4
Ver traducción
HOW I TESTED IT
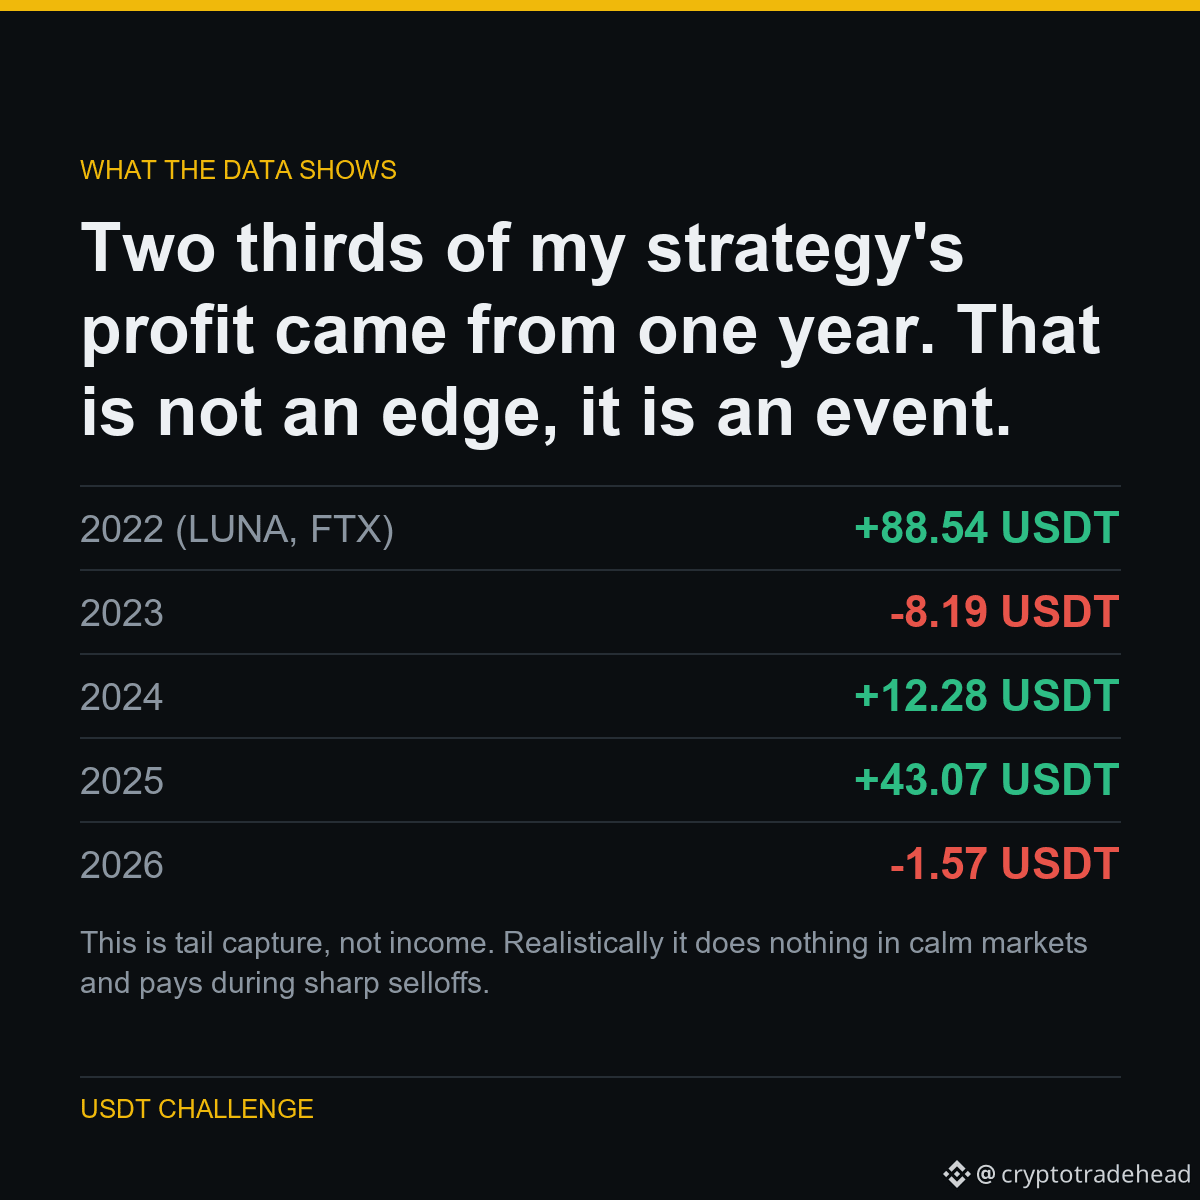
The headline number was +134.12 USDT from short breakouts. Then I split it by year.
2022 - the year of the LUNA collapse and the FTX failure - produced 88.54 of it. Strip that year out and four years of trading returned 45.59 USDT, most of it from 2025.
2026 so far is flat.
THE NUMBERS
2022 (LUNA, FTX): +88.54 USDT
2023: -8.19 USDT
2024: +12.28 USDT
2025: +43.07 USDT
2026: -1.57 USDT
This is tail capture, not income. Realistically it does nothing in calm markets and pays during sharp selloffs. Expecting it to earn every month is how people quit a strategy right before it works.
Part of a public experiment: 5,063 USDT to 1,000,000 USDT, every result published - including the ones that make me look bad.
Run on $BTC $LTC
#Binance #Futures #Backtesting #TradingBot #CryptoData
HOW I TESTED IT
The headline number was +134.12 USDT from short breakouts. Then I split it by year.
2022 - the year of the LUNA collapse and the FTX failure - produced 88.54 of it. Strip that year out and four years of trading returned 45.59 USDT, most of it from 2025.
2026 so far is flat.
THE NUMBERS
2022 (LUNA, FTX): +88.54 USDT
2023: -8.19 USDT
2024: +12.28 USDT
2025: +43.07 USDT
2026: -1.57 USDT
This is tail capture, not income. Realistically it does nothing in calm markets and pays during sharp selloffs. Expecting it to earn every month is how people quit a strategy right before it works.
Part of a public experiment: 5,063 USDT to 1,000,000 USDT, every result published - including the ones that make me look bad.
Run on $BTC $LTC
#Binance #Futures #Backtesting #TradingBot #CryptoData
The headline number was +134.12 USDT from short breakouts. Then I split it by year.
2022 - the year of the LUNA collapse and the FTX failure - produced 88.54 of it. Strip that year out and four years of trading returned 45.59 USDT, most of it from 2025.
2026 so far is flat.
THE NUMBERS
2022 (LUNA, FTX): +88.54 USDT
2023: -8.19 USDT
2024: +12.28 USDT
2025: +43.07 USDT
2026: -1.57 USDT
This is tail capture, not income. Realistically it does nothing in calm markets and pays during sharp selloffs. Expecting it to earn every month is how people quit a strategy right before it works.
Part of a public experiment: 5,063 USDT to 1,000,000 USDT, every result published - including the ones that make me look bad.
Run on $BTC $LTC
#Binance #Futures #Backtesting #TradingBot #CryptoData
6
Artículo
Ver traducción
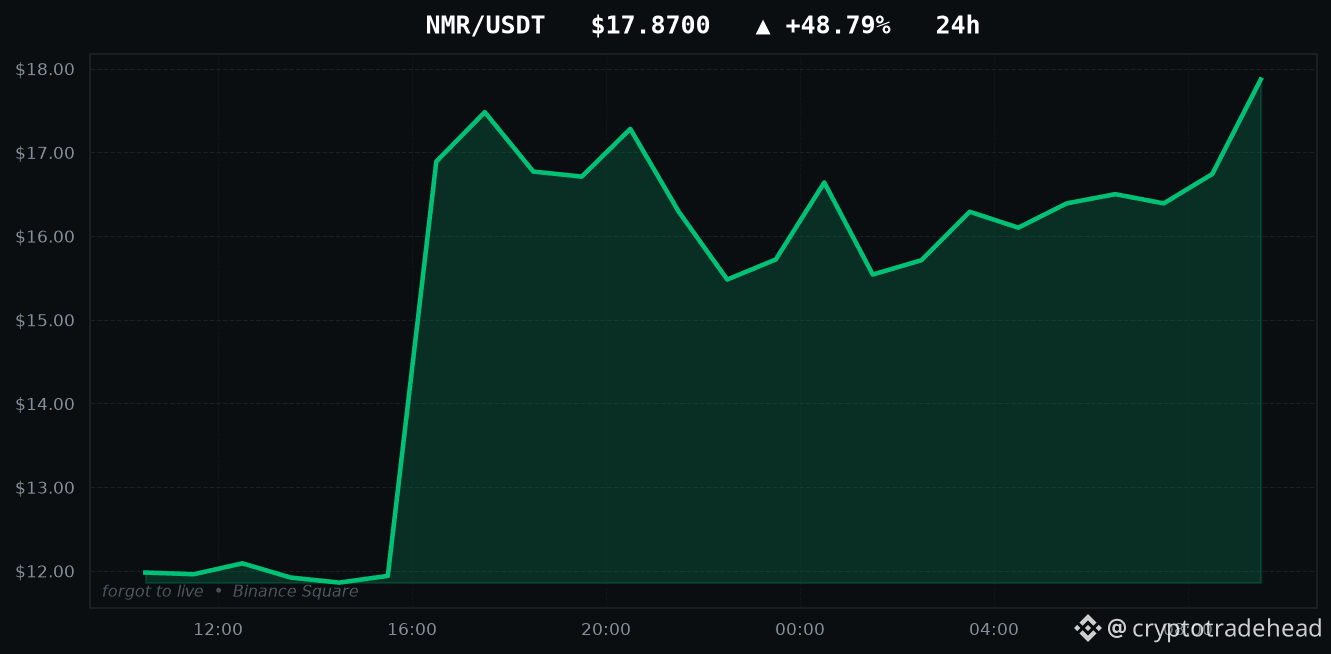
NMR is up +48.79% - I tested both ways to trade itTODAY'S TOP GAINERS
NMR: +48.79%
ORCA: +23.42%
RESOLV: +18.01%
MVLLB: +12.22%
MAGIC: +12.16%
Every account on this app will show you this list. Here is the part they skip.
I backtested both ways of trading a move like NMR's +48.79%: buying the breakout, and fading it on the assumption it reverts. Both lost money. Not narrowly - they lost roughly the transaction cost, 0.240% per round trip, which is what a signal carrying no information looks like once you charge it fees.
A large 24-hour move tells you something already happened. It does not tell you what happens next, and the data says so in both directions.
Part of a public experiment: every strategy I test gets published, working or not.
Movers above: $NMR $ORCA $RESOLV
#Binance #Altcoins #Futures #NMR #CryptoData
NMR is up +48.79% - I tested both ways to trade it
TODAY'S TOP GAINERS
NMR: +48.79%
ORCA: +23.42%
RESOLV: +18.01%
MVLLB: +12.22%
MAGIC: +12.16%
Every account on this app will show you this list. Here is the part they skip.
I backtested both ways of trading a move like NMR's +48.79%: buying the breakout, and fading it on the assumption it reverts. Both lost money. Not narrowly - they lost roughly the transaction cost, 0.240% per round trip, which is what a signal carrying no information looks like once you charge it fees.
A large 24-hour move tells you something already happened. It does not tell you what happens next, and the data says so in both directions.
Part of a public experiment: every strategy I test gets published, working or not.
Movers above: $NMR $ORCA $RESOLV
#Binance #Altcoins #Futures #NMR #CryptoData
NMR: +48.79%
ORCA: +23.42%
RESOLV: +18.01%
MVLLB: +12.22%
MAGIC: +12.16%
Every account on this app will show you this list. Here is the part they skip.
I backtested both ways of trading a move like NMR's +48.79%: buying the breakout, and fading it on the assumption it reverts. Both lost money. Not narrowly - they lost roughly the transaction cost, 0.240% per round trip, which is what a signal carrying no information looks like once you charge it fees.
A large 24-hour move tells you something already happened. It does not tell you what happens next, and the data says so in both directions.
Part of a public experiment: every strategy I test gets published, working or not.
Movers above: $NMR $ORCA $RESOLV
#Binance #Altcoins #Futures #NMR #CryptoData
7
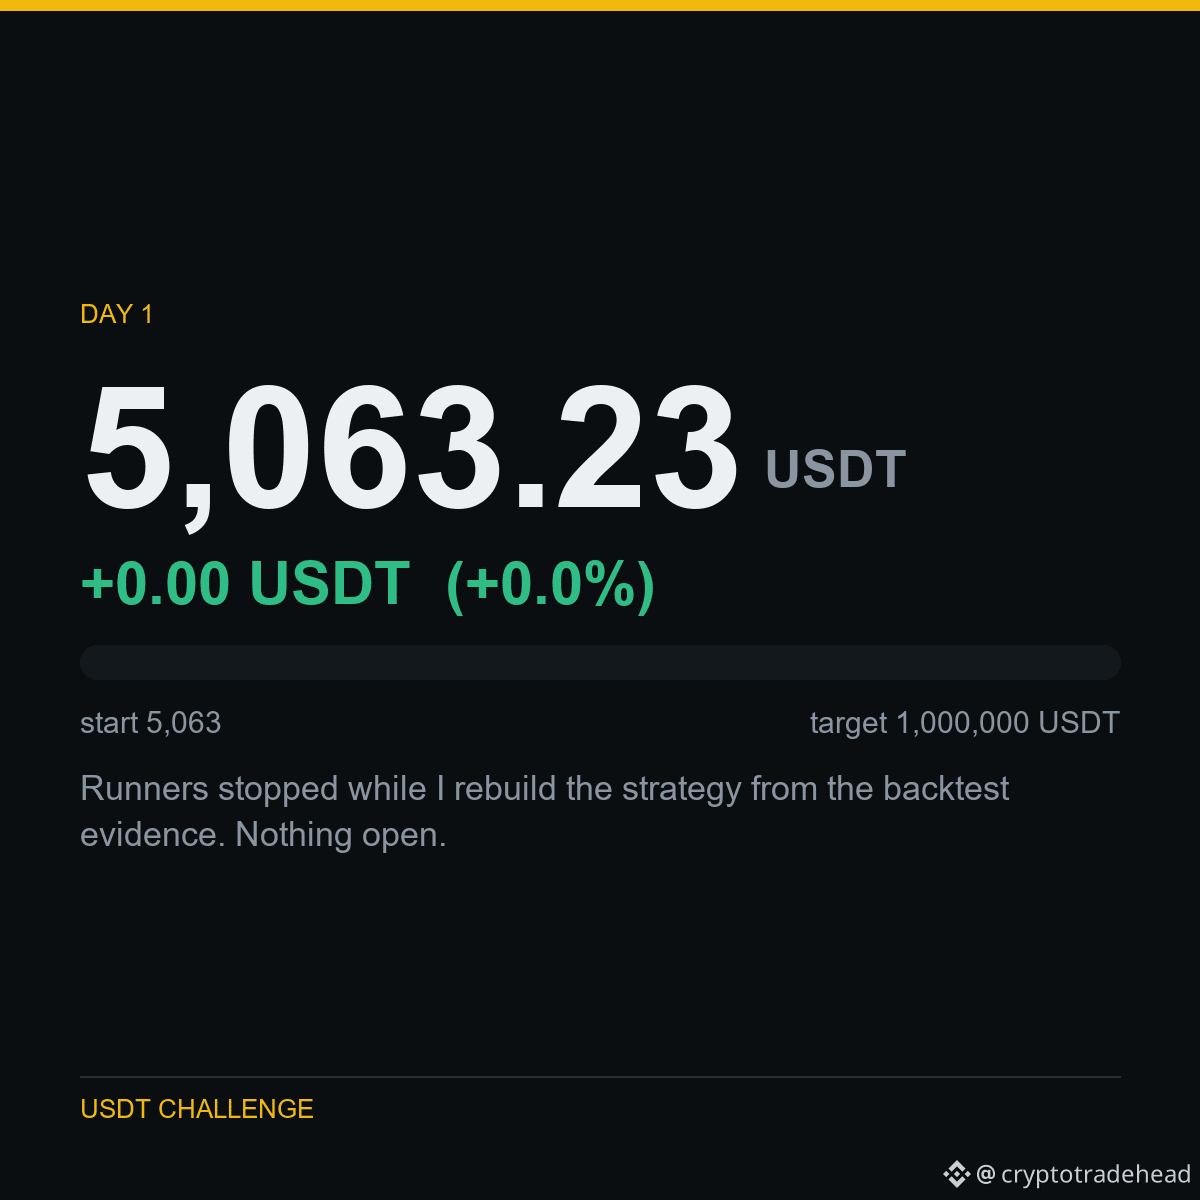
DÍA 1 - De 5,063 USDT a 1,000,000 USDT
Saldo: 5,063.23 USDT
Cambio: +0.00 USDT (+0.0%)
Detuve los bots mientras reconstruyo la estrategia basándome en los datos del backtest. No hay nada abierto.
Opero en una cuenta de la red de pruebas de Binance, así que este es capital de demostración; prefiero decirlo para que no supongas lo contrario. La estrategia, los costos y las pérdidas son reales.
No vendo señales, no hay cursos ni enlaces de afiliados. Solo la cuenta y los datos que la respaldan.
Operado en este desafío: $BTC $SOL $AVAX
#Binance #USDT #Futures #TradingChallenge #Cripto
DÍA 1 - De 5,063 USDT a 1,000,000 USDT
Saldo: 5,063.23 USDT
Cambio: +0.00 USDT (+0.0%)
Detuve los bots mientras reconstruyo la estrategia basándome en los datos del backtest. No hay nada abierto.
Opero en una cuenta de la red de pruebas de Binance, así que este es capital de demostración; prefiero decirlo para que no supongas lo contrario. La estrategia, los costos y las pérdidas son reales.
No vendo señales, no hay cursos ni enlaces de afiliados. Solo la cuenta y los datos que la respaldan.
Operado en este desafío: $BTC $SOL $AVAX
#Binance #USDT #Futures #TradingChallenge #Cripto
Saldo: 5,063.23 USDT
Cambio: +0.00 USDT (+0.0%)
Detuve los bots mientras reconstruyo la estrategia basándome en los datos del backtest. No hay nada abierto.
Opero en una cuenta de la red de pruebas de Binance, así que este es capital de demostración; prefiero decirlo para que no supongas lo contrario. La estrategia, los costos y las pérdidas son reales.
No vendo señales, no hay cursos ni enlaces de afiliados. Solo la cuenta y los datos que la respaldan.
Operado en este desafío: $BTC $SOL $AVAX
#Binance #USDT #Futures #TradingChallenge #Cripto
5
Ver traducción
HOW I TESTED IT
Rank 45 perpetuals by 5-day return. Long the top 5, short the bottom 5, hold 15 days, rebalance. Equal weight, dollar-neutral.
The out-of-sample control is the one that had destroyed everything before it: fix the settings on old data, then run them on data the search never touched. In-sample +1.711% per rebalance, out-of-sample +1.801%. The mean held.
It also survives costs far worse than real: still +0.48% per rebalance even at a 1.50% round trip, six times what Binance actually charges.
THE NUMBERS
Mean per rebalance: +1.737%
In-sample: +1.711%
Out-of-sample: +1.801%
Win rate: 55.6%
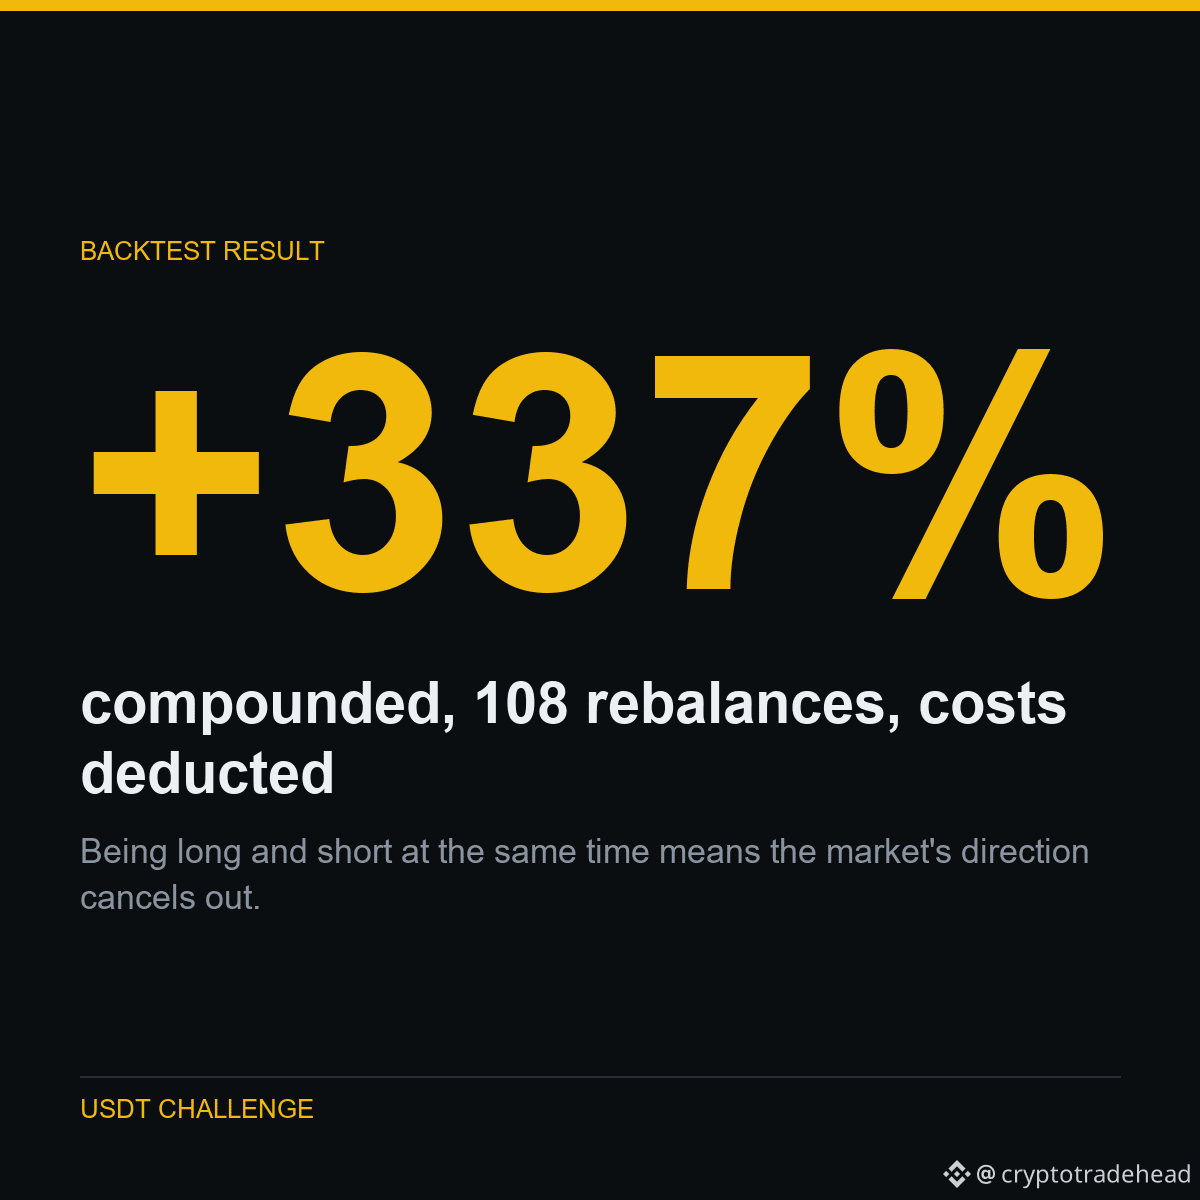
Being long and short at the same time means the market's direction cancels out. What is left is whether the winners keep beating the losers - which is a real question, not a bet on the market going up.
Part of a public experiment: 5,063 USDT to 1,000,000 USDT, every result published - including the ones that make me look bad.
Run on $SOL $BNB $BTC
#Binance #Futures #Backtesting #TradingBot #CryptoData
HOW I TESTED IT
Rank 45 perpetuals by 5-day return. Long the top 5, short the bottom 5, hold 15 days, rebalance. Equal weight, dollar-neutral.
The out-of-sample control is the one that had destroyed everything before it: fix the settings on old data, then run them on data the search never touched. In-sample +1.711% per rebalance, out-of-sample +1.801%. The mean held.
It also survives costs far worse than real: still +0.48% per rebalance even at a 1.50% round trip, six times what Binance actually charges.
THE NUMBERS
Mean per rebalance: +1.737%
In-sample: +1.711%
Out-of-sample: +1.801%
Win rate: 55.6%
Being long and short at the same time means the market's direction cancels out. What is left is whether the winners keep beating the losers - which is a real question, not a bet on the market going up.
Part of a public experiment: 5,063 USDT to 1,000,000 USDT, every result published - including the ones that make me look bad.
Run on $SOL $BNB $BTC
#Binance #Futures #Backtesting #TradingBot #CryptoData
Rank 45 perpetuals by 5-day return. Long the top 5, short the bottom 5, hold 15 days, rebalance. Equal weight, dollar-neutral.
The out-of-sample control is the one that had destroyed everything before it: fix the settings on old data, then run them on data the search never touched. In-sample +1.711% per rebalance, out-of-sample +1.801%. The mean held.
It also survives costs far worse than real: still +0.48% per rebalance even at a 1.50% round trip, six times what Binance actually charges.
THE NUMBERS
Mean per rebalance: +1.737%
In-sample: +1.711%
Out-of-sample: +1.801%
Win rate: 55.6%
Being long and short at the same time means the market's direction cancels out. What is left is whether the winners keep beating the losers - which is a real question, not a bet on the market going up.
Part of a public experiment: 5,063 USDT to 1,000,000 USDT, every result published - including the ones that make me look bad.
Run on $SOL $BNB $BTC
#Binance #Futures #Backtesting #TradingBot #CryptoData
8
Artículo
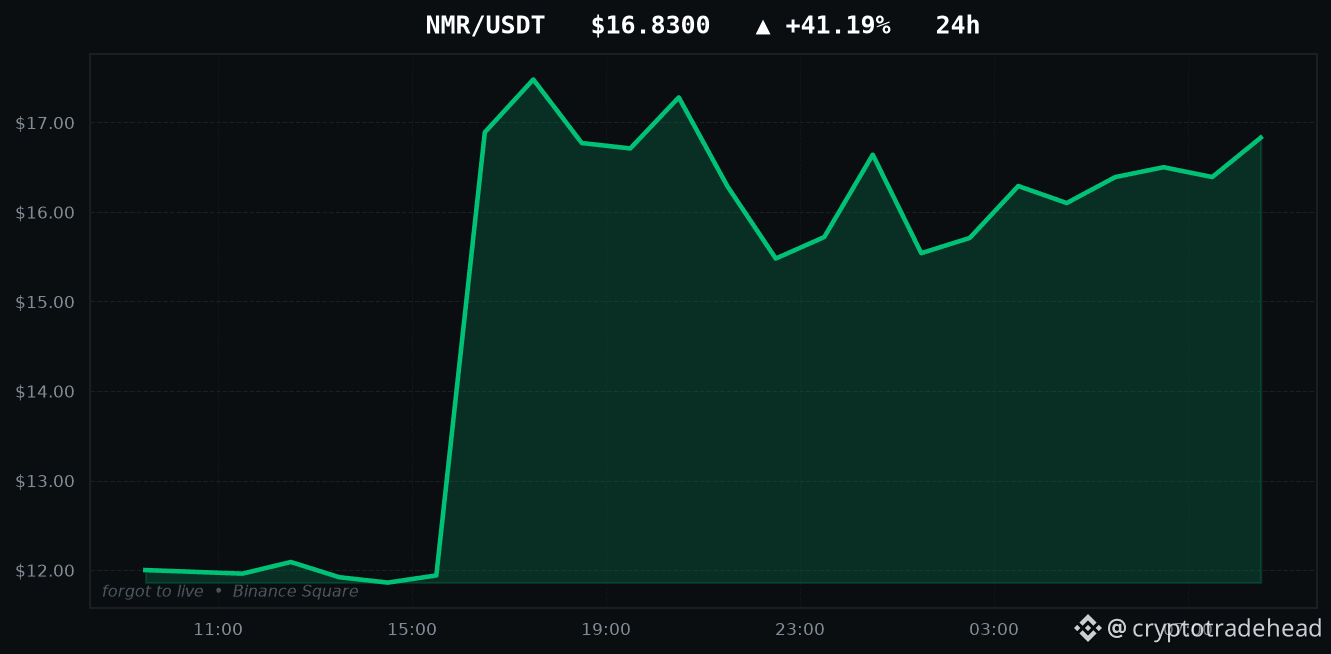
NMR sube un +41.19%: probé las dos formas de operarloMAYORES SUBIDAS DE HOY
NMR: +41.19%
ORCA: +26.39%
RESOLV: +19.72%
MAGIC: +13.18%
MVLLB: +11.97%
Todas las cuentas de esta aplicación te mostrarán esta lista. Aquí está la parte que omiten.
Hice una prueba retrospectiva de las dos formas de operar un movimiento como el +41.19% de NMR: comprar la ruptura y apostar en su contra suponiendo que se revertirá. Ambas dieron pérdidas. Y no por poco: perdieron aproximadamente el costo de transacción, un 0.240% por operación de ida y vuelta, que es lo que ocurre con una señal sin información una vez que se le aplican comisiones.
Un gran movimiento en 24 horas te dice que algo ya ocurrió. No te dice qué pasará después, y los datos lo demuestran en ambos sentidos.
NMR sube un +41.19%: probé las dos formas de operarlo
MAYORES SUBIDAS DE HOY
NMR: +41.19%
ORCA: +26.39%
RESOLV: +19.72%
MAGIC: +13.18%
MVLLB: +11.97%
Todas las cuentas de esta aplicación te mostrarán esta lista. Aquí está la parte que omiten.
Hice una prueba retrospectiva de las dos formas de operar un movimiento como el +41.19% de NMR: comprar la ruptura y apostar en su contra suponiendo que se revertirá. Ambas dieron pérdidas. Y no por poco: perdieron aproximadamente el costo de transacción, un 0.240% por operación de ida y vuelta, que es lo que ocurre con una señal sin información una vez que se le aplican comisiones.
Un gran movimiento en 24 horas te dice que algo ya ocurrió. No te dice qué pasará después, y los datos lo demuestran en ambos sentidos.
NMR: +41.19%
ORCA: +26.39%
RESOLV: +19.72%
MAGIC: +13.18%
MVLLB: +11.97%
Todas las cuentas de esta aplicación te mostrarán esta lista. Aquí está la parte que omiten.
Hice una prueba retrospectiva de las dos formas de operar un movimiento como el +41.19% de NMR: comprar la ruptura y apostar en su contra suponiendo que se revertirá. Ambas dieron pérdidas. Y no por poco: perdieron aproximadamente el costo de transacción, un 0.240% por operación de ida y vuelta, que es lo que ocurre con una señal sin información una vez que se le aplican comisiones.
Un gran movimiento en 24 horas te dice que algo ya ocurrió. No te dice qué pasará después, y los datos lo demuestran en ambos sentidos.
8
Artículo
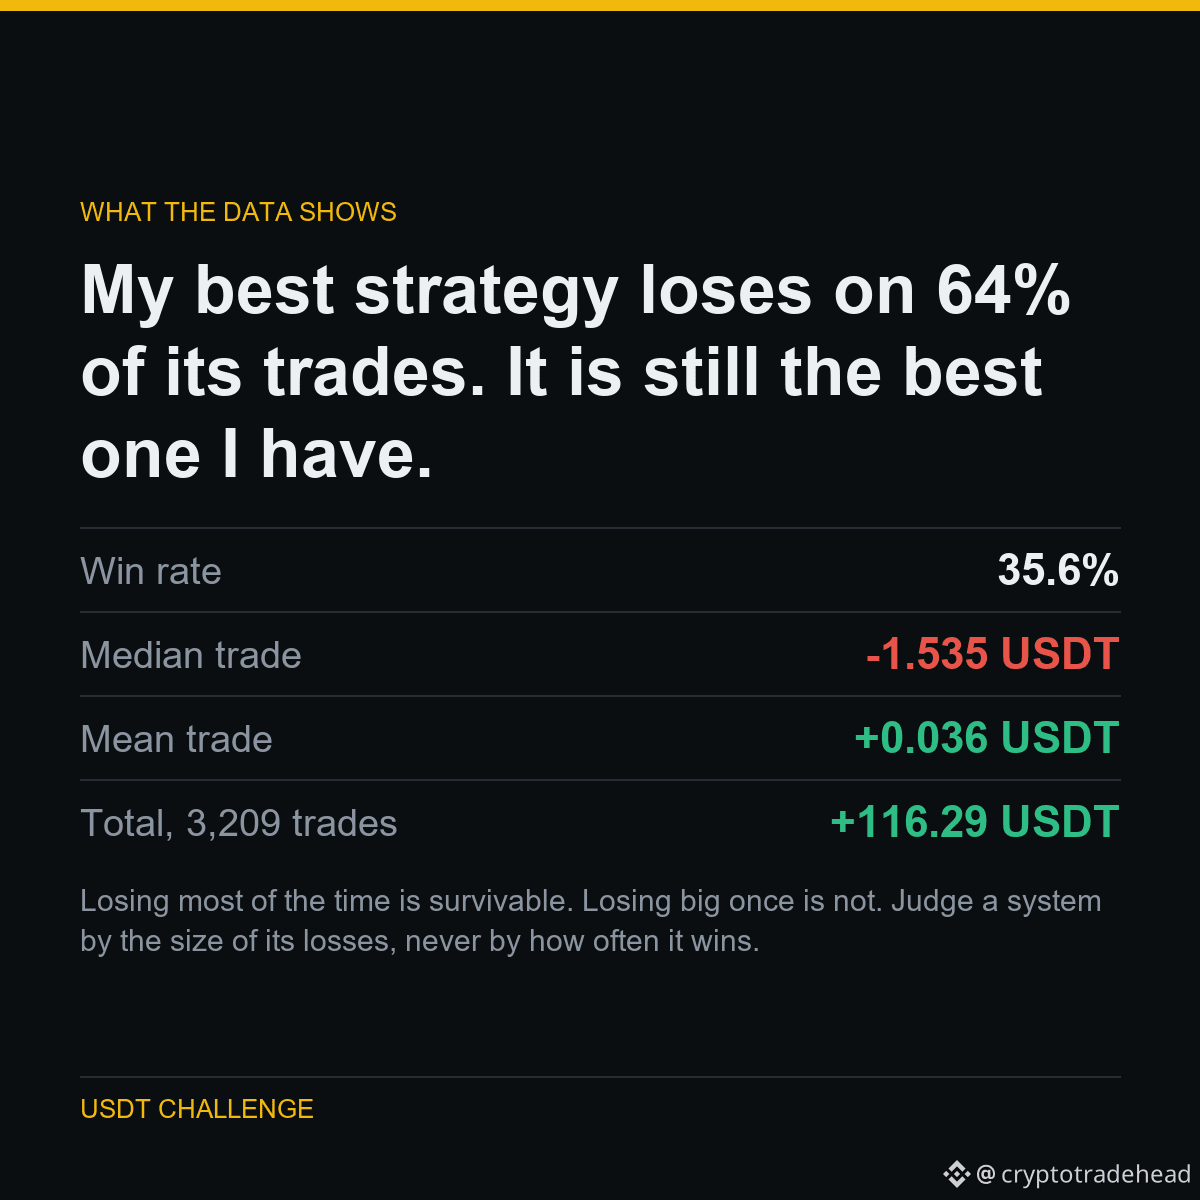
Mi mejor estrategia pierde en el 64 % de sus operaciones. Aun así, es la mejor que tengo.Mi mejor estrategia pierde en el 64 % de sus operaciones. Aun así, es la mejor que tengo.
La operación típica de este sistema pierde 1,535 USDT. Casi dos de cada tres operaciones son pérdidas.
De todos modos, es rentable, porque las ganancias son mucho mayores que las pérdidas. La operación promedio es positiva, mientras que la mediana es claramente negativa.
También tiene una forma opuesta a la martingala que probé, que ganó el 96 % de las veces y aun así perdió 519,83 USDT.
QUÉ SIGNIFICA
Perder la mayoría de las veces es soportable. Perder mucho una sola vez, no. Evalúa un sistema por el tamaño de sus pérdidas, nunca por la frecuencia con la que gana.
Mi mejor estrategia pierde en el 64 % de sus operaciones. Aun así, es la mejor que tengo.
Mi mejor estrategia pierde en el 64 % de sus operaciones. Aun así, es la mejor que tengo.
La operación típica de este sistema pierde 1,535 USDT. Casi dos de cada tres operaciones son pérdidas.
De todos modos, es rentable, porque las ganancias son mucho mayores que las pérdidas. La operación promedio es positiva, mientras que la mediana es claramente negativa.
También tiene una forma opuesta a la martingala que probé, que ganó el 96 % de las veces y aun así perdió 519,83 USDT.
QUÉ SIGNIFICA
Perder la mayoría de las veces es soportable. Perder mucho una sola vez, no. Evalúa un sistema por el tamaño de sus pérdidas, nunca por la frecuencia con la que gana.
La operación típica de este sistema pierde 1,535 USDT. Casi dos de cada tres operaciones son pérdidas.
De todos modos, es rentable, porque las ganancias son mucho mayores que las pérdidas. La operación promedio es positiva, mientras que la mediana es claramente negativa.
También tiene una forma opuesta a la martingala que probé, que ganó el 96 % de las veces y aun así perdió 519,83 USDT.
QUÉ SIGNIFICA
Perder la mayoría de las veces es soportable. Perder mucho una sola vez, no. Evalúa un sistema por el tamaño de sus pérdidas, nunca por la frecuencia con la que gana.
5
Inicia sesión para explorar más contenidos
Únete a usuarios globales de criptomonedas en Binance Square
⚡️ Obtén información útil y actualizada sobre criptos.
💬 Avalado por el mayor exchange de criptomonedas en el mundo.
👍 Descubre perspectivas reales de creadores verificados.
Email/número de teléfono
Temas populares
BinanceLaunchesBinanceIntelligence
760,608 vistas
4,761 están debatiendo
Binance revolucionó la interacción de los mercados al lanzar oficialmente "Binance Intelligence"
WorldWideWeb The World ARPANET Archie EFF
·17 me gusta
·39.2k vistas
BTCFallsBelow$84K
36,202 vistas
128 están debatiendo
DubaiVARAIssuesReserveAssetAuditCircular
12,160 vistas
428 están debatiendo