
SuMo_GiLl
21 Posts

SuMo_GiLl
Report
Block User
Open Trade
6 Days
0 Following
4 Followers
7 Liked
Posts
Portfolio
·
--
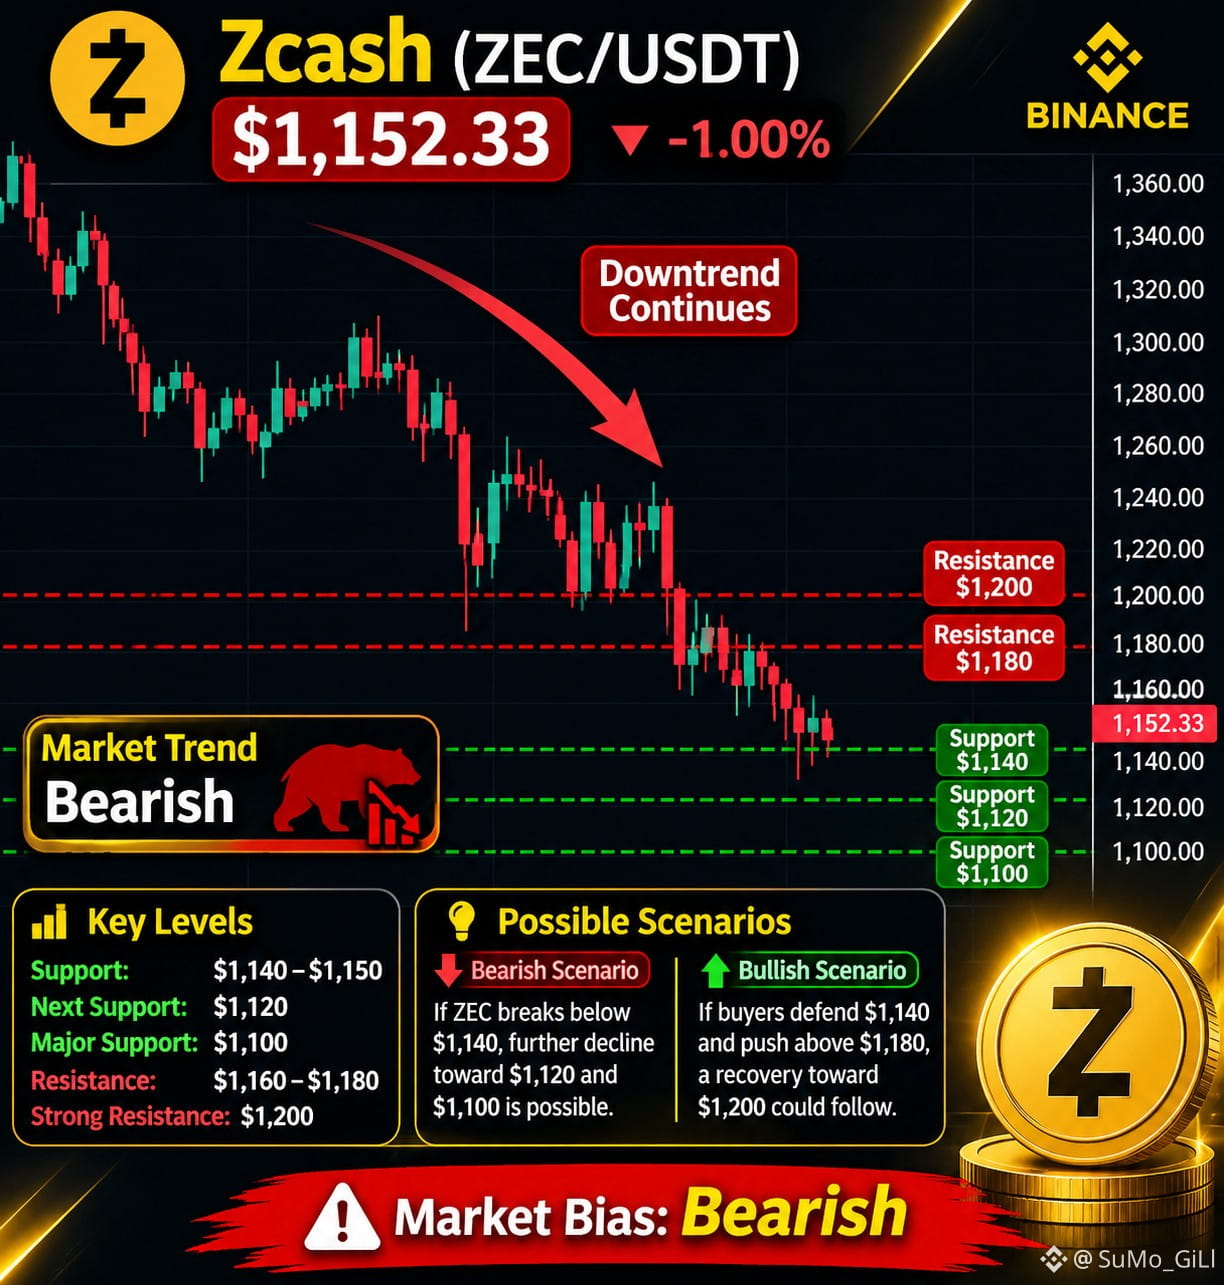
📉 $ZEC /USDT Market Analysis
$ZEC is facing strong selling pressure and continues to trade in a clear bearish structure.
💰 Current Price: $1,152.33
🔻 Support: $1,140 / $1,120 🚀 Resistance: $1,180 / $1,200
A breakdown below $1,140 could trigger another downward move, while a recovery above $1,180 may signal a short-term bullish reversal.
Market Bias: Bearish ⚠️
#ZEC/USDT #zcash #CryptoAnalysis20 #Trading #Binance
{spot}(ZECUSDT)
📉 $ZEC /USDT Market Analysis
$ZEC is facing strong selling pressure and continues to trade in a clear bearish structure.
💰 Current Price: $1,152.33
🔻 Support: $1,140 / $1,120 🚀 Resistance: $1,180 / $1,200
A breakdown below $1,140 could trigger another downward move, while a recovery above $1,180 may signal a short-term bullish reversal.
Market Bias: Bearish ⚠️
#ZEC/USDT #zcash #CryptoAnalysis20 #Trading #Binance
$ZEC is facing strong selling pressure and continues to trade in a clear bearish structure.
💰 Current Price: $1,152.33
🔻 Support: $1,140 / $1,120 🚀 Resistance: $1,180 / $1,200
A breakdown below $1,140 could trigger another downward move, while a recovery above $1,180 may signal a short-term bullish reversal.
Market Bias: Bearish ⚠️
#ZEC/USDT #zcash #CryptoAnalysis20 #Trading #Binance
46
·
--
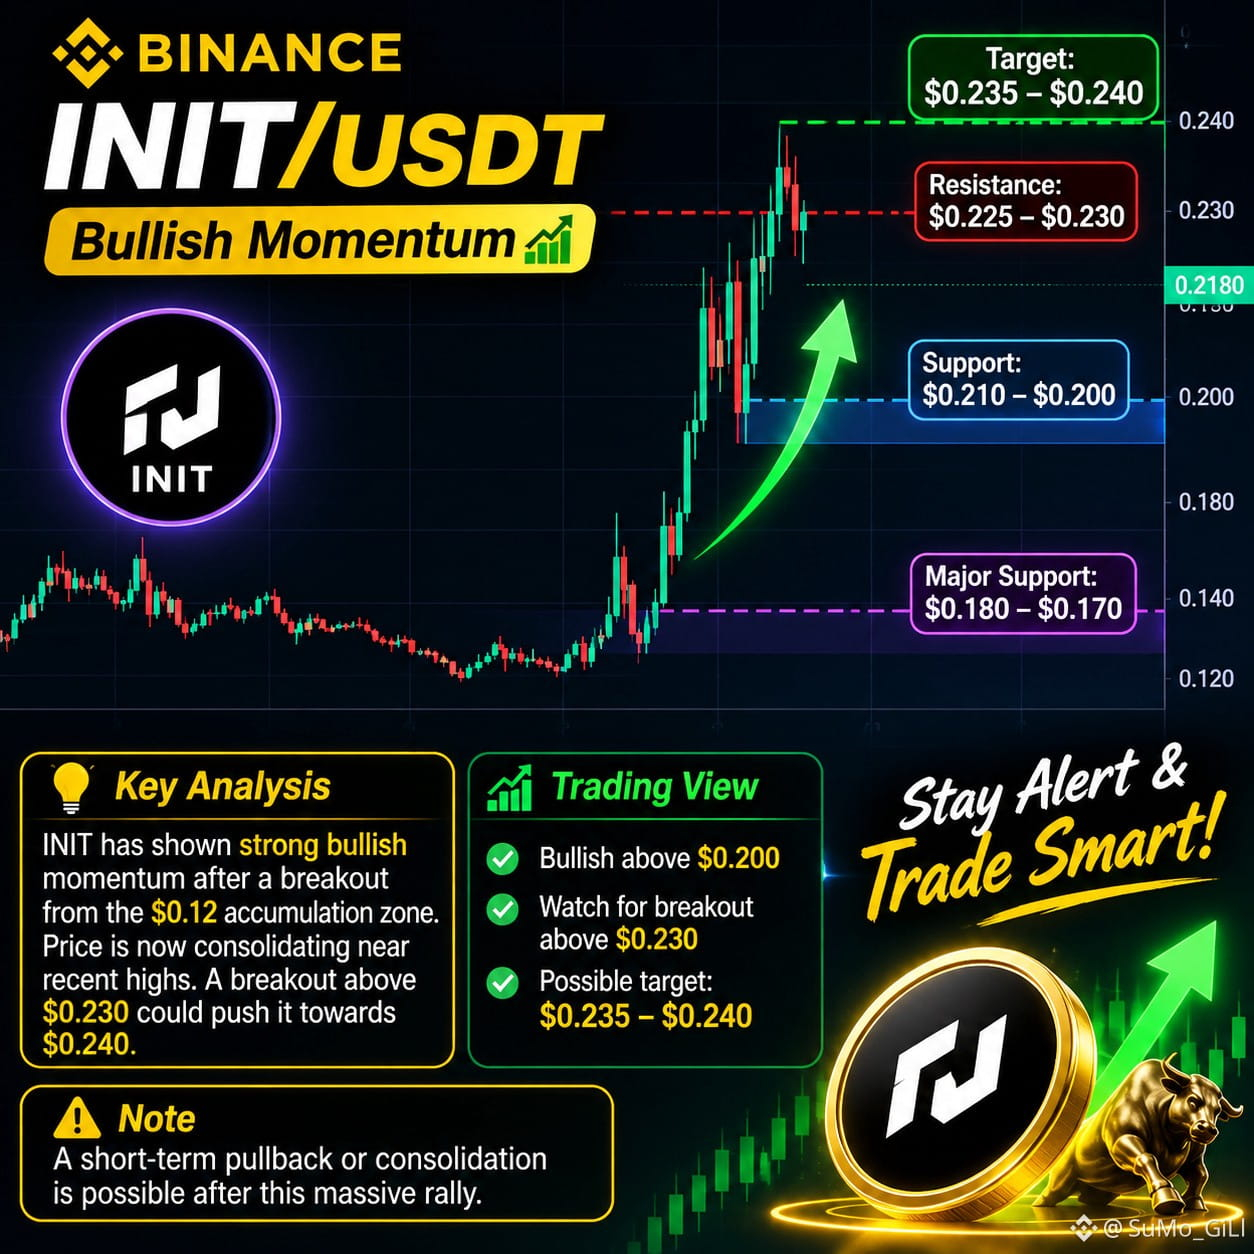
🚀 $INIT /USDT – Bulls Are Taking Control!
INIT is showing impressive bullish momentum after breaking out from the $0.12 accumulation zone.
🔥 Resistance: $0.225–$0.230
🎯 Target: $0.235–$0.240
🛡️ Support: $0.200–$0.210
A confirmed breakout above $0.230 could open the door for another upward move. However, watch for short-term profit-taking after this massive rally.
Stay alert and trade smart! 📈
#INIT #CryptoAnalysis #Binance #ALTCOİNS #TradingSignals_
🚀 $INIT /USDT – Bulls Are Taking Control!
INIT is showing impressive bullish momentum after breaking out from the $0.12 accumulation zone.
🔥 Resistance: $0.225–$0.230
🎯 Target: $0.235–$0.240
🛡️ Support: $0.200–$0.210
A confirmed breakout above $0.230 could open the door for another upward move. However, watch for short-term profit-taking after this massive rally.
Stay alert and trade smart! 📈
#INIT #CryptoAnalysis #Binance #ALTCOİNS #TradingSignals_
INIT is showing impressive bullish momentum after breaking out from the $0.12 accumulation zone.
🔥 Resistance: $0.225–$0.230
🎯 Target: $0.235–$0.240
🛡️ Support: $0.200–$0.210
A confirmed breakout above $0.230 could open the door for another upward move. However, watch for short-term profit-taking after this massive rally.
Stay alert and trade smart! 📈
#INIT #CryptoAnalysis #Binance #ALTCOİNS #TradingSignals_
72
·
--
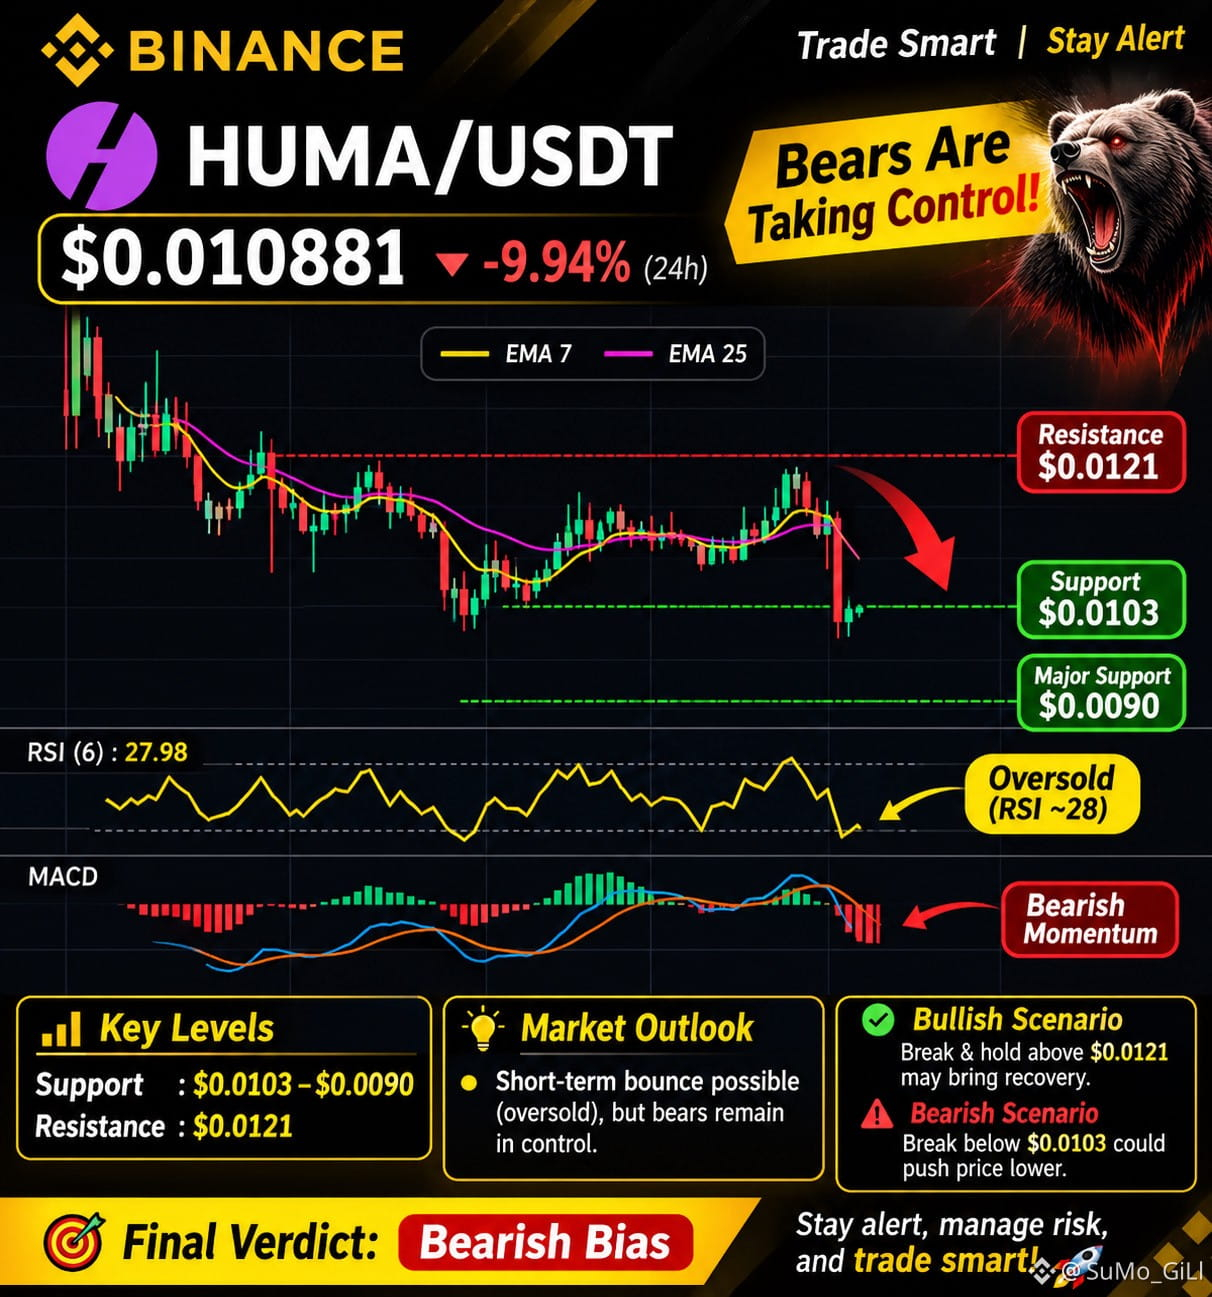
📉 $HUMA /USDT – Bears Are Taking Control!
HUMA is facing strong selling pressure, currently trading around $0.010881, down nearly 9.94% in 24 hours.
🔻 RSI is near 28, indicating oversold conditions. 🔻 MACD signals bearish momentum. 🔻 Price remains below EMA 7 and EMA 25.
🎯 Key Levels:
Support: $0.0103 – $0.0090
Resistance: $0.0121
Bullish breakout above $0.0121 could bring recovery.
⚠️ A short-term bounce is possible, but bears remain in control until buyers confirm a reversal.
Stay alert, manage risk, and trade smart! 🚀
#HUMA #humausdt #Binance #CryptoAnalysis #Altcoins #TechnicalAnalysis #CryptoTrading
📉 $HUMA /USDT – Bears Are Taking Control!
HUMA is facing strong selling pressure, currently trading around $0.010881, down nearly 9.94% in 24 hours.
🔻 RSI is near 28, indicating oversold conditions. 🔻 MACD signals bearish momentum. 🔻 Price remains below EMA 7 and EMA 25.
🎯 Key Levels:
Support: $0.0103 – $0.0090
Resistance: $0.0121
Bullish breakout above $0.0121 could bring recovery.
⚠️ A short-term bounce is possible, but bears remain in control until buyers confirm a reversal.
Stay alert, manage risk, and trade smart! 🚀
#HUMA #humausdt #Binance #CryptoAnalysis #Altcoins #TechnicalAnalysis #CryptoTrading
HUMA is facing strong selling pressure, currently trading around $0.010881, down nearly 9.94% in 24 hours.
🔻 RSI is near 28, indicating oversold conditions. 🔻 MACD signals bearish momentum. 🔻 Price remains below EMA 7 and EMA 25.
🎯 Key Levels:
Support: $0.0103 – $0.0090
Resistance: $0.0121
Bullish breakout above $0.0121 could bring recovery.
⚠️ A short-term bounce is possible, but bears remain in control until buyers confirm a reversal.
Stay alert, manage risk, and trade smart! 🚀
#HUMA #humausdt #Binance #CryptoAnalysis #Altcoins #TechnicalAnalysis #CryptoTrading
499
·
--
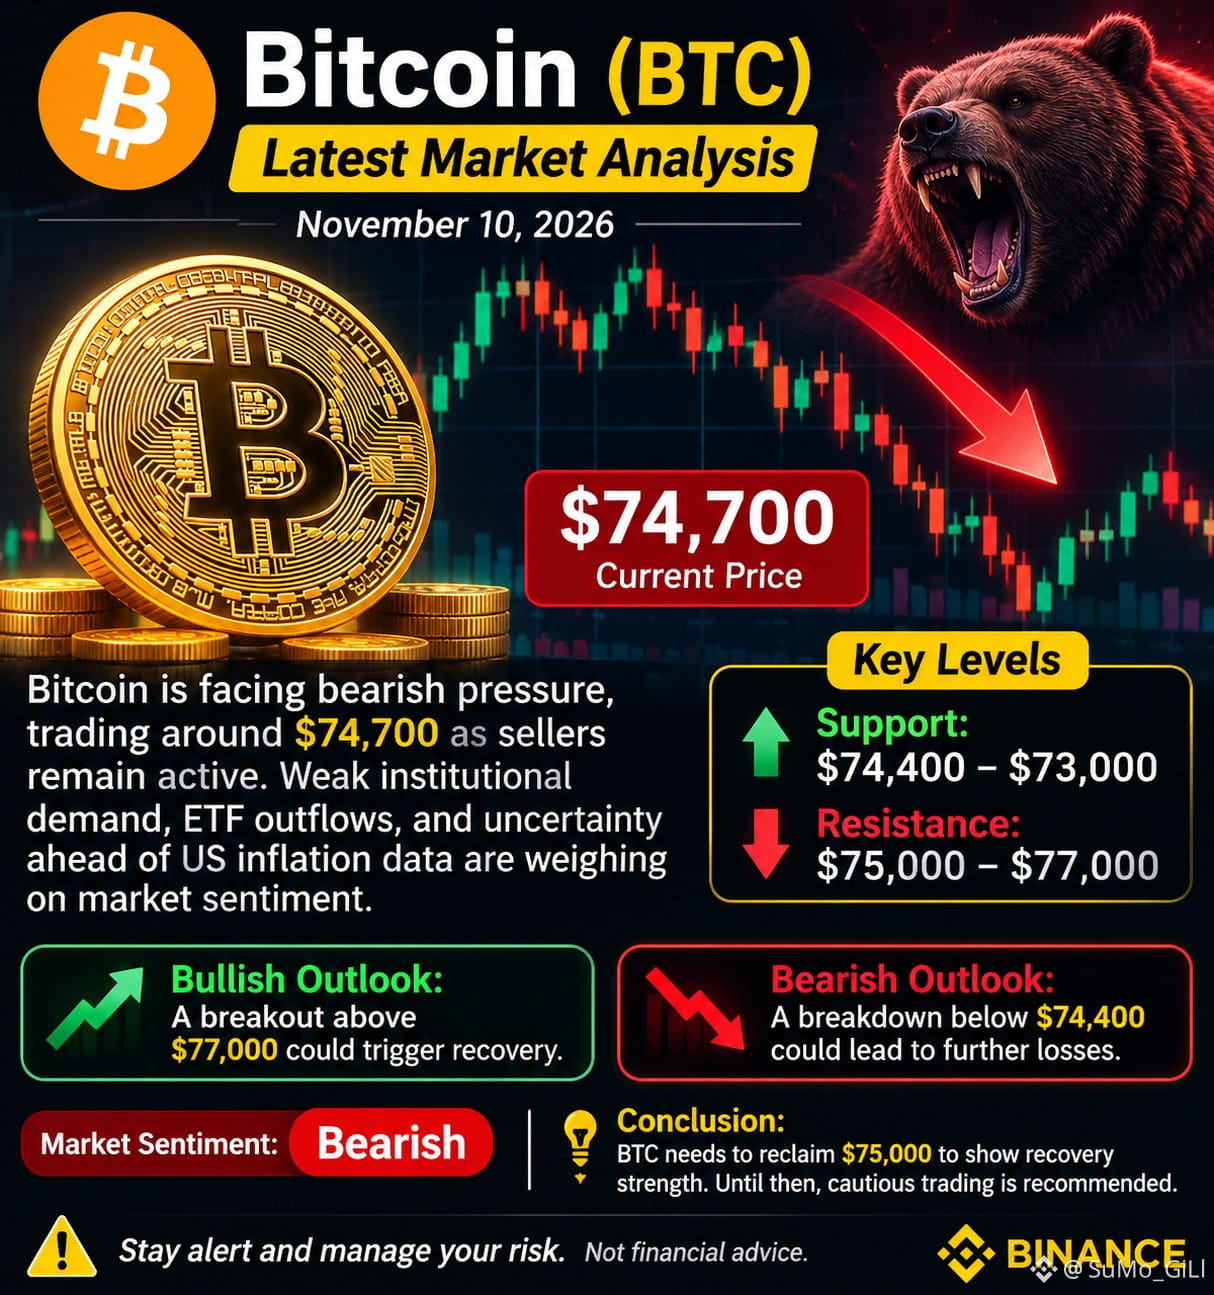
Bitcoin is facing bearish pressure, trading around $BTC 74,700 as sellers remain active. Weak institutional demand, ETF outflows, and uncertainty ahead of US inflation data are weighing on market sentiment.
Key Levels:
🟢 Support: $74,400 – $73,000
🔴 Resistance: $75,000 – $77,000
📈 Bullish outlook: A breakout above $77,000 could trigger recovery.
📉 Bearish outlook: A breakdown below $74,400 could lead to further losses.
{spot}(BTCUSDT)
#BTC #bullish
Bitcoin is facing bearish pressure, trading around $BTC 74,700 as sellers remain active. Weak institutional demand, ETF outflows, and uncertainty ahead of US inflation data are weighing on market sentiment.
Key Levels:
🟢 Support: $74,400 – $73,000
🔴 Resistance: $75,000 – $77,000
📈 Bullish outlook: A breakout above $77,000 could trigger recovery.
📉 Bearish outlook: A breakdown below $74,400 could lead to further losses.
#BTC #bullish
Key Levels:
🟢 Support: $74,400 – $73,000
🔴 Resistance: $75,000 – $77,000
📈 Bullish outlook: A breakout above $77,000 could trigger recovery.
📉 Bearish outlook: A breakdown below $74,400 could lead to further losses.
#BTC #bullish
73
·
--
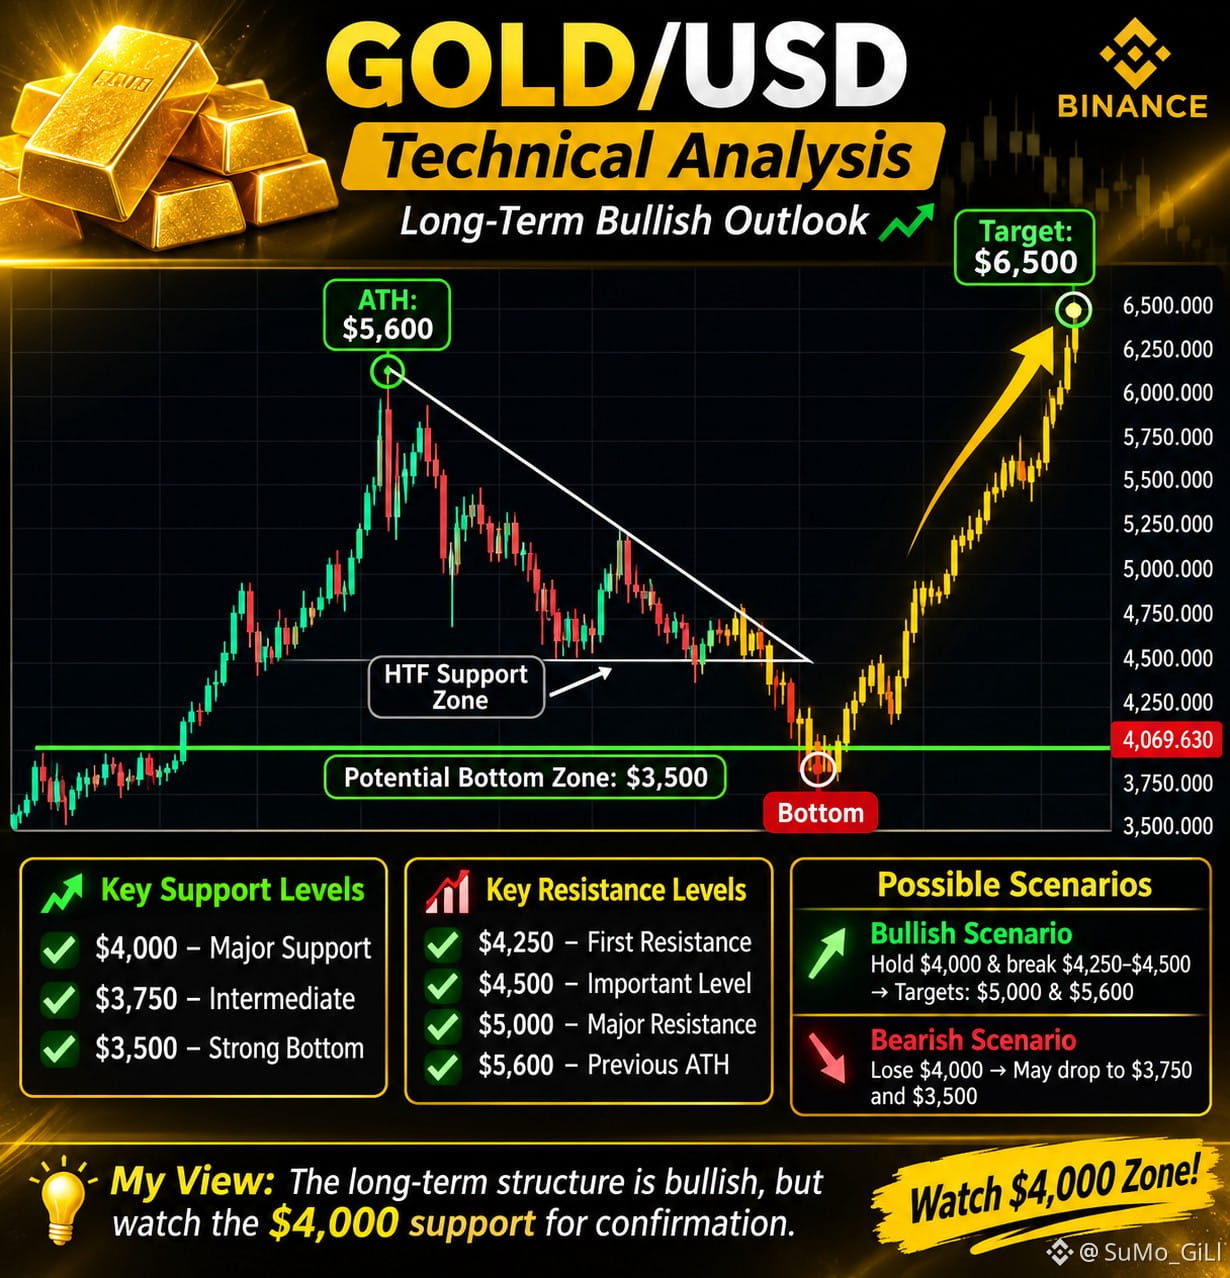
🥇 $GOLD.US /USD: A Major Move Ahead?
Gold is approaching a crucial HTF support zone around $4,000. The overall long-term structure suggests potential bullish continuation if buyers defend this area.
🎯 Key Levels:
Support: $4,000 / $3,750 / $3,500
Resistance: $4,250 / $4,500 / $5,000
Long-term targets: $5,600 – $6,500
📈 A successful breakout could open the door to new highs, while losing support may trigger another correction.
Watch the $4,000 zone closely.
#Gold #XAUUSD #GoldAnalysis #Trading #TechnicalAnalysis #CryptoAndFinance
🥇 $GOLD.US /USD: A Major Move Ahead?
Gold is approaching a crucial HTF support zone around $4,000. The overall long-term structure suggests potential bullish continuation if buyers defend this area.
🎯 Key Levels:
Support: $4,000 / $3,750 / $3,500
Resistance: $4,250 / $4,500 / $5,000
Long-term targets: $5,600 – $6,500
📈 A successful breakout could open the door to new highs, while losing support may trigger another correction.
Watch the $4,000 zone closely.
#Gold #XAUUSD #GoldAnalysis #Trading #TechnicalAnalysis #CryptoAndFinance
Gold is approaching a crucial HTF support zone around $4,000. The overall long-term structure suggests potential bullish continuation if buyers defend this area.
🎯 Key Levels:
Support: $4,000 / $3,750 / $3,500
Resistance: $4,250 / $4,500 / $5,000
Long-term targets: $5,600 – $6,500
📈 A successful breakout could open the door to new highs, while losing support may trigger another correction.
Watch the $4,000 zone closely.
#Gold #XAUUSD #GoldAnalysis #Trading #TechnicalAnalysis #CryptoAndFinance
85
·
--
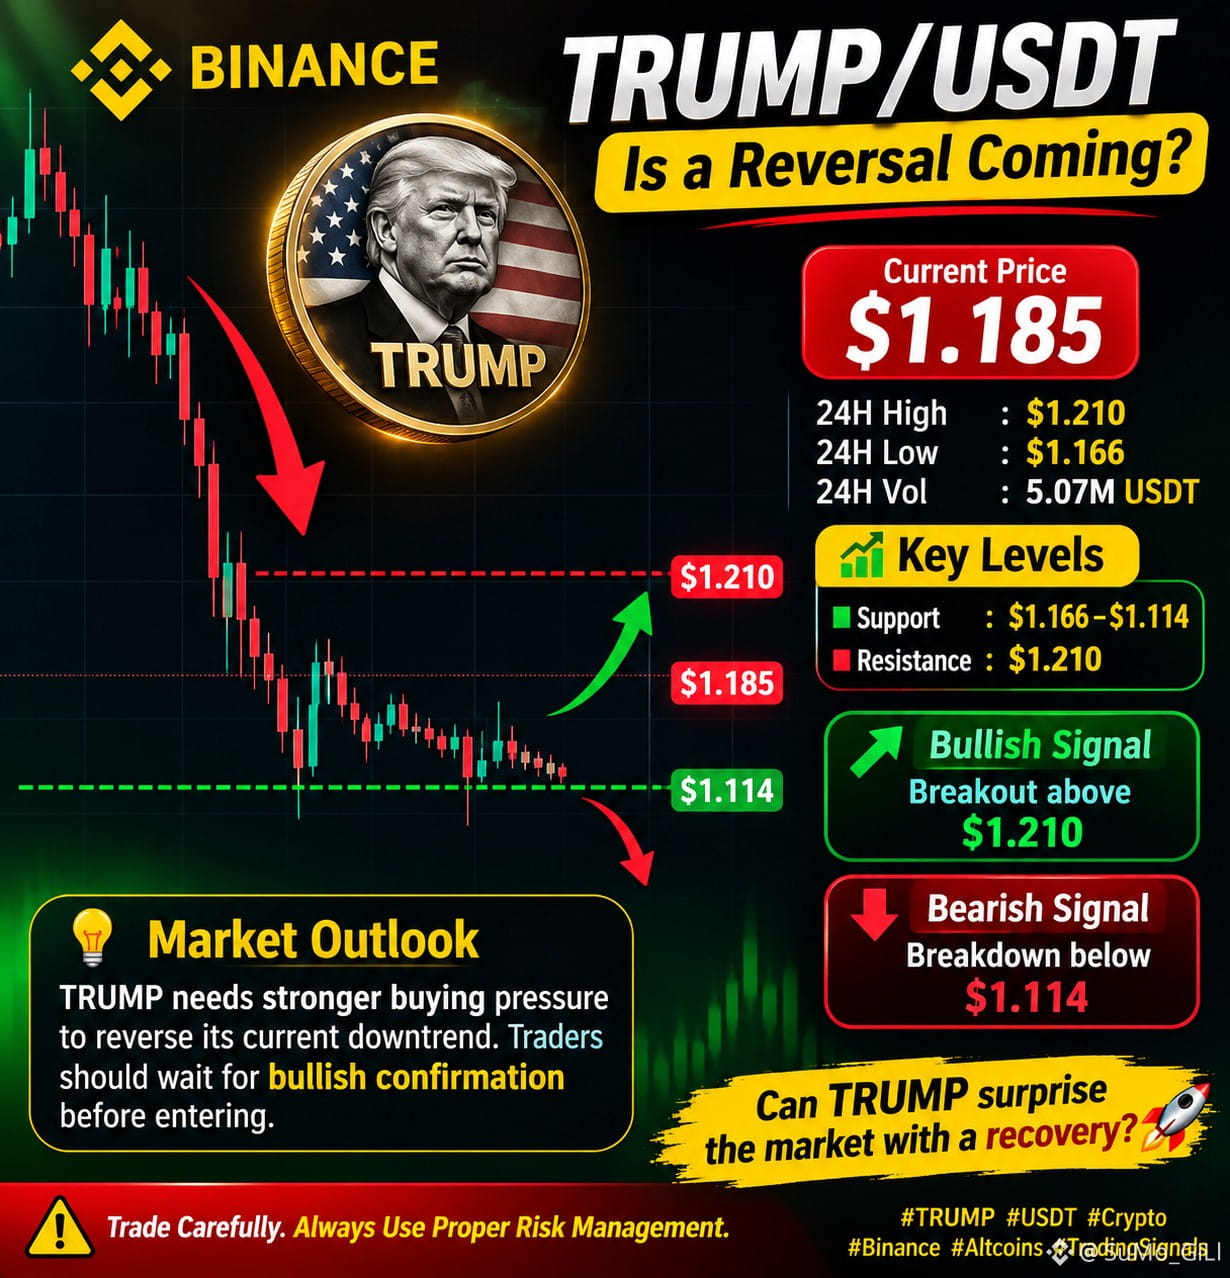
🚀 $TRUMP /$USDT – Is a Reversal Coming?
TRUMP is currently trading around $1.185, facing strong bearish pressure. 📉
The weekly chart shows a significant downtrend, but the current support zone could become an important turning point.
🔹 Support: $1.166 – $1.114
🔹 Resistance: $1.210
🔹 Bullish Signal: Breakout above $1.210
🔹 Bearish Signal: Breakdown below $1.114
👀 Traders should watch for a volume increase and bullish confirmation before entering.
Can TRUMP surprise the market with a recovery? 🚀
#TRUMP #USDT #Crypto #Binance
{spot}(TRUMPUSDT)
🚀 $TRUMP /$USDT – Is a Reversal Coming?
TRUMP is currently trading around $1.185, facing strong bearish pressure. 📉
The weekly chart shows a significant downtrend, but the current support zone could become an important turning point.
🔹 Support: $1.166 – $1.114
🔹 Resistance: $1.210
🔹 Bullish Signal: Breakout above $1.210
🔹 Bearish Signal: Breakdown below $1.114
👀 Traders should watch for a volume increase and bullish confirmation before entering.
Can TRUMP surprise the market with a recovery? 🚀
#TRUMP #USDT #Crypto #Binance
TRUMP is currently trading around $1.185, facing strong bearish pressure. 📉
The weekly chart shows a significant downtrend, but the current support zone could become an important turning point.
🔹 Support: $1.166 – $1.114
🔹 Resistance: $1.210
🔹 Bullish Signal: Breakout above $1.210
🔹 Bearish Signal: Breakdown below $1.114
👀 Traders should watch for a volume increase and bullish confirmation before entering.
Can TRUMP surprise the market with a recovery? 🚀
#TRUMP #USDT #Crypto #Binance
264
·
--
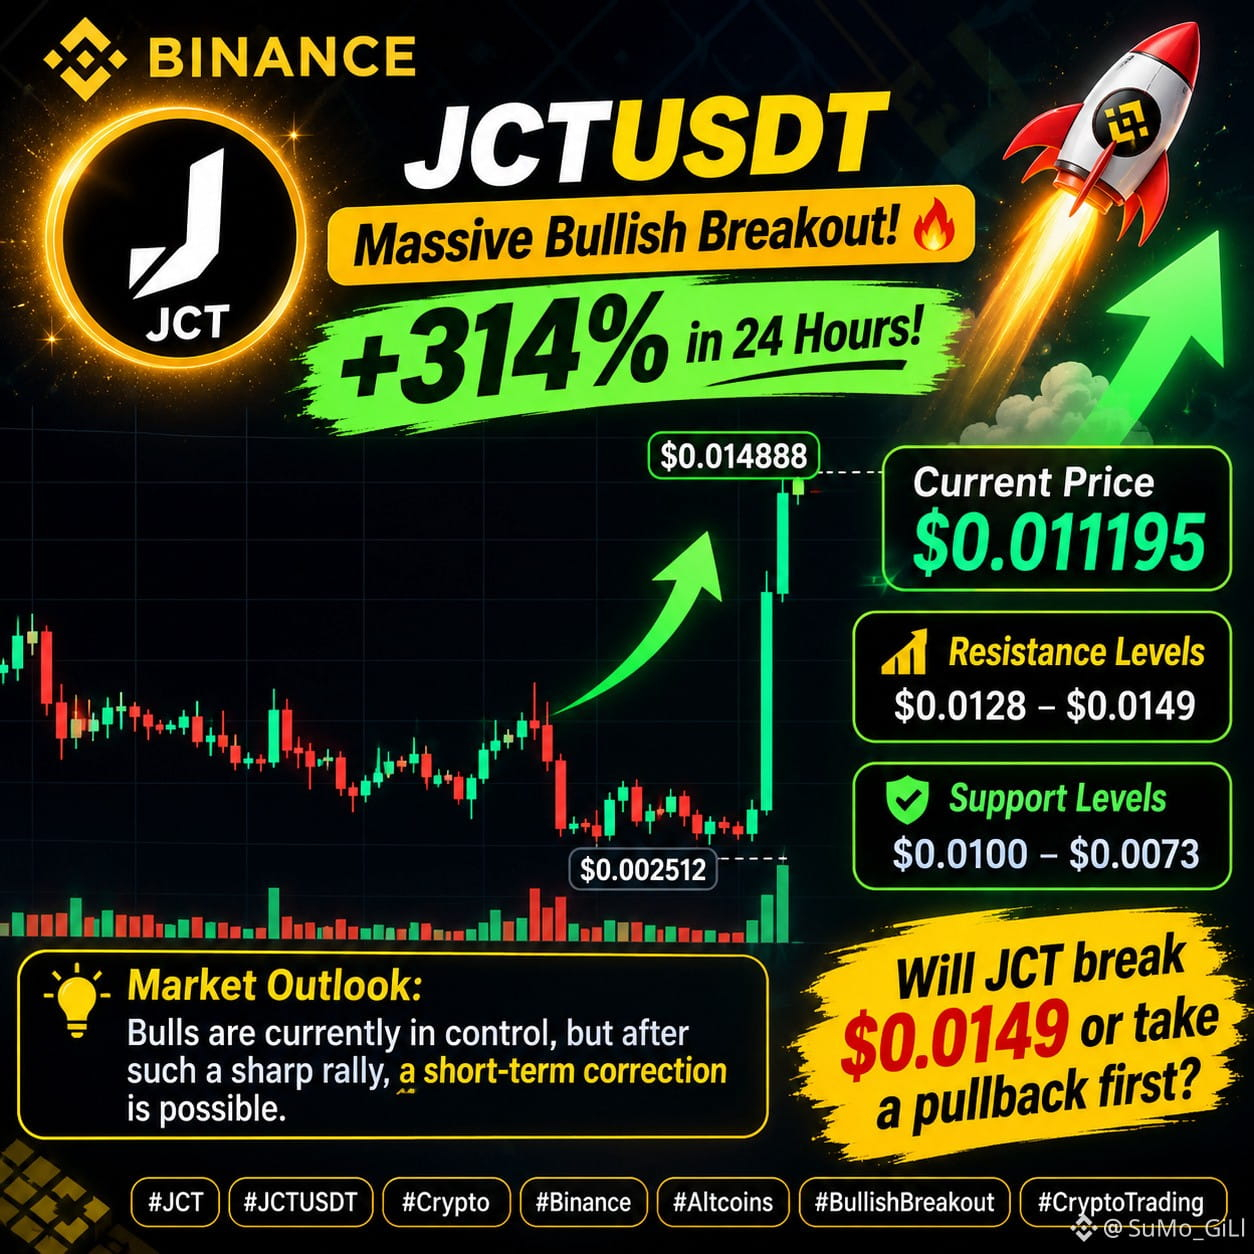
🚀 $JCT $USDT – Massive Bullish Breakout! 🔥
JCT is making a powerful move, surging +314% in 24 hours with a huge spike in trading volume! 📈
💰 Current Price: $0.011195
🎯 Resistance: $0.0128 – $0.0149
🛡️ Support: $0.0100 – $0.0073
Market Outlook: Bulls are currently in control, but after such a sharp rally, a short-term correction is possible.
⚡ Will JCT break $0.0149 or take a pullback first?
#JCT #JCTUSDT #crypto #Binance
{future}(JCTUSDT)
🚀 $JCT $USDT – Massive Bullish Breakout! 🔥
JCT is making a powerful move, surging +314% in 24 hours with a huge spike in trading volume! 📈
💰 Current Price: $0.011195
🎯 Resistance: $0.0128 – $0.0149
🛡️ Support: $0.0100 – $0.0073
Market Outlook: Bulls are currently in control, but after such a sharp rally, a short-term correction is possible.
⚡ Will JCT break $0.0149 or take a pullback first?
#JCT #JCTUSDT #crypto #Binance
JCT is making a powerful move, surging +314% in 24 hours with a huge spike in trading volume! 📈
💰 Current Price: $0.011195
🎯 Resistance: $0.0128 – $0.0149
🛡️ Support: $0.0100 – $0.0073
Market Outlook: Bulls are currently in control, but after such a sharp rally, a short-term correction is possible.
⚡ Will JCT break $0.0149 or take a pullback first?
#JCT #JCTUSDT #crypto #Binance
465
·
--
$SHIB is showing a strong bullish trend in the provided chart, with higher highs and higher lows. Buying pressure appears to be increasing, supported by rising trading volume.
Trend: Strong bullish momentum.
Support: $0.0060–$0.0070 (as shown in the image).
Resistance: $0.0080–$0.0100.
Bullish outlook: A breakout above resistance could create further upside potential.
Risk: Profit-taking or a correction may occur after the sharp rally.
$0.01 Target: An ambitious long-term target, not a confirmed prediction. The chart's prices should be verified against a live $SHIB /$USDT exchange chart.
{spot}(SHIBUSDT)
#shiba⚡ #USDT
$SHIB is showing a strong bullish trend in the provided chart, with higher highs and higher lows. Buying pressure appears to be increasing, supported by rising trading volume.
Trend: Strong bullish momentum.
Support: $0.0060–$0.0070 (as shown in the image).
Resistance: $0.0080–$0.0100.
Bullish outlook: A breakout above resistance could create further upside potential.
Risk: Profit-taking or a correction may occur after the sharp rally.
$0.01 Target: An ambitious long-term target, not a confirmed prediction. The chart's prices should be verified against a live $SHIB /$USDT exchange chart.
#shiba⚡ #USDT
Trend: Strong bullish momentum.
Support: $0.0060–$0.0070 (as shown in the image).
Resistance: $0.0080–$0.0100.
Bullish outlook: A breakout above resistance could create further upside potential.
Risk: Profit-taking or a correction may occur after the sharp rally.
$0.01 Target: An ambitious long-term target, not a confirmed prediction. The chart's prices should be verified against a live $SHIB /$USDT exchange chart.
#shiba⚡ #USDT

5
722
·
--
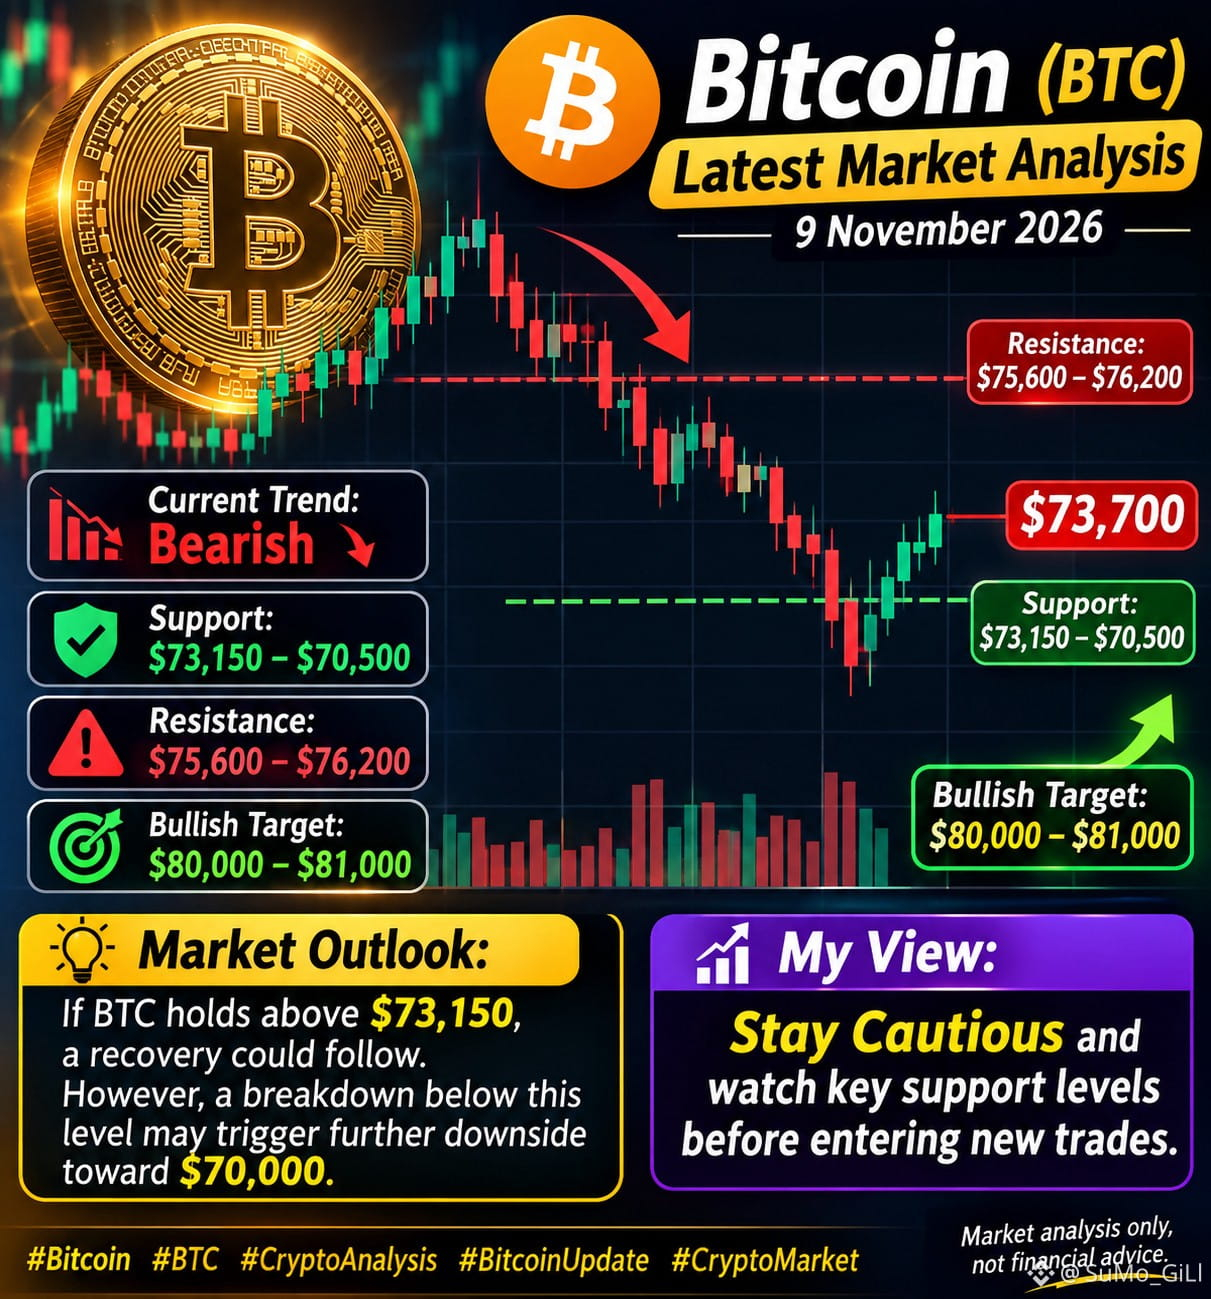
Bitcoin is facing strong selling pressure after dropping below $BTC 75,000, recently touching around $73,700. Market volatility and heavy liquidations are creating uncertainty.
Current Trend: Bearish 📉
Support: $73,150 – $70,500
Resistance: $75,600 – $76,200
Bullish Target: $80,000 – $81,000
Market Outlook: If BTC holds above $73,150, a recovery could follow. However, a breakdown below this level may trigger further downside toward $70,000.
My View: Stay cautious and watch key support levels before entering new trades.
#bitcoin #BTC #CryptoAnalysis20 #BitcoinUpdate #CryptoMarket
Bitcoin is facing strong selling pressure after dropping below $BTC 75,000, recently touching around $73,700. Market volatility and heavy liquidations are creating uncertainty.
Current Trend: Bearish 📉
Support: $73,150 – $70,500
Resistance: $75,600 – $76,200
Bullish Target: $80,000 – $81,000
Market Outlook: If BTC holds above $73,150, a recovery could follow. However, a breakdown below this level may trigger further downside toward $70,000.
My View: Stay cautious and watch key support levels before entering new trades.
#bitcoin #BTC #CryptoAnalysis20 #BitcoinUpdate #CryptoMarket
Current Trend: Bearish 📉
Support: $73,150 – $70,500
Resistance: $75,600 – $76,200
Bullish Target: $80,000 – $81,000
Market Outlook: If BTC holds above $73,150, a recovery could follow. However, a breakdown below this level may trigger further downside toward $70,000.
My View: Stay cautious and watch key support levels before entering new trades.
#bitcoin #BTC #CryptoAnalysis20 #BitcoinUpdate #CryptoMarket
97
·
--
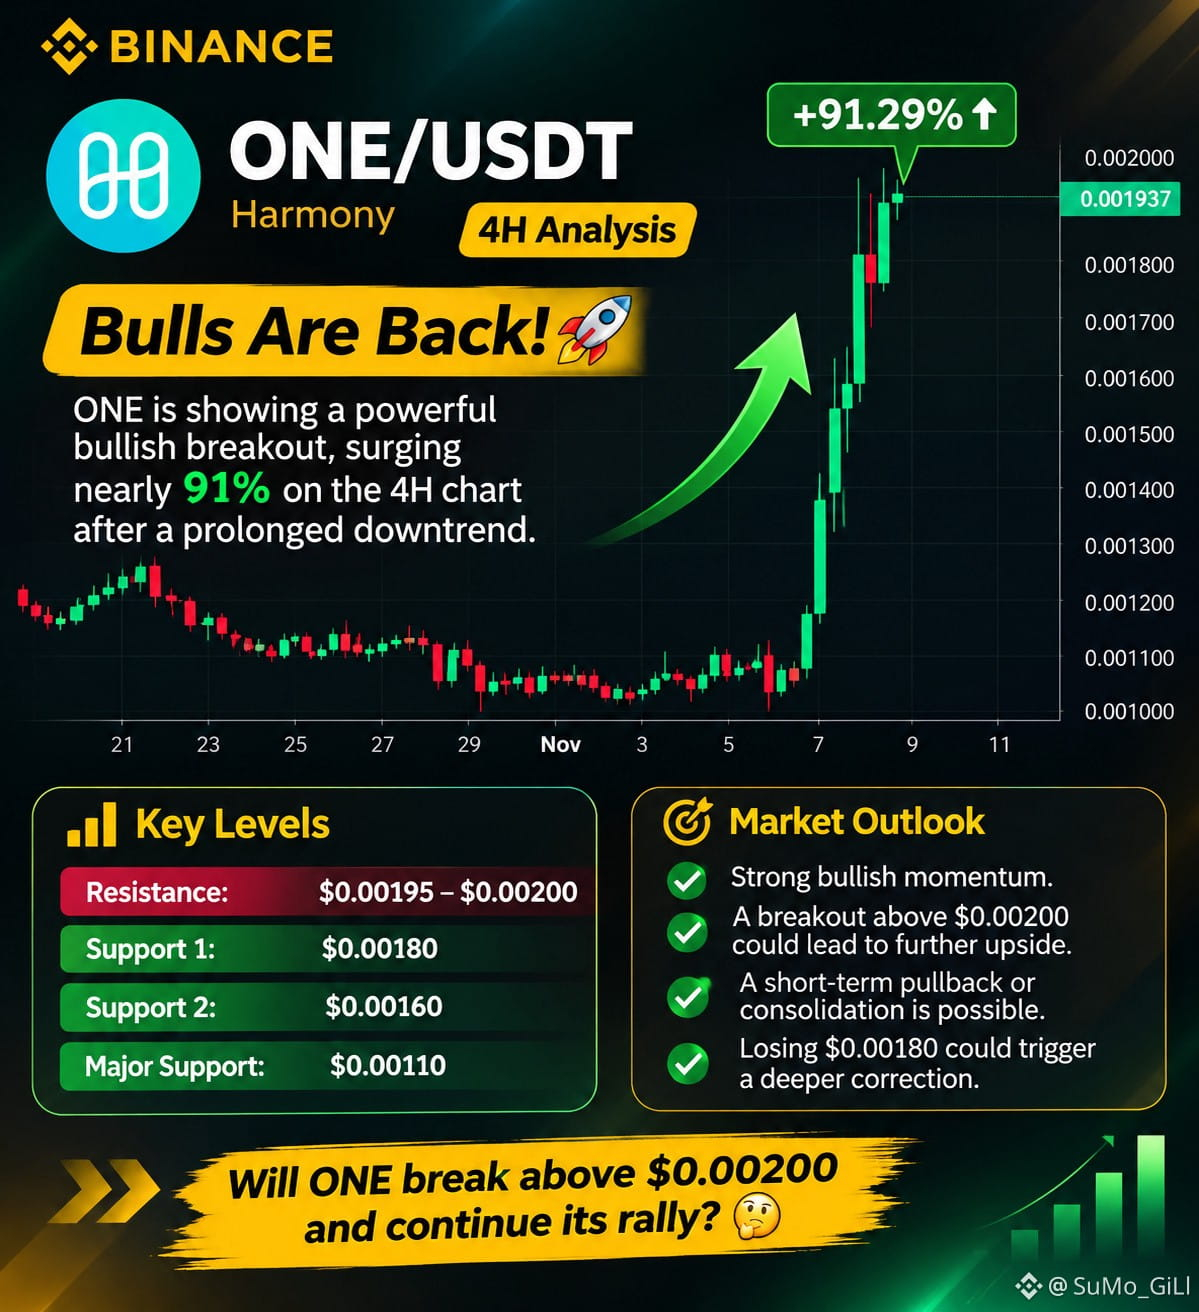
Harmony $ONE is making a powerful move, surging nearly 91% on the 4H chart! 📈
After a prolonged downtrend, buyers have stepped in with strong momentum.
🎯 Key Resistance: $USDT 0.00200
🛡️ Key Support: $0.00180
📊 Bullish momentum remains strong, but a short-term pullback is possible
{spot}(ONEUSDT)
Harmony $ONE is making a powerful move, surging nearly 91% on the 4H chart! 📈
After a prolonged downtrend, buyers have stepped in with strong momentum.
🎯 Key Resistance: $USDT 0.00200
🛡️ Key Support: $0.00180
📊 Bullish momentum remains strong, but a short-term pullback is possible
After a prolonged downtrend, buyers have stepped in with strong momentum.
🎯 Key Resistance: $USDT 0.00200
🛡️ Key Support: $0.00180
📊 Bullish momentum remains strong, but a short-term pullback is possible
272
·
--
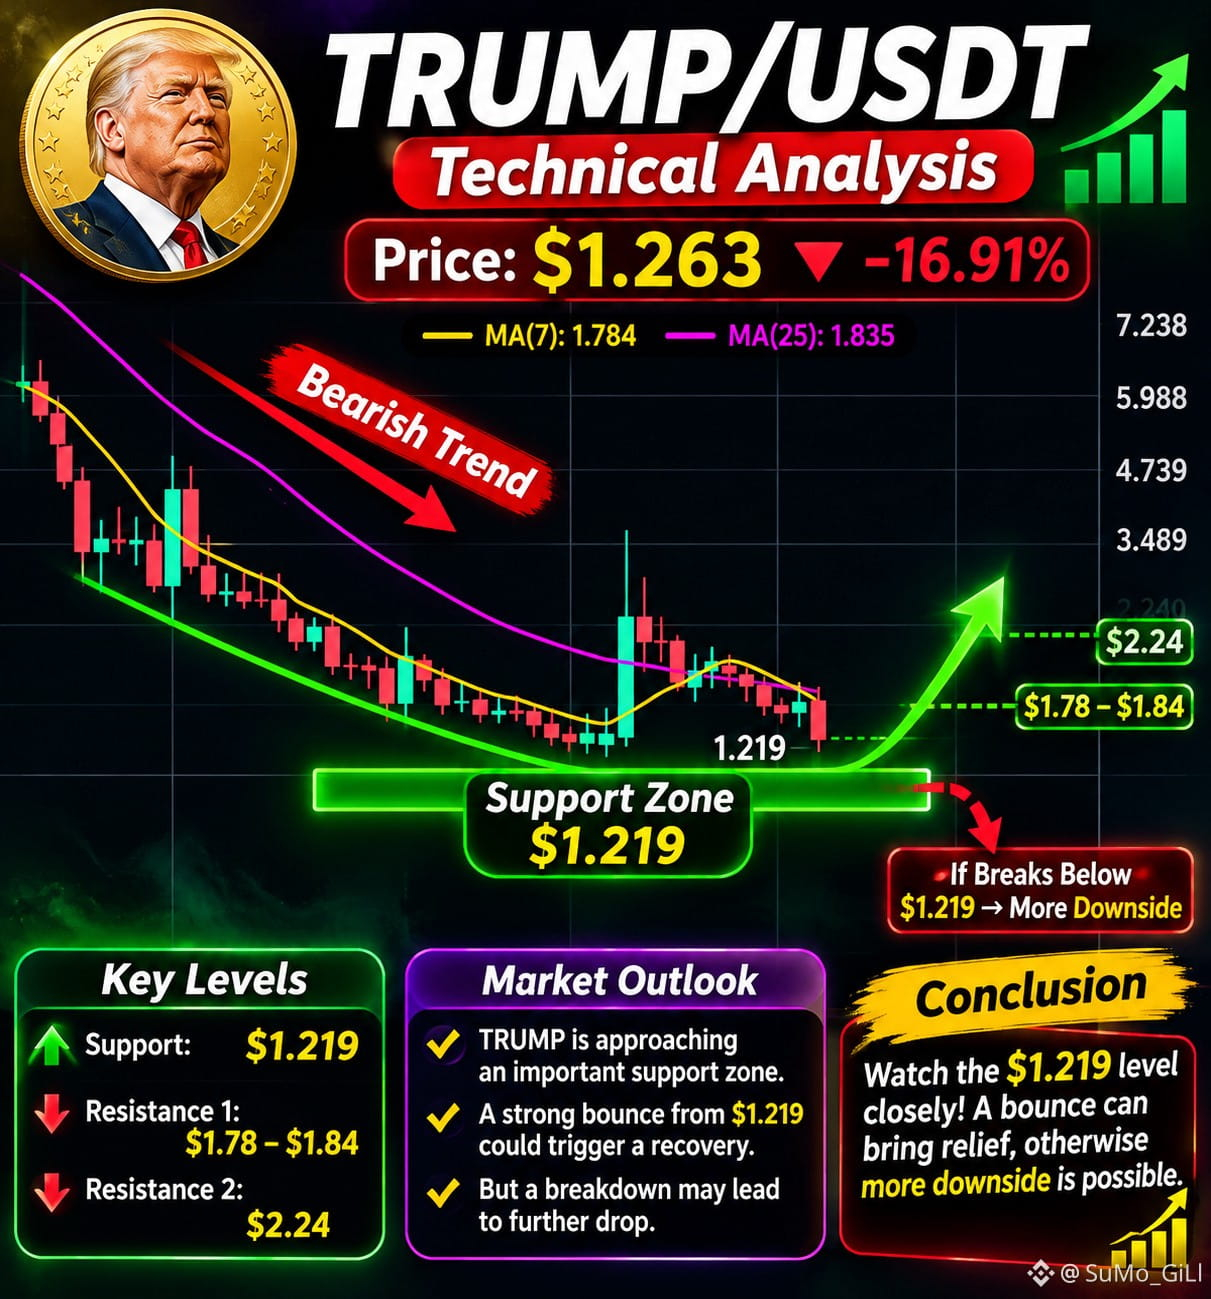
$TRUMP is currently trading at $USDT 1.263, down 16.91%. The weekly chart shows strong bearish momentum, with price trading below both MA(7) at $1.784 and MA(25) at $1.835.
Support Zone: $1.219 – A critical area where buyers may step in.
Resistance 1: $1.78 – $1.84.
Resistance 2: $2.24.
Trend: Bearish, with continued selling pressure.
Potential Reversal: A strong bounce from $1.219 could trigger a recovery toward $1.80 and higher.
Market Outlook: TRUMP is approaching an important support zone. If buyers defend $1.219, a short-term recovery may develop. However, a breakdown below this level could lead to further downside.
{spot}(TRUMPUSDT)
#TrumpCryptoSupport #TRUMPUSDT💪🏻
$TRUMP is currently trading at $USDT 1.263, down 16.91%. The weekly chart shows strong bearish momentum, with price trading below both MA(7) at $1.784 and MA(25) at $1.835.
Support Zone: $1.219 – A critical area where buyers may step in.
Resistance 1: $1.78 – $1.84.
Resistance 2: $2.24.
Trend: Bearish, with continued selling pressure.
Potential Reversal: A strong bounce from $1.219 could trigger a recovery toward $1.80 and higher.
Market Outlook: TRUMP is approaching an important support zone. If buyers defend $1.219, a short-term recovery may develop. However, a breakdown below this level could lead to further downside.
#TrumpCryptoSupport #TRUMPUSDT💪🏻
Support Zone: $1.219 – A critical area where buyers may step in.
Resistance 1: $1.78 – $1.84.
Resistance 2: $2.24.
Trend: Bearish, with continued selling pressure.
Potential Reversal: A strong bounce from $1.219 could trigger a recovery toward $1.80 and higher.
Market Outlook: TRUMP is approaching an important support zone. If buyers defend $1.219, a short-term recovery may develop. However, a breakdown below this level could lead to further downside.
#TrumpCryptoSupport #TRUMPUSDT💪🏻
193
·
--
The crypto market is showing mixed momentum, with Bitcoin trading near $BTC 75,900. BTC remains relatively stable, while several altcoins are attracting attention.
🔥 Trending Coins
$BTC : $75,900 – holding near current levels.
$QNT : +4.1% – showing positive momentum.
STX: +3.6% – gaining strength.
PEARL: +8.0% – among the notable gainers.
AAVE: +2.2% – showing recovery.
BCH: -4.1% – facing selling pressure.
Market Outlook: Bitcoin needs stronger buying volume to confirm an upward move. QNT, STX and PEARL are worth watching, but volatility remains high.
The crypto market is showing mixed momentum, with Bitcoin trading near $BTC 75,900. BTC remains relatively stable, while several altcoins are attracting attention.
🔥 Trending Coins
$BTC : $75,900 – holding near current levels.
$QNT : +4.1% – showing positive momentum.
STX: +3.6% – gaining strength.
PEARL: +8.0% – among the notable gainers.
AAVE: +2.2% – showing recovery.
BCH: -4.1% – facing selling pressure.
Market Outlook: Bitcoin needs stronger buying volume to confirm an upward move. QNT, STX and PEARL are worth watching, but volatility remains high.
🔥 Trending Coins
$BTC : $75,900 – holding near current levels.
$QNT : +4.1% – showing positive momentum.
STX: +3.6% – gaining strength.
PEARL: +8.0% – among the notable gainers.
AAVE: +2.2% – showing recovery.
BCH: -4.1% – facing selling pressure.
Market Outlook: Bitcoin needs stronger buying volume to confirm an upward move. QNT, STX and PEARL are worth watching, but volatility remains high.

86
·
--
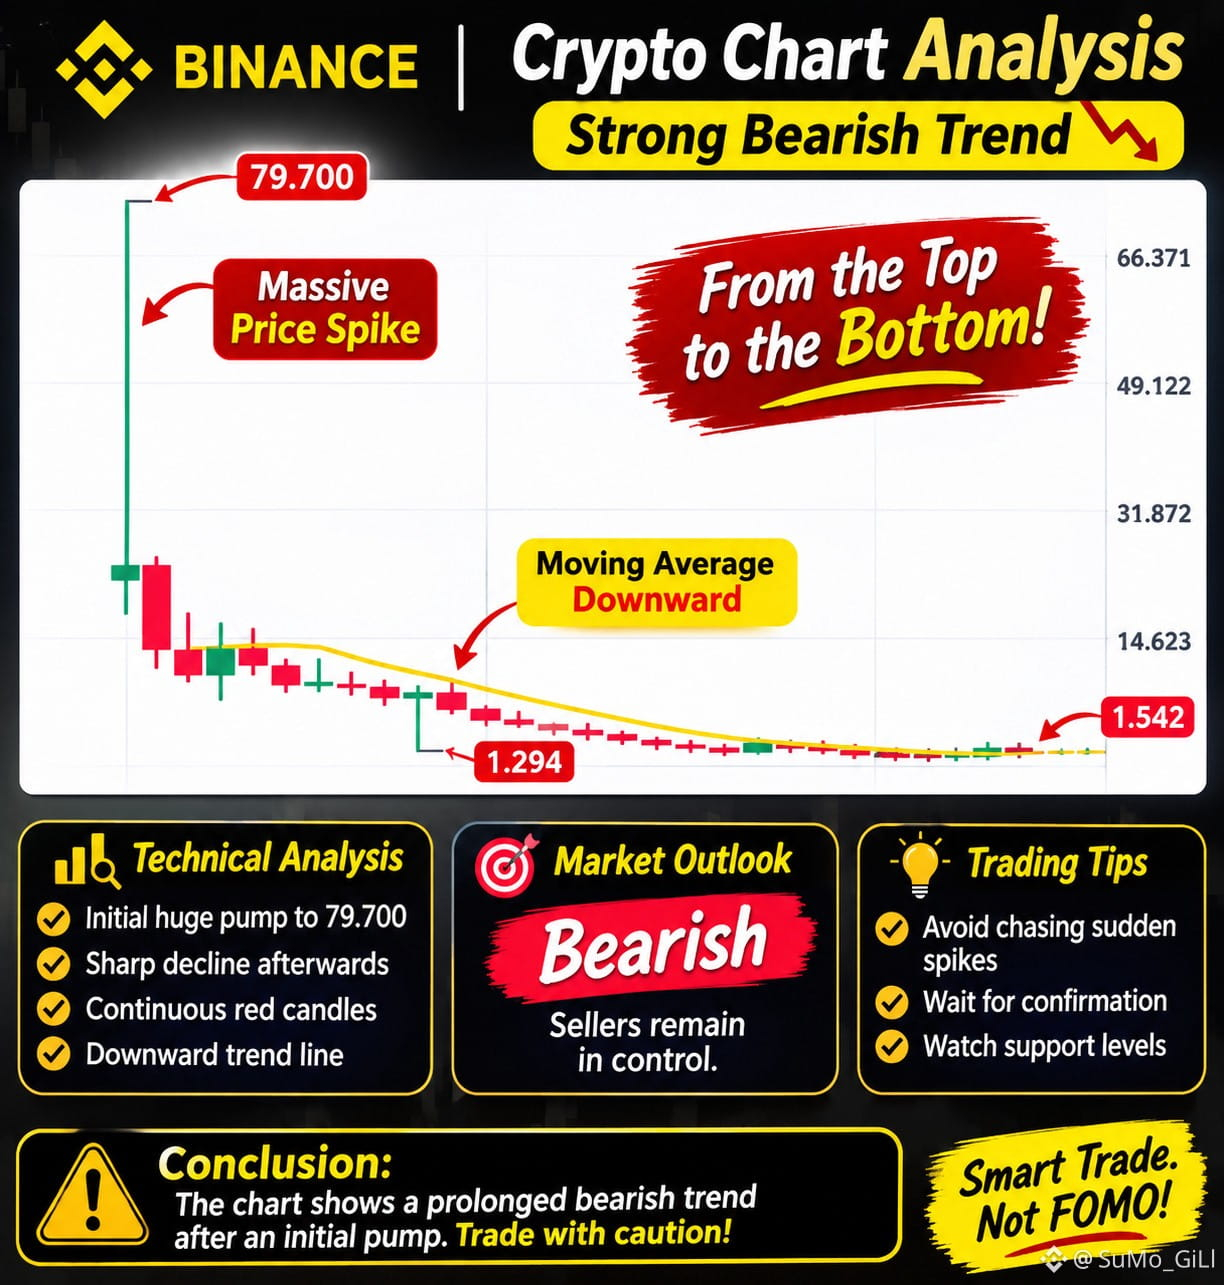
Technical analysis
Initial movement: A sudden pump pushed the price toward $TRUMP 79.700.
Sharp correction: Sellers quickly took control, causing a major price drop.
Downtrend: Consecutive red candles indicate persistent bearish momentum.
Moving average: The yellow moving-average line is sloping downward, confirming weakness.
Current price: Approximately 1.542, as displayed in the chart.
Market outlook
Bearish — Sellers remain in control.
Further downside is possible if selling continues.
A recovery needs strong buying volume.
A break above the moving average could be an early recovery signal.
{spot}(TRUMPUSDT)
#TRUMP
Technical analysis
Initial movement: A sudden pump pushed the price toward $TRUMP 79.700.
Sharp correction: Sellers quickly took control, causing a major price drop.
Downtrend: Consecutive red candles indicate persistent bearish momentum.
Moving average: The yellow moving-average line is sloping downward, confirming weakness.
Current price: Approximately 1.542, as displayed in the chart.
Market outlook
Bearish — Sellers remain in control.
Further downside is possible if selling continues.
A recovery needs strong buying volume.
A break above the moving average could be an early recovery signal.
#TRUMP
Initial movement: A sudden pump pushed the price toward $TRUMP 79.700.
Sharp correction: Sellers quickly took control, causing a major price drop.
Downtrend: Consecutive red candles indicate persistent bearish momentum.
Moving average: The yellow moving-average line is sloping downward, confirming weakness.
Current price: Approximately 1.542, as displayed in the chart.
Market outlook
Bearish — Sellers remain in control.
Further downside is possible if selling continues.
A recovery needs strong buying volume.
A break above the moving average could be an early recovery signal.
#TRUMP
2
1.1k
·
--
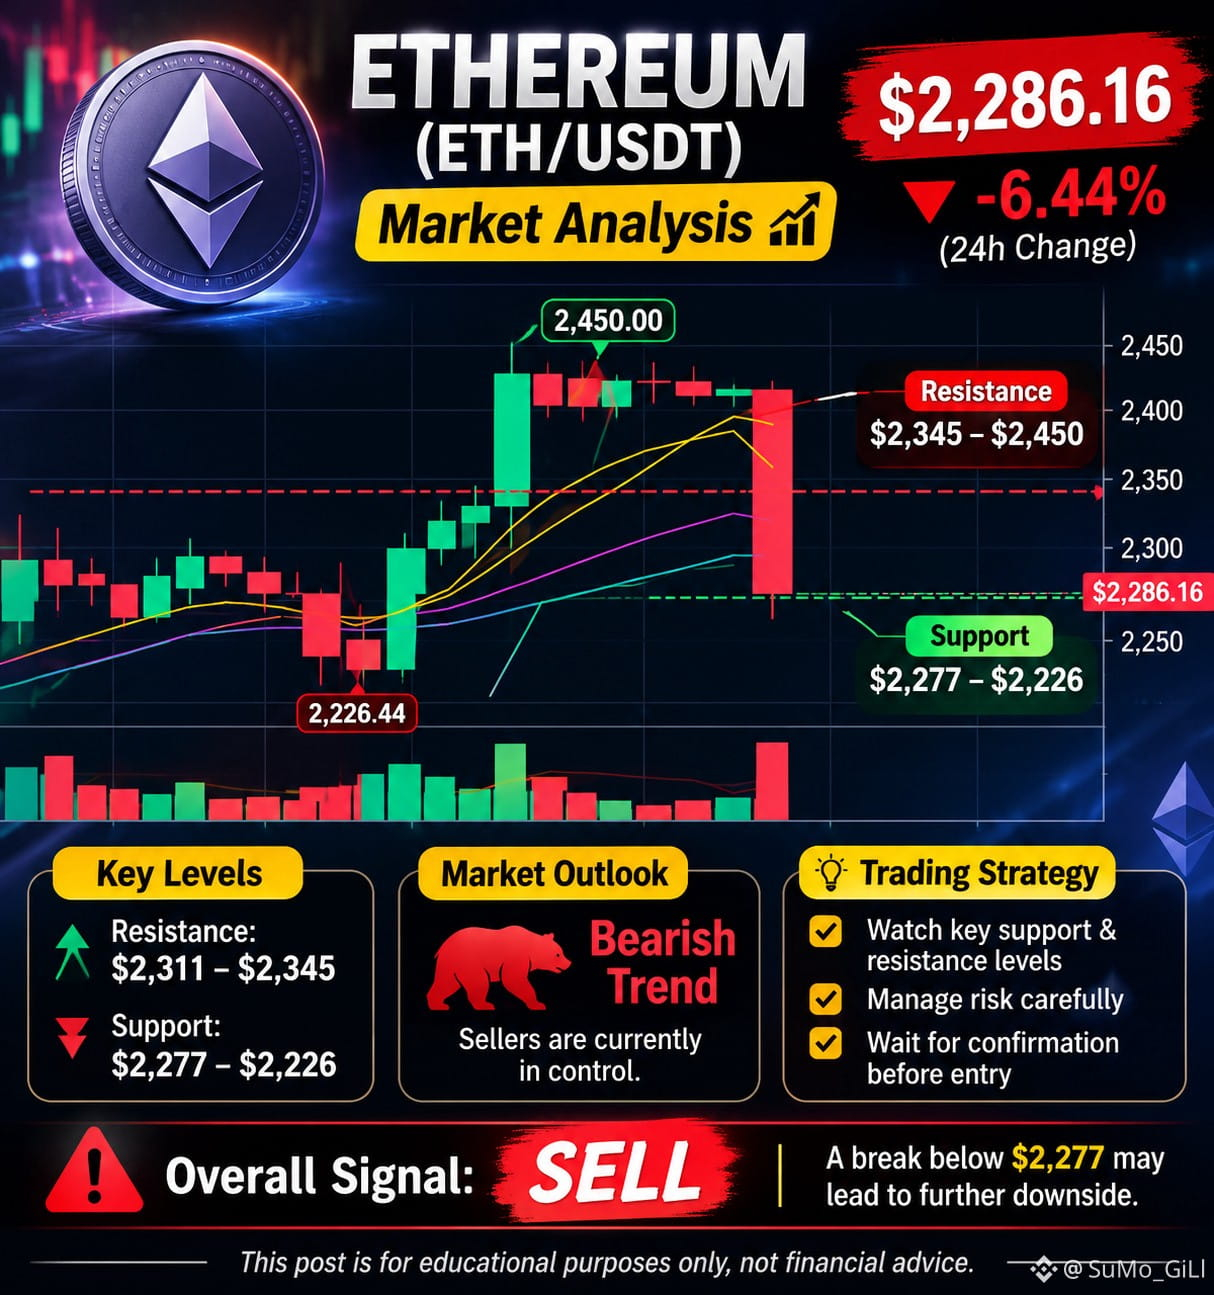
📊 ETHEREUM (ETH/USDT) MARKET ANALYSIS
🔴 Ethereum Faces Strong Selling Pressure!
Ethereum is currently trading around $ETH 2,286, down 6.44% in the last 24 hours.
📉 Technical Analysis:
- Current Price: $2,286.16
- 24H High: $2,446.28
- 24H Low: $2,277.53
- Support Zone: $2,277 – $2,226
- Resistance Zone: $2,311 – $2,345
Market Outlook:
ETH is showing bearish momentum on the 4-hour chart. Increased selling volume suggests that sellers are dominating the market.
⚠️ A break below $2,277 could trigger further downside, while a recovery above $ETH 2,345 may indicate a possible bullish reversal.
📌 Trading Strategy: Watch key support and resistance levels before entering any trade. Manage risk carefully.
{spot}(ETHUSDT)
#CryptoTrends2024 #CryptocurrencyWealth
📊 ETHEREUM (ETH/USDT) MARKET ANALYSIS
🔴 Ethereum Faces Strong Selling Pressure!
Ethereum is currently trading around $ETH 2,286, down 6.44% in the last 24 hours.
📉 Technical Analysis:
- Current Price: $2,286.16
- 24H High: $2,446.28
- 24H Low: $2,277.53
- Support Zone: $2,277 – $2,226
- Resistance Zone: $2,311 – $2,345
Market Outlook:
ETH is showing bearish momentum on the 4-hour chart. Increased selling volume suggests that sellers are dominating the market.
⚠️ A break below $2,277 could trigger further downside, while a recovery above $ETH 2,345 may indicate a possible bullish reversal.
📌 Trading Strategy: Watch key support and resistance levels before entering any trade. Manage risk carefully.
#CryptoTrends2024 #CryptocurrencyWealth
🔴 Ethereum Faces Strong Selling Pressure!
Ethereum is currently trading around $ETH 2,286, down 6.44% in the last 24 hours.
📉 Technical Analysis:
- Current Price: $2,286.16
- 24H High: $2,446.28
- 24H Low: $2,277.53
- Support Zone: $2,277 – $2,226
- Resistance Zone: $2,311 – $2,345
Market Outlook:
ETH is showing bearish momentum on the 4-hour chart. Increased selling volume suggests that sellers are dominating the market.
⚠️ A break below $2,277 could trigger further downside, while a recovery above $ETH 2,345 may indicate a possible bullish reversal.
📌 Trading Strategy: Watch key support and resistance levels before entering any trade. Manage risk carefully.
#CryptoTrends2024 #CryptocurrencyWealth
67
·
--
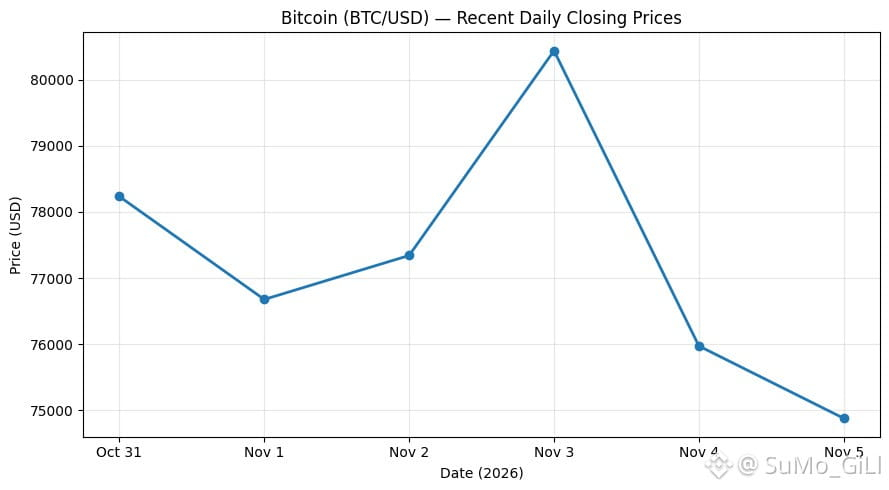
Bitcoin is facing selling pressure after a recent market decline. $BTC is testing important support around $74,979. Weak momentum and market uncertainty suggest caution.
Key levels:
Support: $74,979
Resistance: $76,647
Next target: $78,008
Lower target: $73,294
Market Outlook: If BTC breaks above $76,647, a recovery toward $78,008 is possible. If it falls below $74,979, further downside may follow.
{spot}(BTCUSDT)
#CanUSStocksReboundAfterNonfarmPayrolls? #BinanceReopensWithdrawalsForMoreAssets
Bitcoin is facing selling pressure after a recent market decline. $BTC is testing important support around $74,979. Weak momentum and market uncertainty suggest caution.
Key levels:
Support: $74,979
Resistance: $76,647
Next target: $78,008
Lower target: $73,294
Market Outlook: If BTC breaks above $76,647, a recovery toward $78,008 is possible. If it falls below $74,979, further downside may follow.
#CanUSStocksReboundAfterNonfarmPayrolls? #BinanceReopensWithdrawalsForMoreAssets
Key levels:
Support: $74,979
Resistance: $76,647
Next target: $78,008
Lower target: $73,294
Market Outlook: If BTC breaks above $76,647, a recovery toward $78,008 is possible. If it falls below $74,979, further downside may follow.
#CanUSStocksReboundAfterNonfarmPayrolls? #BinanceReopensWithdrawalsForMoreAssets
68
·
--
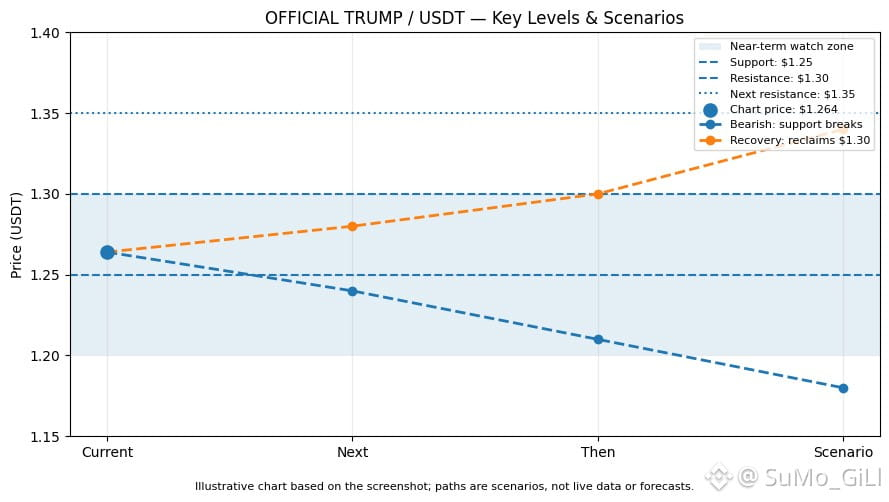
$TRUMP is experiencing strong selling pressure, dropping sharply from around $1.70 to $1.264. The chart shows consecutive red candles, indicating strong bearish momentum.
Support: $1.25 – $1.20
Resistance: $1.30 – $1.35
Bullish Scenario: A recovery above $1.30 could push the price toward $1.35.
Bearish Scenario: A break below $1.25 may trigger further downside.
{spot}(TRUMPUSDT)
#US10YearTreasuryYieldFallsTo4.845% #USMidterms-WhatAreMarketsExpecting?
$TRUMP is experiencing strong selling pressure, dropping sharply from around $1.70 to $1.264. The chart shows consecutive red candles, indicating strong bearish momentum.
Support: $1.25 – $1.20
Resistance: $1.30 – $1.35
Bullish Scenario: A recovery above $1.30 could push the price toward $1.35.
Bearish Scenario: A break below $1.25 may trigger further downside.
#US10YearTreasuryYieldFallsTo4.845% #USMidterms-WhatAreMarketsExpecting?
Support: $1.25 – $1.20
Resistance: $1.30 – $1.35
Bullish Scenario: A recovery above $1.30 could push the price toward $1.35.
Bearish Scenario: A break below $1.25 may trigger further downside.
#US10YearTreasuryYieldFallsTo4.845% #USMidterms-WhatAreMarketsExpecting?
231
·
--
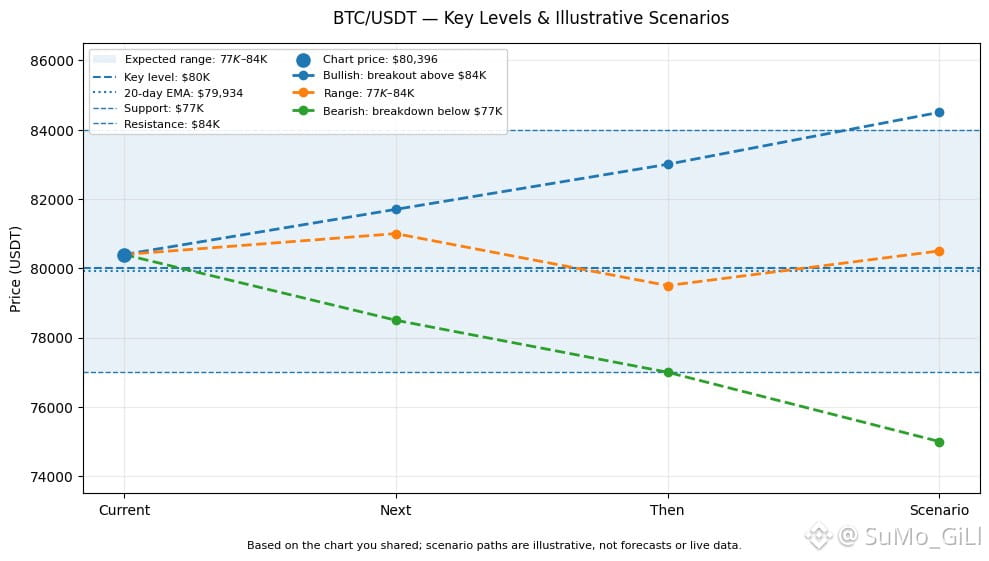
Bitcoin is trading around $BTC 80,396 (+3.6%), showing positive short-term momentum after moving above the 20-day EMA ($79,934).
🟢 Support: $80,000 / $77,000
🔴 Resistance: $82,000 / $84,000
Bullish Scenario: A breakout above $84K could trigger further upside.
Bearish Scenario: A drop below $77K may lead to stronger selling pressure.
Overall Outlook: Slightly bullish, but BTC may remain range-bound between $77K and $84K.
{spot}(BTCUSDT)
#BinanceReopensWithdrawalsForMoreAssets #Binance98PercentReplenished
Bitcoin is trading around $BTC 80,396 (+3.6%), showing positive short-term momentum after moving above the 20-day EMA ($79,934).
🟢 Support: $80,000 / $77,000
🔴 Resistance: $82,000 / $84,000
Bullish Scenario: A breakout above $84K could trigger further upside.
Bearish Scenario: A drop below $77K may lead to stronger selling pressure.
Overall Outlook: Slightly bullish, but BTC may remain range-bound between $77K and $84K.
#BinanceReopensWithdrawalsForMoreAssets #Binance98PercentReplenished
🟢 Support: $80,000 / $77,000
🔴 Resistance: $82,000 / $84,000
Bullish Scenario: A breakout above $84K could trigger further upside.
Bearish Scenario: A drop below $77K may lead to stronger selling pressure.
Overall Outlook: Slightly bullish, but BTC may remain range-bound between $77K and $84K.
#BinanceReopensWithdrawalsForMoreAssets #Binance98PercentReplenished
68
·
--
Bullish
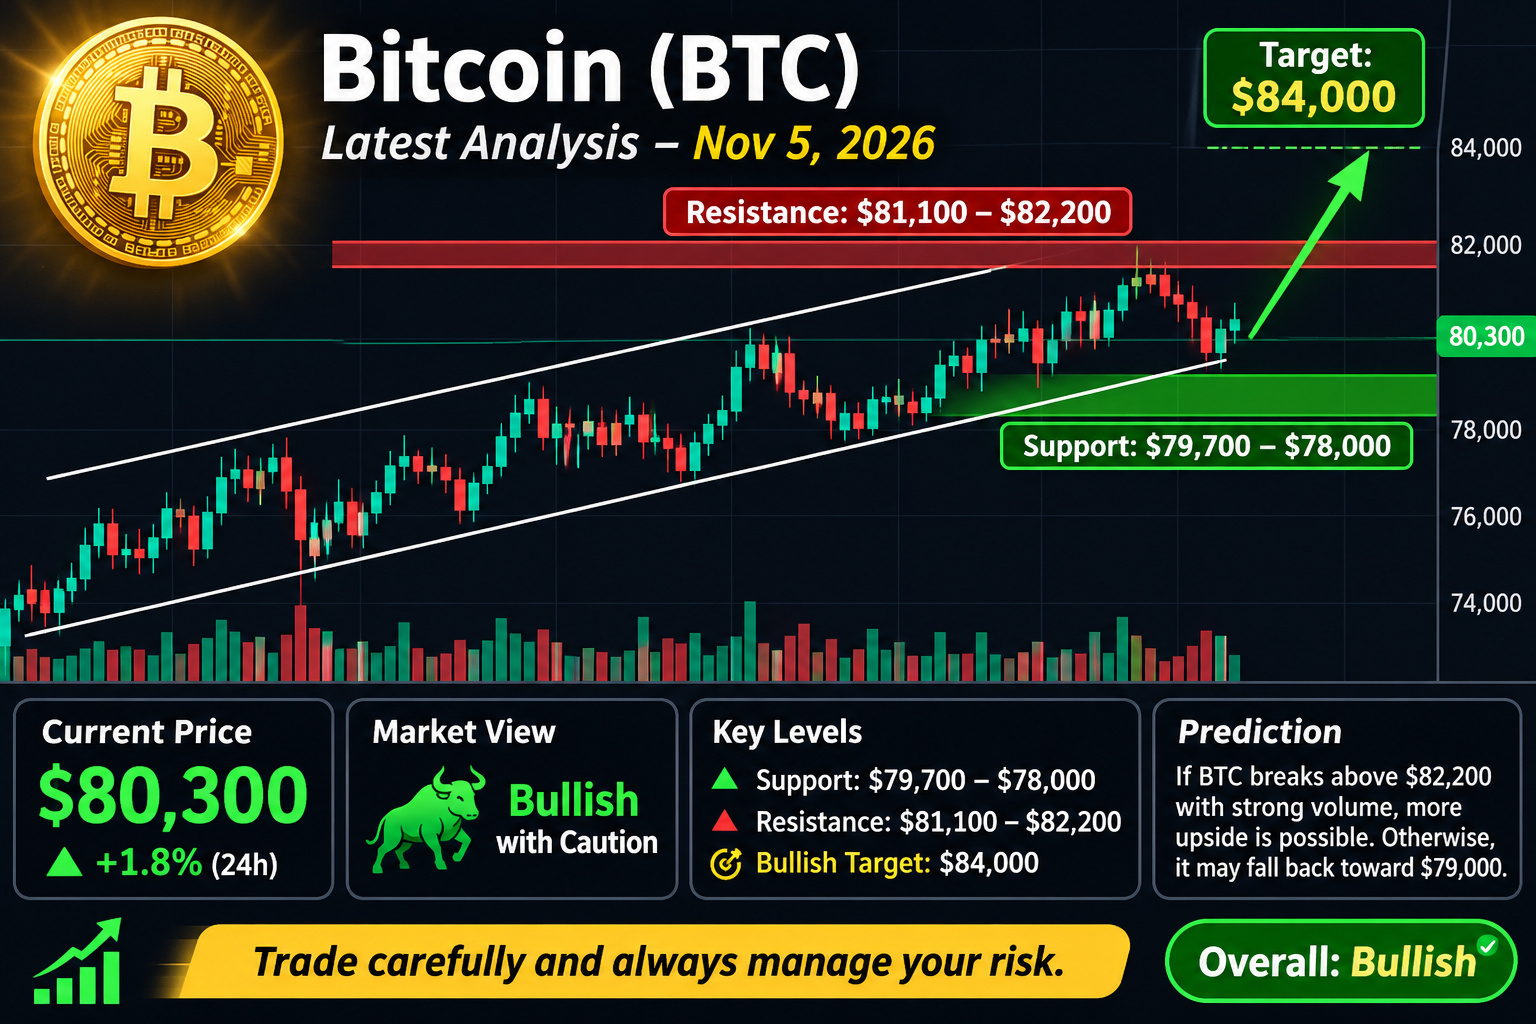
Bitcoin is showing signs of recovery after recent volatility, holding around the $BTC 80,000 level. Buyers are gaining momentum, but strong resistance remains ahead.
Key Levels:
🟢 Support: $79,700 – $78,000
🔴 Resistance: $81,100 – $82,200
🎯 Bullish Target: $84,000
My Market Prediction:
If BTC breaks above $82,200 with strong volume, further upside is possible. However, a rejection could push the price back toward $79,000 or lower.
{spot}(BTCUSDT)
#BinanceReopensWithdrawalsForMoreAssets #Binance98PercentReplenished
Bitcoin is showing signs of recovery after recent volatility, holding around the $BTC 80,000 level. Buyers are gaining momentum, but strong resistance remains ahead.
Key Levels:
🟢 Support: $79,700 – $78,000
🔴 Resistance: $81,100 – $82,200
🎯 Bullish Target: $84,000
My Market Prediction:
If BTC breaks above $82,200 with strong volume, further upside is possible. However, a rejection could push the price back toward $79,000 or lower.
#BinanceReopensWithdrawalsForMoreAssets #Binance98PercentReplenished
Key Levels:
🟢 Support: $79,700 – $78,000
🔴 Resistance: $81,100 – $82,200
🎯 Bullish Target: $84,000
My Market Prediction:
If BTC breaks above $82,200 with strong volume, further upside is possible. However, a rejection could push the price back toward $79,000 or lower.
#BinanceReopensWithdrawalsForMoreAssets #Binance98PercentReplenished
76
·
--
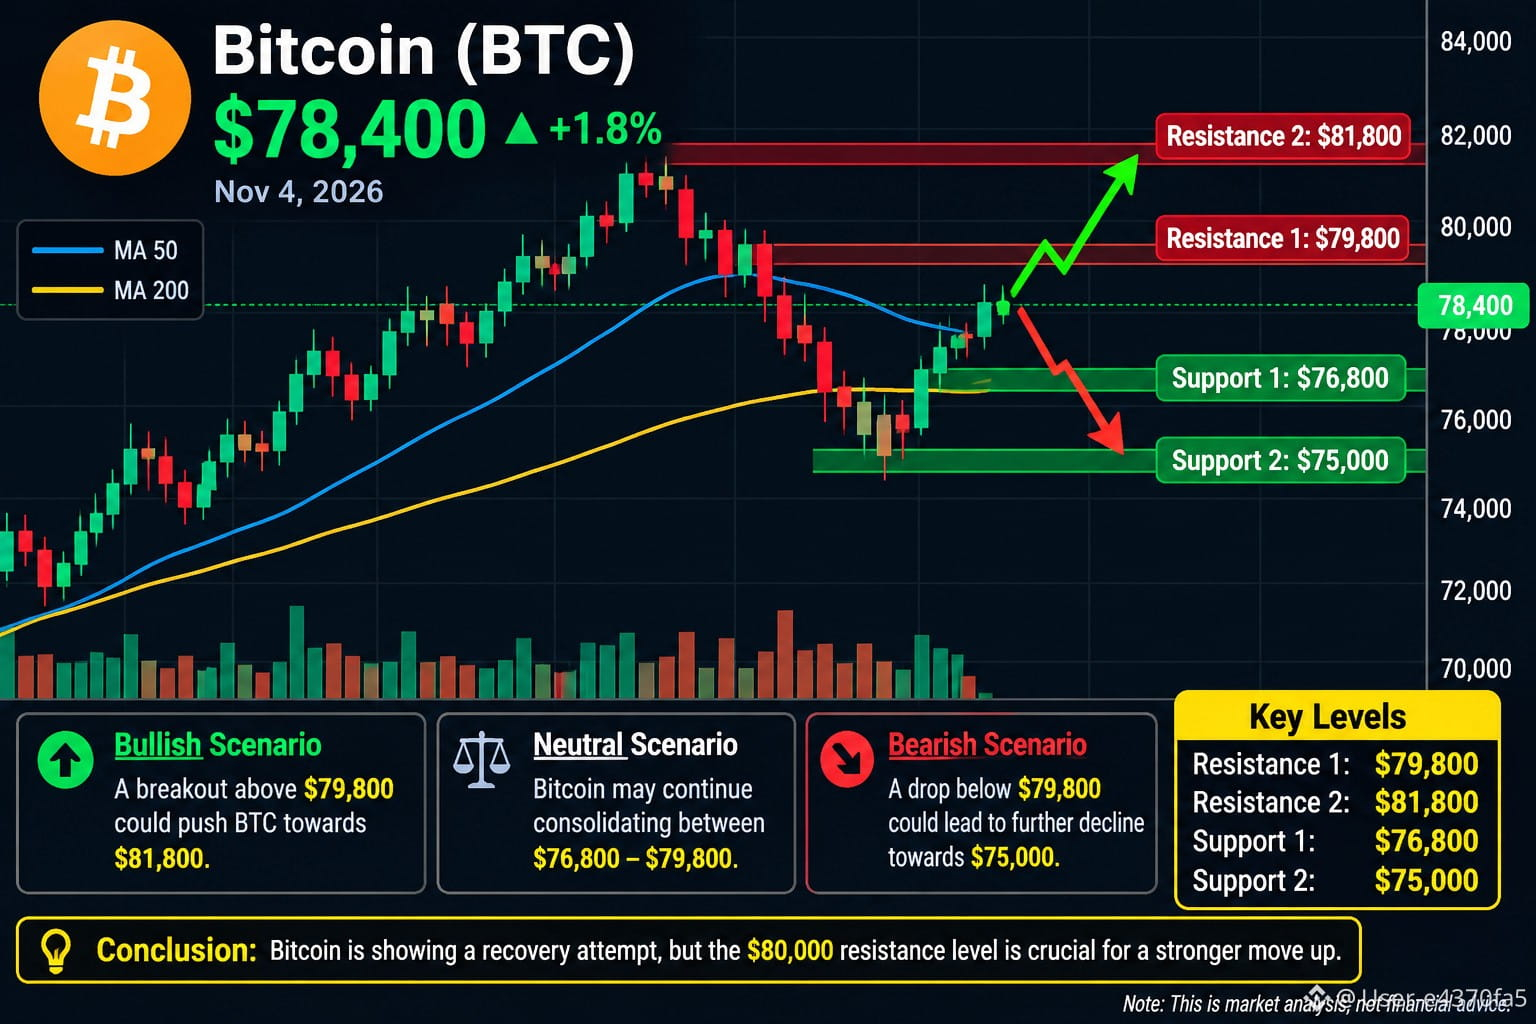
Bitcoin is showing signs of a short-term recovery after recent selling pressure. is trading around
$BTC 78,400, but the overall market remains cautious. Investors are watching the $76,000 support zone and whether Bitcoin can break above $80,000.
Key Technical Levels
Indicator Price
Resistance 1 $79,800
Resistance 2 $81,800
Support 1 $76,800
Support 2 $75,000
Market Outlook
Bullish: A strong breakout above $79,800 could push BTC towards $81,800.
Bearish: A breakdown below $76,800 could lead to further downside towars $75,000.
Neutral: Bitcoin may continue consolidating between $76,800 and $79,800.
{spot}(BTCUSDT)
Bitcoin is showing signs of a short-term recovery after recent selling pressure. is trading around
$BTC 78,400, but the overall market remains cautious. Investors are watching the $76,000 support zone and whether Bitcoin can break above $80,000.
Key Technical Levels
Indicator Price
Resistance 1 $79,800
Resistance 2 $81,800
Support 1 $76,800
Support 2 $75,000
Market Outlook
Bullish: A strong breakout above $79,800 could push BTC towards $81,800.
Bearish: A breakdown below $76,800 could lead to further downside towars $75,000.
Neutral: Bitcoin may continue consolidating between $76,800 and $79,800.
$BTC 78,400, but the overall market remains cautious. Investors are watching the $76,000 support zone and whether Bitcoin can break above $80,000.
Key Technical Levels
Indicator Price
Resistance 1 $79,800
Resistance 2 $81,800
Support 1 $76,800
Support 2 $75,000
Market Outlook
Bullish: A strong breakout above $79,800 could push BTC towards $81,800.
Bearish: A breakdown below $76,800 could lead to further downside towars $75,000.
Neutral: Bitcoin may continue consolidating between $76,800 and $79,800.
50
·
--
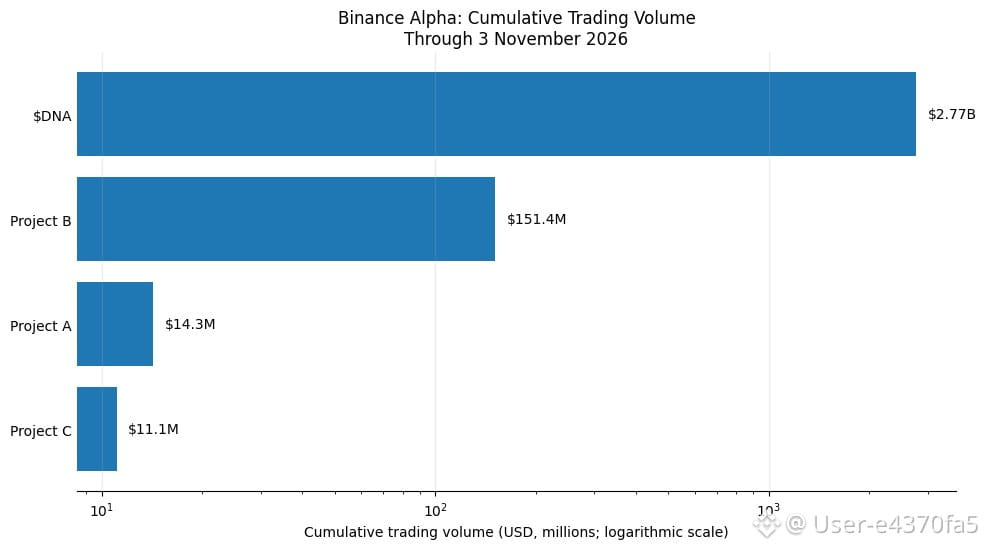
$DNA is showing impressive trading activity on Binance Alpha, recording $2.77 billion in cumulative volume and 85.4 million trades within just 19 days. It has also recorded 14 days with trading volume above $100 million, showing strong market participation.
Compared with similar projects, $DNA is demonstrating significantly higher trading activity, suggesting growing market interest and liquidity.
Market Outlook: Strong trading volume is a positive signal, but investors should monitor price action, liquidity sustainability, and market sentiment before making trading decisions.#DNA_Token #BinanceReopensWithdrawalsForMoreAssets #HongKongToLicenseVirtualAssetCustodyAndAdvisory #BinanceHourlyDepositsExceedWithdrawals #BinanceReopensWithdrawalsForMoreAssets
{alpha}(560xa991f61940095aea0724ef54077223b048c5cf7b)
$DNA is showing impressive trading activity on Binance Alpha, recording $2.77 billion in cumulative volume and 85.4 million trades within just 19 days. It has also recorded 14 days with trading volume above $100 million, showing strong market participation.
Compared with similar projects, $DNA is demonstrating significantly higher trading activity, suggesting growing market interest and liquidity.
Market Outlook: Strong trading volume is a positive signal, but investors should monitor price action, liquidity sustainability, and market sentiment before making trading decisions.#DNA_Token #BinanceReopensWithdrawalsForMoreAssets #HongKongToLicenseVirtualAssetCustodyAndAdvisory #BinanceHourlyDepositsExceedWithdrawals #BinanceReopensWithdrawalsForMoreAssets
Compared with similar projects, $DNA is demonstrating significantly higher trading activity, suggesting growing market interest and liquidity.
Market Outlook: Strong trading volume is a positive signal, but investors should monitor price action, liquidity sustainability, and market sentiment before making trading decisions.#DNA_Token #BinanceReopensWithdrawalsForMoreAssets #HongKongToLicenseVirtualAssetCustodyAndAdvisory #BinanceHourlyDepositsExceedWithdrawals #BinanceReopensWithdrawalsForMoreAssets
103
Log in to explore more content
Join global crypto users on Binance Square
⚡️ Get latest and useful information about crypto.
💬 Trusted by the world’s largest crypto exchange.
👍 Discover real insights from verified creators.
Email / Phone number
Trending Topics
HotCPIDecemberHikePriced
87,228 views
1,038 Discussing
CPI Market Watch | US CPI Rises 0.4% in October, Hotter Than 0.3% Forecast
Binance News
·26 Likes
·41.3k views
TrumpMediaAdds1510BTCInQ3
934 views
46 Discussing
AnthropicRejectsIPODelayValuationinQuestion
213,795 views
1,794 Discussing