

MuhammadRanaRizwan
260 Posts

MuhammadRanaRizwan
Report
Block User
I am a cryptocurrency entrepreneur. I specialize in blockchain technology, digital assets, and crypto trading. Let's explore the future of finance together.
Occasional Trader
5.5 Years
1 Following
51 Followers
54 Liked
Posts

Article
Bitcoin’s $83K Test: Rebound Toward $87.4K or Breakdown Toward $81K?$BTC
{future}(BTCUSDT)
Bitcoin is approaching a crucial support area after another rejection near the upper boundary of its recent trading range. Buyers still have an opportunity to defend the structure, but short-term momentum is weakening.
Will support attract fresh demand—or become the starting point for another leg lower?
BTC analysis | October 7, 2026
Based on the Binance BTCUSDT perpetual chart captured at 2:50 PM Pakistan time. Reference price: approximately $83,780. These are snapshot-based scenarios, not a live entry alert.
What is the chart telling us?
BTC is trading inside a broader consolidation between approximately $82,822 and $86,606, following September’s strong advance.
The latest attempt to push through the upper boundary failed to produce a sustained breakout. Price has since moved back toward the bottom of the range, with the current daily candle down approximately 2.02% at the screenshot time.
The earlier ascending channel is also under pressure. Price appears to be slipping below its projected lower boundary, suggesting that the pace of the previous advance is weakening.
However, the horizontal support at $82,822 has not yet broken decisively. Until that happens, a bearish continuation remains a scenario requiring confirmation.
Momentum: weak intraday, more balanced on the daily chart
The chart shows daily RSI near 54.98, while the supplied monitoring dashboard records:
4-hour RSI: approximately 36.25.1-hour RSI: approximately 28.62.
This combination suggests short-term selling pressure within a daily structure that has not yet turned fully bearish.
An oversold hourly RSI can produce a relief bounce, but it does not confirm a bottom. During a sustained decline, RSI can remain oversold while price continues falling.
The daily candle is still open, so its closing price and final volume will matter more than the unfinished readings.
The levels that matter
BTC levelWhy it matters$86,606–$87,200Major resistance and breakout confirmation zone$87,399Upper liquidation reference in the supplied dashboard$84,800Near-term recovery checkpoint and dashboard liquidity reference$83,025–$82,971Nearby downside liquidation references$82,822Key horizontal range support$80,963Next major chart support after a confirmed breakdown$79,719Further downside support if selling accelerates
Liquidation estimates can change quickly. They identify areas to monitor; they do not guarantee that price will reach them.
Broader conditions call for patience
Today’s reporting describes pressure from a stronger dollar and rising Treasury yields, with traders also watching the Federal Reserve’s meeting minutes. These factors could increase volatility around technical levels.
The supplied dashboard also records positive BTC ETF flows. That is supportive context, but its flow reporting period is not clearly established, and positive flows alone do not confirm an intraday reversal.
Conditional trade signal 1: Breakdown and retest short
This setup becomes relevant only if BTC loses its range support.
Trigger: A 1-hour candle closes below $82,822, followed by a failed attempt to reclaim that level.Potential entry zone: $82,750–$82,850, after rejection confirms.Stop-loss: $83,350.Take-profit 1: $81,800.Take-profit 2: $80,963.Take-profit 3: $79,719.
Using an illustrative entry of $82,800, the stop distance is $550 per BTC. Target two offers approximately 3.3:1 reward-to-risk before fees and slippage.
If BTC breaks support but immediately reclaims it and holds, the short setup loses validity. Avoid chasing a breakdown that has already moved far beyond the entry area.
Conditional trade signal 2: Recovery and retest long
A recovery trade requires buyers to regain control above the first meaningful checkpoint.
Trigger: A 1-hour close above $84,800, followed by a successful retest as support.Potential entry zone: $84,800–$84,950.Stop-loss: $84,200.Take-profit 1: $85,800.Take-profit 2: $86,606.Take-profit 3: $87,200.
👆
At an illustrative $84,850 entry, target two offers approximately 2.7:1 reward-to-risk before costs.
An extension toward $87,399 becomes relevant only if buyers can establish acceptance above $87,200.
My outlook
The immediate bias is cautious and bearish while BTC remains below $84,800. A test of the $83,025–$82,822 area is a reasonable scenario, but the reaction there matters more than the first touch.
A sweep below support followed by a quick reclaim could trap late sellers. A sustained breakdown with a failed retest would strengthen the case for $80,963.
These setups are conditional alternatives—not simultaneous orders. Keep risk small, size positions around the stop distance, and reassess if price has already reached the targets before entry.
Educational market analysis, not personalized financial advice. Trading involves risk; no setup guarantees a profit.
#Bitcoin #BTC #BTCanalysis #cryptotrading #muhammadranarizwan
Bitcoin’s $83K Test: Rebound Toward $87.4K or Breakdown Toward $81K?
$BTC
Bitcoin is approaching a crucial support area after another rejection near the upper boundary of its recent trading range. Buyers still have an opportunity to defend the structure, but short-term momentum is weakening.
Will support attract fresh demand—or become the starting point for another leg lower?
BTC analysis | October 7, 2026
Based on the Binance BTCUSDT perpetual chart captured at 2:50 PM Pakistan time. Reference price: approximately $83,780. These are snapshot-based scenarios, not a live entry alert.
What is the chart telling us?
BTC is trading inside a broader consolidation between approximately $82,822 and $86,606, following September’s strong advance.
The latest attempt to push through the upper boundary failed to produce a sustained breakout. Price has since moved back toward the bottom of the range, with the current daily candle down approximately 2.02% at the screenshot time.
The earlier ascending channel is also under pressure. Price appears to be slipping below its projected lower boundary, suggesting that the pace of the previous advance is weakening.
However, the horizontal support at $82,822 has not yet broken decisively. Until that happens, a bearish continuation remains a scenario requiring confirmation.
Momentum: weak intraday, more balanced on the daily chart
The chart shows daily RSI near 54.98, while the supplied monitoring dashboard records:
4-hour RSI: approximately 36.25.1-hour RSI: approximately 28.62.
This combination suggests short-term selling pressure within a daily structure that has not yet turned fully bearish.
An oversold hourly RSI can produce a relief bounce, but it does not confirm a bottom. During a sustained decline, RSI can remain oversold while price continues falling.
The daily candle is still open, so its closing price and final volume will matter more than the unfinished readings.
The levels that matter
BTC levelWhy it matters$86,606–$87,200Major resistance and breakout confirmation zone$87,399Upper liquidation reference in the supplied dashboard$84,800Near-term recovery checkpoint and dashboard liquidity reference$83,025–$82,971Nearby downside liquidation references$82,822Key horizontal range support$80,963Next major chart support after a confirmed breakdown$79,719Further downside support if selling accelerates
Liquidation estimates can change quickly. They identify areas to monitor; they do not guarantee that price will reach them.
Broader conditions call for patience
Today’s reporting describes pressure from a stronger dollar and rising Treasury yields, with traders also watching the Federal Reserve’s meeting minutes. These factors could increase volatility around technical levels.
The supplied dashboard also records positive BTC ETF flows. That is supportive context, but its flow reporting period is not clearly established, and positive flows alone do not confirm an intraday reversal.
Conditional trade signal 1: Breakdown and retest short
This setup becomes relevant only if BTC loses its range support.
Trigger: A 1-hour candle closes below $82,822, followed by a failed attempt to reclaim that level.Potential entry zone: $82,750–$82,850, after rejection confirms.Stop-loss: $83,350.Take-profit 1: $81,800.Take-profit 2: $80,963.Take-profit 3: $79,719.
Using an illustrative entry of $82,800, the stop distance is $550 per BTC. Target two offers approximately 3.3:1 reward-to-risk before fees and slippage.
If BTC breaks support but immediately reclaims it and holds, the short setup loses validity. Avoid chasing a breakdown that has already moved far beyond the entry area.
Conditional trade signal 2: Recovery and retest long
A recovery trade requires buyers to regain control above the first meaningful checkpoint.
Trigger: A 1-hour close above $84,800, followed by a successful retest as support.Potential entry zone: $84,800–$84,950.Stop-loss: $84,200.Take-profit 1: $85,800.Take-profit 2: $86,606.Take-profit 3: $87,200.
👆
At an illustrative $84,850 entry, target two offers approximately 2.7:1 reward-to-risk before costs.
An extension toward $87,399 becomes relevant only if buyers can establish acceptance above $87,200.
My outlook
The immediate bias is cautious and bearish while BTC remains below $84,800. A test of the $83,025–$82,822 area is a reasonable scenario, but the reaction there matters more than the first touch.
A sweep below support followed by a quick reclaim could trap late sellers. A sustained breakdown with a failed retest would strengthen the case for $80,963.
These setups are conditional alternatives—not simultaneous orders. Keep risk small, size positions around the stop distance, and reassess if price has already reached the targets before entry.
Educational market analysis, not personalized financial advice. Trading involves risk; no setup guarantees a profit.
#Bitcoin #BTC #BTCanalysis #cryptotrading #muhammadranarizwan
Bitcoin is approaching a crucial support area after another rejection near the upper boundary of its recent trading range. Buyers still have an opportunity to defend the structure, but short-term momentum is weakening.
Will support attract fresh demand—or become the starting point for another leg lower?
BTC analysis | October 7, 2026
Based on the Binance BTCUSDT perpetual chart captured at 2:50 PM Pakistan time. Reference price: approximately $83,780. These are snapshot-based scenarios, not a live entry alert.
What is the chart telling us?
BTC is trading inside a broader consolidation between approximately $82,822 and $86,606, following September’s strong advance.
The latest attempt to push through the upper boundary failed to produce a sustained breakout. Price has since moved back toward the bottom of the range, with the current daily candle down approximately 2.02% at the screenshot time.
The earlier ascending channel is also under pressure. Price appears to be slipping below its projected lower boundary, suggesting that the pace of the previous advance is weakening.
However, the horizontal support at $82,822 has not yet broken decisively. Until that happens, a bearish continuation remains a scenario requiring confirmation.
Momentum: weak intraday, more balanced on the daily chart
The chart shows daily RSI near 54.98, while the supplied monitoring dashboard records:
4-hour RSI: approximately 36.25.1-hour RSI: approximately 28.62.
This combination suggests short-term selling pressure within a daily structure that has not yet turned fully bearish.
An oversold hourly RSI can produce a relief bounce, but it does not confirm a bottom. During a sustained decline, RSI can remain oversold while price continues falling.
The daily candle is still open, so its closing price and final volume will matter more than the unfinished readings.
The levels that matter
BTC levelWhy it matters$86,606–$87,200Major resistance and breakout confirmation zone$87,399Upper liquidation reference in the supplied dashboard$84,800Near-term recovery checkpoint and dashboard liquidity reference$83,025–$82,971Nearby downside liquidation references$82,822Key horizontal range support$80,963Next major chart support after a confirmed breakdown$79,719Further downside support if selling accelerates
Liquidation estimates can change quickly. They identify areas to monitor; they do not guarantee that price will reach them.
Broader conditions call for patience
Today’s reporting describes pressure from a stronger dollar and rising Treasury yields, with traders also watching the Federal Reserve’s meeting minutes. These factors could increase volatility around technical levels.
The supplied dashboard also records positive BTC ETF flows. That is supportive context, but its flow reporting period is not clearly established, and positive flows alone do not confirm an intraday reversal.
Conditional trade signal 1: Breakdown and retest short
This setup becomes relevant only if BTC loses its range support.
Trigger: A 1-hour candle closes below $82,822, followed by a failed attempt to reclaim that level.Potential entry zone: $82,750–$82,850, after rejection confirms.Stop-loss: $83,350.Take-profit 1: $81,800.Take-profit 2: $80,963.Take-profit 3: $79,719.
Using an illustrative entry of $82,800, the stop distance is $550 per BTC. Target two offers approximately 3.3:1 reward-to-risk before fees and slippage.
If BTC breaks support but immediately reclaims it and holds, the short setup loses validity. Avoid chasing a breakdown that has already moved far beyond the entry area.
Conditional trade signal 2: Recovery and retest long
A recovery trade requires buyers to regain control above the first meaningful checkpoint.
Trigger: A 1-hour close above $84,800, followed by a successful retest as support.Potential entry zone: $84,800–$84,950.Stop-loss: $84,200.Take-profit 1: $85,800.Take-profit 2: $86,606.Take-profit 3: $87,200.
👆
At an illustrative $84,850 entry, target two offers approximately 2.7:1 reward-to-risk before costs.
An extension toward $87,399 becomes relevant only if buyers can establish acceptance above $87,200.
My outlook
The immediate bias is cautious and bearish while BTC remains below $84,800. A test of the $83,025–$82,822 area is a reasonable scenario, but the reaction there matters more than the first touch.
A sweep below support followed by a quick reclaim could trap late sellers. A sustained breakdown with a failed retest would strengthen the case for $80,963.
These setups are conditional alternatives—not simultaneous orders. Keep risk small, size positions around the stop distance, and reassess if price has already reached the targets before entry.
Educational market analysis, not personalized financial advice. Trading involves risk; no setup guarantees a profit.
#Bitcoin #BTC #BTCanalysis #cryptotrading #muhammadranarizwan
102

Article
Bitcoin at a Turning Point: $87K Breakout or a Pullback Toward $85K?$BTC
{future}(BTCUSDT)
Bitcoin is approaching a key resistance zone, and its reaction here could shape the next move.
At the October 6 chart snapshot, Binance BTC/USDT perpetuals were trading around $86,241, with daily RSI near 66.04. Buyers retain momentum, but price is still below the marked $86,606 resistance.
My outlook: The broader recovery remains constructive, while the immediate trade depends on whether BTC breaks resistance or rejects it.
The supplied daily chart shows a rising channel following the strong recovery from the August lows. More recently, BTC has consolidated between approximately $82,823 and $86,606. Trading near the top of this range creates an important decision point: buyers need to establish support above resistance to sustain the advance.
RSI above 60 supports positive momentum, but it does not guarantee a breakout. The current daily candle is unfinished, so its volume should not be compared directly with completed daily candles to confirm strength or weakness.
📍 The levels that matter
$86,606: Immediate chart resistance and the first breakout checkpoint.$86,917–$87,170: Potential overhead liquidity area identified in the supplied dashboard.$85,245: First downside liquidity reference.$84,303: Secondary downside liquidity reference.$82,823: Major support at the bottom of the current consolidation.$80,963–$79,719: Deeper chart support if the consolidation breaks down.
Liquidity estimates change quickly. These areas are potential reaction zones, not guaranteed destinations.
The accompanying dashboard reports positive funding and rising open interest. Together, these suggest leveraged positioning deserves attention, but they do not independently establish the next direction. Positive funding can accompany a continuing rally or leave crowded longs vulnerable to a sharp pullback.
The same dashboard lists roughly $89.9 million in daily BTC spot ETF net outflows. Treat that as a supplied dashboard reading whose reporting session needs checking, rather than proof that institutions will sell today.
🟢 Conditional Long Signal — Breakout and Retest
A bullish continuation setup becomes more convincing if BTC clears the overhead resistance and liquidity area.
Trigger: A completed 1-hour candle above $87,200, followed by a successful retest.Potential entry: $87,000–$87,200, only after that area holds as support.Stop-loss: $86,450.Target 1: $88,300.Target 2: $89,500.Target 3: $90,400.
The final target is an approximate measured-move projection: adding the current consolidation’s roughly $3,783 height to its $86,606 ceiling. It is a projection, not an existing confirmed resistance level.
At a $87,100 example entry, the risk-to-reward is approximately 1:1.85 to Target 1 and 1:3.69 to Target 2, before fees and slippage.
🔴 Conditional Short Signal — Failed Breakout
A rejection setup becomes relevant if BTC tests $86,917–$87,170, fails to hold the move, and then closes back below $86,600 on the 1-hour timeframe.
Trigger: That rejection, followed by a failed retest of $86,600 from below.Potential entry: $86,550–$86,650 after the failed retest.Stop-loss: $87,350.Target 1: $85,245.Target 2: $84,303.Target 3: $82,823.
At a $86,600 example entry, risk-to-reward is approximately 1:1.81 to Target 1 and 1:3.06 to Target 2, before costs.
This is a countertrend rejection trade. A sustained breakout above $87,200 would invalidate its premise.
For today, I am watching whether BTC can convert $86,606–$87,200 into support. Success would strengthen the continuation case; rejection would bring $85,245 and $84,303 back into focus. The daily chart supplies the context—lower-timeframe confirmation is still required before either entry.
Both signals are conditional plans, not active market orders. If neither trigger appears, there is no trade. Keep risk small, size positions around the stop-loss, and reassess if price has already moved beyond these levels.
Educational analysis only. No setup guarantees a profit.
#bitcoin #BTCanalysis #CryptoTradingInsights #BinanceSquareTalks #muhammadranarizwan
Bitcoin at a Turning Point: $87K Breakout or a Pullback Toward $85K?
$BTC
Bitcoin is approaching a key resistance zone, and its reaction here could shape the next move.
At the October 6 chart snapshot, Binance BTC/USDT perpetuals were trading around $86,241, with daily RSI near 66.04. Buyers retain momentum, but price is still below the marked $86,606 resistance.
My outlook: The broader recovery remains constructive, while the immediate trade depends on whether BTC breaks resistance or rejects it.
The supplied daily chart shows a rising channel following the strong recovery from the August lows. More recently, BTC has consolidated between approximately $82,823 and $86,606. Trading near the top of this range creates an important decision point: buyers need to establish support above resistance to sustain the advance.
RSI above 60 supports positive momentum, but it does not guarantee a breakout. The current daily candle is unfinished, so its volume should not be compared directly with completed daily candles to confirm strength or weakness.
📍 The levels that matter
$86,606: Immediate chart resistance and the first breakout checkpoint.$86,917–$87,170: Potential overhead liquidity area identified in the supplied dashboard.$85,245: First downside liquidity reference.$84,303: Secondary downside liquidity reference.$82,823: Major support at the bottom of the current consolidation.$80,963–$79,719: Deeper chart support if the consolidation breaks down.
Liquidity estimates change quickly. These areas are potential reaction zones, not guaranteed destinations.
The accompanying dashboard reports positive funding and rising open interest. Together, these suggest leveraged positioning deserves attention, but they do not independently establish the next direction. Positive funding can accompany a continuing rally or leave crowded longs vulnerable to a sharp pullback.
The same dashboard lists roughly $89.9 million in daily BTC spot ETF net outflows. Treat that as a supplied dashboard reading whose reporting session needs checking, rather than proof that institutions will sell today.
🟢 Conditional Long Signal — Breakout and Retest
A bullish continuation setup becomes more convincing if BTC clears the overhead resistance and liquidity area.
Trigger: A completed 1-hour candle above $87,200, followed by a successful retest.Potential entry: $87,000–$87,200, only after that area holds as support.Stop-loss: $86,450.Target 1: $88,300.Target 2: $89,500.Target 3: $90,400.
The final target is an approximate measured-move projection: adding the current consolidation’s roughly $3,783 height to its $86,606 ceiling. It is a projection, not an existing confirmed resistance level.
At a $87,100 example entry, the risk-to-reward is approximately 1:1.85 to Target 1 and 1:3.69 to Target 2, before fees and slippage.
🔴 Conditional Short Signal — Failed Breakout
A rejection setup becomes relevant if BTC tests $86,917–$87,170, fails to hold the move, and then closes back below $86,600 on the 1-hour timeframe.
Trigger: That rejection, followed by a failed retest of $86,600 from below.Potential entry: $86,550–$86,650 after the failed retest.Stop-loss: $87,350.Target 1: $85,245.Target 2: $84,303.Target 3: $82,823.
At a $86,600 example entry, risk-to-reward is approximately 1:1.81 to Target 1 and 1:3.06 to Target 2, before costs.
This is a countertrend rejection trade. A sustained breakout above $87,200 would invalidate its premise.
For today, I am watching whether BTC can convert $86,606–$87,200 into support. Success would strengthen the continuation case; rejection would bring $85,245 and $84,303 back into focus. The daily chart supplies the context—lower-timeframe confirmation is still required before either entry.
Both signals are conditional plans, not active market orders. If neither trigger appears, there is no trade. Keep risk small, size positions around the stop-loss, and reassess if price has already moved beyond these levels.
Educational analysis only. No setup guarantees a profit.
#bitcoin #BTCanalysis #CryptoTradingInsights #BinanceSquareTalks #muhammadranarizwan
Bitcoin is approaching a key resistance zone, and its reaction here could shape the next move.
At the October 6 chart snapshot, Binance BTC/USDT perpetuals were trading around $86,241, with daily RSI near 66.04. Buyers retain momentum, but price is still below the marked $86,606 resistance.
My outlook: The broader recovery remains constructive, while the immediate trade depends on whether BTC breaks resistance or rejects it.
The supplied daily chart shows a rising channel following the strong recovery from the August lows. More recently, BTC has consolidated between approximately $82,823 and $86,606. Trading near the top of this range creates an important decision point: buyers need to establish support above resistance to sustain the advance.
RSI above 60 supports positive momentum, but it does not guarantee a breakout. The current daily candle is unfinished, so its volume should not be compared directly with completed daily candles to confirm strength or weakness.
📍 The levels that matter
$86,606: Immediate chart resistance and the first breakout checkpoint.$86,917–$87,170: Potential overhead liquidity area identified in the supplied dashboard.$85,245: First downside liquidity reference.$84,303: Secondary downside liquidity reference.$82,823: Major support at the bottom of the current consolidation.$80,963–$79,719: Deeper chart support if the consolidation breaks down.
Liquidity estimates change quickly. These areas are potential reaction zones, not guaranteed destinations.
The accompanying dashboard reports positive funding and rising open interest. Together, these suggest leveraged positioning deserves attention, but they do not independently establish the next direction. Positive funding can accompany a continuing rally or leave crowded longs vulnerable to a sharp pullback.
The same dashboard lists roughly $89.9 million in daily BTC spot ETF net outflows. Treat that as a supplied dashboard reading whose reporting session needs checking, rather than proof that institutions will sell today.
🟢 Conditional Long Signal — Breakout and Retest
A bullish continuation setup becomes more convincing if BTC clears the overhead resistance and liquidity area.
Trigger: A completed 1-hour candle above $87,200, followed by a successful retest.Potential entry: $87,000–$87,200, only after that area holds as support.Stop-loss: $86,450.Target 1: $88,300.Target 2: $89,500.Target 3: $90,400.
The final target is an approximate measured-move projection: adding the current consolidation’s roughly $3,783 height to its $86,606 ceiling. It is a projection, not an existing confirmed resistance level.
At a $87,100 example entry, the risk-to-reward is approximately 1:1.85 to Target 1 and 1:3.69 to Target 2, before fees and slippage.
🔴 Conditional Short Signal — Failed Breakout
A rejection setup becomes relevant if BTC tests $86,917–$87,170, fails to hold the move, and then closes back below $86,600 on the 1-hour timeframe.
Trigger: That rejection, followed by a failed retest of $86,600 from below.Potential entry: $86,550–$86,650 after the failed retest.Stop-loss: $87,350.Target 1: $85,245.Target 2: $84,303.Target 3: $82,823.
At a $86,600 example entry, risk-to-reward is approximately 1:1.81 to Target 1 and 1:3.06 to Target 2, before costs.
This is a countertrend rejection trade. A sustained breakout above $87,200 would invalidate its premise.
For today, I am watching whether BTC can convert $86,606–$87,200 into support. Success would strengthen the continuation case; rejection would bring $85,245 and $84,303 back into focus. The daily chart supplies the context—lower-timeframe confirmation is still required before either entry.
Both signals are conditional plans, not active market orders. If neither trigger appears, there is no trade. Keep risk small, size positions around the stop-loss, and reassess if price has already moved beyond these levels.
Educational analysis only. No setup guarantees a profit.
#bitcoin #BTCanalysis #CryptoTradingInsights #BinanceSquareTalks #muhammadranarizwan
68

Article
Bitcoin at a Breakout Decision: $87,700 Next—or a Pullback to $85,600?$BTC
{future}(BTCUSDT)
📅 October 2, 2026 | BTC/USDT Technical Analysis
Bitcoin is approaching a critical resistance area after a strong recovery. Buyers still have the advantage within the broader rising structure, but price is now testing the upper boundary of its recent consolidation.
The key question: can BTC turn $86,600 into support and extend toward $87,700, or will sellers force another pullback before the next move?
Here is today’s technical outlook, liquidity analysis, and conditional trade plan.
📊 1. Daily Structure: Bullish Trend, Resistance Ahead
The supplied Binance BTC/USDT perpetual daily chart shows Bitcoin around $86,386, with the session up approximately 1.84% at the screenshot time.
BTC remains inside the ascending channel drawn on the chart. Its recent consolidation sits between approximately $82,822 and $86,606, and price is testing that range’s upper boundary.
This keeps the broader bias bullish, but a breakout still needs confirmation. The session reached approximately $87,250 before returning below $86,606, showing that trading above resistance has not yet produced a sustained breakout.
A strong close above the range ceiling, followed by a successful retest, would strengthen the continuation case. Another rejection would keep the consolidation active.
📈 2. Momentum: Strong, but Chasing Carries Risk
Daily RSI is approximately 68.68 on the chart. Momentum remains strong and is approaching the conventional 70 overbought threshold.
The monitoring report also shows elevated four-hour RSI around 71.78. Together, these readings suggest buyers have momentum, while a short-term cooling phase remains possible.
High RSI does not automatically mean a reversal. However, it makes entry location important: buying directly into resistance can expose traders to a pullback even when the broader trend remains bullish.
🔍 3. Liquidity Levels to Watch
The supplied monitoring report identifies two nearby liquidity reference areas:
• Upside: approximately $87,699.
• Downside: approximately $85,602.
These are potential reaction zones, not guaranteed destinations. Liquidity concentrations can change as traders open and close positions.
A move above the session high near $87,250 could bring $87,700 into focus. However, a brief sweep above resistance followed by a sharp return below it could create a failed-breakout setup.
On the downside, losing $85,600 would weaken the immediate bullish case and bring the session low near $84,473 into view.
💰 4. Market Context: Supportive Signals, Mixed Conditions
The supplied report records approximately $102.67 million in daily net inflows into US spot Bitcoin ETFs, positive open interest, and neutral funding.
That combination provides supportive context, although rising open interest alone does not reveal whether new positions are predominantly bullish or bearish.
The report also shows declining USDT dominance and rising BTC dominance. This is consistent with Bitcoin leading the crypto move, rather than confirming a broad altcoin rally.
A crypto Fear & Greed reading of 72 indicates optimistic sentiment. Meanwhile, the stronger dollar shown in the report remains a factor to watch.
These figures are monitoring snapshots and should be refreshed before trading.
🎯 5. Today’s Key Price Levels
Immediate resistance:
• $86,606 — consolidation ceiling.
• $87,250 — session high on the supplied chart.
• $87,699–$87,704 — reported upside liquidity area.
Immediate support:
• $85,602 — reported downside liquidity reference.
• $84,473 — session low on the supplied chart.
• $82,822 — major consolidation support.
Below $82,822, the next chart supports are approximately $80,962 and $79,719.
🟢 Conditional Long Signal: Pullback and Reclaim
Preferred entry zone: $85,650–$85,800
Stop-loss: $85,250
Take-profit levels:
• TP1: $86,600
• TP2: $87,250
• TP3: $87,700
Trigger: Wait for a test of the $85,600 area, followed by a 15-minute bullish close back above $85,650 and a retest that holds.
The purpose is to confirm that buyers are defending support before entering.
At an illustrative entry of $85,725, the price risk is $475 per BTC. TP1 offers approximately 1.84R, and TP3 approximately 4.16R, before fees and slippage.
Cancel this setup if price breaks support and fails to reclaim it. A limit order in the zone without confirmation is a different, riskier trade.
🔴 Alternative Short Signal: Failed Upside Breakout
Preferred entry zone: $87,500–$87,700
Stop-loss: $88,100
Take-profit levels:
• TP1: $86,600
• TP2: $85,600
• TP3: $84,500
Trigger: Price must first test or sweep the $87,700 area, then close back below $87,500 on the 15-minute chart and fail to reclaim it.
This is a countertrend rejection setup. It becomes relevant only if the upside attempt fails.
At an illustrative entry of $87,600, the price risk is $500 per BTC. TP1 offers approximately 2R before costs.
Cancel the short idea if BTC holds above $87,700 and establishes support there.
⚠️ Execution Matters
These are conditional setups, not immediate market-entry calls. Choose the scenario price confirms, use a stop-loss, and size the position from the stop distance.
For conservative execution, consider limiting account risk to 0.25%–0.5% per trade. Leverage changes margin requirements; position size and stop distance determine planned loss. Actual losses can exceed that plan during slippage.
📌 My BTC Outlook
The broader structure favors buyers while $82,822 holds, but the immediate decision is around $86,606.
Acceptance above that level would strengthen the case for $87,250 and $87,700. Rejection would bring $85,600 back into focus, with $84,473 below it.
My preference is a confirmed support reclaim or a breakout retest. Let price confirm the opportunity before committing capital.
Educational analysis only. Targets and profits are not guaranteed.
#bitcoin #BTC走势分析 #cryptotrading #BTCanalysis #muhammadranarizwan
Bitcoin at a Breakout Decision: $87,700 Next—or a Pullback to $85,600?
$BTC
📅 October 2, 2026 | BTC/USDT Technical Analysis
Bitcoin is approaching a critical resistance area after a strong recovery. Buyers still have the advantage within the broader rising structure, but price is now testing the upper boundary of its recent consolidation.
The key question: can BTC turn $86,600 into support and extend toward $87,700, or will sellers force another pullback before the next move?
Here is today’s technical outlook, liquidity analysis, and conditional trade plan.
📊 1. Daily Structure: Bullish Trend, Resistance Ahead
The supplied Binance BTC/USDT perpetual daily chart shows Bitcoin around $86,386, with the session up approximately 1.84% at the screenshot time.
BTC remains inside the ascending channel drawn on the chart. Its recent consolidation sits between approximately $82,822 and $86,606, and price is testing that range’s upper boundary.
This keeps the broader bias bullish, but a breakout still needs confirmation. The session reached approximately $87,250 before returning below $86,606, showing that trading above resistance has not yet produced a sustained breakout.
A strong close above the range ceiling, followed by a successful retest, would strengthen the continuation case. Another rejection would keep the consolidation active.
📈 2. Momentum: Strong, but Chasing Carries Risk
Daily RSI is approximately 68.68 on the chart. Momentum remains strong and is approaching the conventional 70 overbought threshold.
The monitoring report also shows elevated four-hour RSI around 71.78. Together, these readings suggest buyers have momentum, while a short-term cooling phase remains possible.
High RSI does not automatically mean a reversal. However, it makes entry location important: buying directly into resistance can expose traders to a pullback even when the broader trend remains bullish.
🔍 3. Liquidity Levels to Watch
The supplied monitoring report identifies two nearby liquidity reference areas:
• Upside: approximately $87,699.
• Downside: approximately $85,602.
These are potential reaction zones, not guaranteed destinations. Liquidity concentrations can change as traders open and close positions.
A move above the session high near $87,250 could bring $87,700 into focus. However, a brief sweep above resistance followed by a sharp return below it could create a failed-breakout setup.
On the downside, losing $85,600 would weaken the immediate bullish case and bring the session low near $84,473 into view.
💰 4. Market Context: Supportive Signals, Mixed Conditions
The supplied report records approximately $102.67 million in daily net inflows into US spot Bitcoin ETFs, positive open interest, and neutral funding.
That combination provides supportive context, although rising open interest alone does not reveal whether new positions are predominantly bullish or bearish.
The report also shows declining USDT dominance and rising BTC dominance. This is consistent with Bitcoin leading the crypto move, rather than confirming a broad altcoin rally.
A crypto Fear & Greed reading of 72 indicates optimistic sentiment. Meanwhile, the stronger dollar shown in the report remains a factor to watch.
These figures are monitoring snapshots and should be refreshed before trading.
🎯 5. Today’s Key Price Levels
Immediate resistance:
• $86,606 — consolidation ceiling.
• $87,250 — session high on the supplied chart.
• $87,699–$87,704 — reported upside liquidity area.
Immediate support:
• $85,602 — reported downside liquidity reference.
• $84,473 — session low on the supplied chart.
• $82,822 — major consolidation support.
Below $82,822, the next chart supports are approximately $80,962 and $79,719.
🟢 Conditional Long Signal: Pullback and Reclaim
Preferred entry zone: $85,650–$85,800
Stop-loss: $85,250
Take-profit levels:
• TP1: $86,600
• TP2: $87,250
• TP3: $87,700
Trigger: Wait for a test of the $85,600 area, followed by a 15-minute bullish close back above $85,650 and a retest that holds.
The purpose is to confirm that buyers are defending support before entering.
At an illustrative entry of $85,725, the price risk is $475 per BTC. TP1 offers approximately 1.84R, and TP3 approximately 4.16R, before fees and slippage.
Cancel this setup if price breaks support and fails to reclaim it. A limit order in the zone without confirmation is a different, riskier trade.
🔴 Alternative Short Signal: Failed Upside Breakout
Preferred entry zone: $87,500–$87,700
Stop-loss: $88,100
Take-profit levels:
• TP1: $86,600
• TP2: $85,600
• TP3: $84,500
Trigger: Price must first test or sweep the $87,700 area, then close back below $87,500 on the 15-minute chart and fail to reclaim it.
This is a countertrend rejection setup. It becomes relevant only if the upside attempt fails.
At an illustrative entry of $87,600, the price risk is $500 per BTC. TP1 offers approximately 2R before costs.
Cancel the short idea if BTC holds above $87,700 and establishes support there.
⚠️ Execution Matters
These are conditional setups, not immediate market-entry calls. Choose the scenario price confirms, use a stop-loss, and size the position from the stop distance.
For conservative execution, consider limiting account risk to 0.25%–0.5% per trade. Leverage changes margin requirements; position size and stop distance determine planned loss. Actual losses can exceed that plan during slippage.
📌 My BTC Outlook
The broader structure favors buyers while $82,822 holds, but the immediate decision is around $86,606.
Acceptance above that level would strengthen the case for $87,250 and $87,700. Rejection would bring $85,600 back into focus, with $84,473 below it.
My preference is a confirmed support reclaim or a breakout retest. Let price confirm the opportunity before committing capital.
Educational analysis only. Targets and profits are not guaranteed.
#bitcoin #BTC走势分析 #cryptotrading #BTCanalysis #muhammadranarizwan
📅 October 2, 2026 | BTC/USDT Technical Analysis
Bitcoin is approaching a critical resistance area after a strong recovery. Buyers still have the advantage within the broader rising structure, but price is now testing the upper boundary of its recent consolidation.
The key question: can BTC turn $86,600 into support and extend toward $87,700, or will sellers force another pullback before the next move?
Here is today’s technical outlook, liquidity analysis, and conditional trade plan.
📊 1. Daily Structure: Bullish Trend, Resistance Ahead
The supplied Binance BTC/USDT perpetual daily chart shows Bitcoin around $86,386, with the session up approximately 1.84% at the screenshot time.
BTC remains inside the ascending channel drawn on the chart. Its recent consolidation sits between approximately $82,822 and $86,606, and price is testing that range’s upper boundary.
This keeps the broader bias bullish, but a breakout still needs confirmation. The session reached approximately $87,250 before returning below $86,606, showing that trading above resistance has not yet produced a sustained breakout.
A strong close above the range ceiling, followed by a successful retest, would strengthen the continuation case. Another rejection would keep the consolidation active.
📈 2. Momentum: Strong, but Chasing Carries Risk
Daily RSI is approximately 68.68 on the chart. Momentum remains strong and is approaching the conventional 70 overbought threshold.
The monitoring report also shows elevated four-hour RSI around 71.78. Together, these readings suggest buyers have momentum, while a short-term cooling phase remains possible.
High RSI does not automatically mean a reversal. However, it makes entry location important: buying directly into resistance can expose traders to a pullback even when the broader trend remains bullish.
🔍 3. Liquidity Levels to Watch
The supplied monitoring report identifies two nearby liquidity reference areas:
• Upside: approximately $87,699.
• Downside: approximately $85,602.
These are potential reaction zones, not guaranteed destinations. Liquidity concentrations can change as traders open and close positions.
A move above the session high near $87,250 could bring $87,700 into focus. However, a brief sweep above resistance followed by a sharp return below it could create a failed-breakout setup.
On the downside, losing $85,600 would weaken the immediate bullish case and bring the session low near $84,473 into view.
💰 4. Market Context: Supportive Signals, Mixed Conditions
The supplied report records approximately $102.67 million in daily net inflows into US spot Bitcoin ETFs, positive open interest, and neutral funding.
That combination provides supportive context, although rising open interest alone does not reveal whether new positions are predominantly bullish or bearish.
The report also shows declining USDT dominance and rising BTC dominance. This is consistent with Bitcoin leading the crypto move, rather than confirming a broad altcoin rally.
A crypto Fear & Greed reading of 72 indicates optimistic sentiment. Meanwhile, the stronger dollar shown in the report remains a factor to watch.
These figures are monitoring snapshots and should be refreshed before trading.
🎯 5. Today’s Key Price Levels
Immediate resistance:
• $86,606 — consolidation ceiling.
• $87,250 — session high on the supplied chart.
• $87,699–$87,704 — reported upside liquidity area.
Immediate support:
• $85,602 — reported downside liquidity reference.
• $84,473 — session low on the supplied chart.
• $82,822 — major consolidation support.
Below $82,822, the next chart supports are approximately $80,962 and $79,719.
🟢 Conditional Long Signal: Pullback and Reclaim
Preferred entry zone: $85,650–$85,800
Stop-loss: $85,250
Take-profit levels:
• TP1: $86,600
• TP2: $87,250
• TP3: $87,700
Trigger: Wait for a test of the $85,600 area, followed by a 15-minute bullish close back above $85,650 and a retest that holds.
The purpose is to confirm that buyers are defending support before entering.
At an illustrative entry of $85,725, the price risk is $475 per BTC. TP1 offers approximately 1.84R, and TP3 approximately 4.16R, before fees and slippage.
Cancel this setup if price breaks support and fails to reclaim it. A limit order in the zone without confirmation is a different, riskier trade.
🔴 Alternative Short Signal: Failed Upside Breakout
Preferred entry zone: $87,500–$87,700
Stop-loss: $88,100
Take-profit levels:
• TP1: $86,600
• TP2: $85,600
• TP3: $84,500
Trigger: Price must first test or sweep the $87,700 area, then close back below $87,500 on the 15-minute chart and fail to reclaim it.
This is a countertrend rejection setup. It becomes relevant only if the upside attempt fails.
At an illustrative entry of $87,600, the price risk is $500 per BTC. TP1 offers approximately 2R before costs.
Cancel the short idea if BTC holds above $87,700 and establishes support there.
⚠️ Execution Matters
These are conditional setups, not immediate market-entry calls. Choose the scenario price confirms, use a stop-loss, and size the position from the stop distance.
For conservative execution, consider limiting account risk to 0.25%–0.5% per trade. Leverage changes margin requirements; position size and stop distance determine planned loss. Actual losses can exceed that plan during slippage.
📌 My BTC Outlook
The broader structure favors buyers while $82,822 holds, but the immediate decision is around $86,606.
Acceptance above that level would strengthen the case for $87,250 and $87,700. Rejection would bring $85,600 back into focus, with $84,473 below it.
My preference is a confirmed support reclaim or a breakout retest. Let price confirm the opportunity before committing capital.
Educational analysis only. Targets and profits are not guaranteed.
#bitcoin #BTC走势分析 #cryptotrading #BTCanalysis #muhammadranarizwan
61

Article
Bitcoin’s October Opening Battle: $84,676 Next—or a Sweep Below $83,000?$BTC
{future}(BTCUSDT)
Bitcoin Next Move Analysis | October 1, 2026
Bitcoin is consolidating after its strong September rally, with buyers defending support inside an ascending daily channel. The structure still favors bullish continuation, but nearby liquidation levels and mixed market conditions make confirmation essential.
This analysis uses my October 1 chart snapshot, captured around 10:06 AM Pakistan time, and my Daily Watching dashboard. BTCUSDT perpetual was trading near $84,200 at the chart capture. These are snapshot-based levels; check the current price before acting.
📊 DAILY STRUCTURE: BULLISH, BUT STILL INSIDE A RANGE
The daily chart shows Bitcoin holding within an ascending channel after breaking above its previous consolidation area. Price is now trading inside a smaller range between approximately $82,822 and $86,606.
This is the key decision zone:
• Holding $82,822 keeps the current consolidation structure intact.
• Breaking above $86,606 would strengthen the continuation case toward $88,308.
• Losing $82,822 would expose the previous breakout area near $80,962.
Daily RSI is around 63, while the dashboard shows the 4-hour and 1-hour RSI readings around 54 and 57. Momentum remains positive, although these readings alone do not confirm an imminent breakout.
The latest daily candle is still forming. Its green color should not be treated as a confirmed daily close.
🎯 KEY LEVELS TO WATCH
Immediate upside liquidity: $84,598–$84,676
Major range resistance: $86,606
Higher resistance: $88,308
Immediate downside liquidity: $82,974–$82,998
Critical range support: $82,822
Next major support: $80,962
Lower supports: $79,719 and $78,727
The $84,600–$84,700 area is an immediate liquidity target, while $86,606 is the more important structural resistance. Reaching the first zone would not automatically confirm a larger breakout.
💧 LIQUIDITY: BOTH SIDES CAN BE SWEPT
My dashboard places potential short-liquidation liquidity near $84,676 and long-liquidation liquidity near $82,998, with nearby heatmap levels around $84,598 and $82,974.
This creates two possible paths:
BTC pushes above $84,600, triggering short liquidations, then either continues higher or rejects back into the range.BTC first sweeps below $83,000, then recovers support—or breaks lower if buyers fail to respond.
Liquidation clusters can help identify areas where volatility may increase. They do not guarantee which level price will hit first.
A move above resistance followed by a quick rejection could trap breakout buyers. Equally, a move below support followed by a strong reclaim could trap late sellers.
🌍 MARKET CONTEXT: SUPPORTIVE MOMENTUM, WITH HEADWINDS
My daily dashboard reports:
• Crypto Fear & Greed: 74
• Crypto average RSI: approximately 52.68
• BTC dominance: approximately 59.15%
• USDT dominance: approximately 6.44%, trending lower
• BTC funding: positive
• Reported US spot BTC ETF net flow: approximately -$148.69 million
These dashboard readings were not independently verified for this article, and their reporting periods may differ.
Falling USDT dominance can accompany greater risk appetite, while positive funding suggests longs are paying shorts. However, positive funding can also make crowded long positions vulnerable to liquidation.
The reported ETF outflow, stronger dollar and rising Treasury yields add caution to the bullish chart structure.
My dashboard also shows crypto market capitalization falling from $2.91 trillion to $2.87 trillion. That is a $40 billion change in market valuation; it should not be described as proof that $40 billion of cash left the market.
🔮 MY NEXT-MOVE OUTLOOK
My directional preference is cautiously bullish while BTC holds the $82,822 support area.
The first upside zone to watch is $84,598–$84,676. If buyers establish support above this area, the next meaningful objective becomes $86,606.
However, a sweep toward $83,000 could happen before an upside attempt. If BTC loses $82,822 and fails to reclaim it, the bullish intraday thesis weakens and $80,962 becomes the next major downside reference.
The daily chart supports the broader structure, but entries need lower-timeframe confirmation. I would not assign a precise probability to either path without a tested statistical model.
📈 CONDITIONAL LONG SIGNAL — SUPPORT SWEEP AND RECLAIM
Activation:
Wait for BTC to test the $82,850–$83,100 area, then produce a 1-hour close back above $83,100. Look for a retest that holds before entering.
Planned entry zone: $83,100–$83,250
Stop-loss: $82,650
Take-profit 1: $84,200
Take-profit 2: $84,600–$84,676
Take-profit 3: $86,500
Using an example entry of $83,175, the approximate reward-to-risk ratios are:
• TP1: 1.95R
• TP2 at $84,650: 2.81R
• TP3: 6.33R
These calculations exclude fees, funding and slippage.
This setup is inactive until the reclaim occurs. A sustained move below $82,822 without recovery is a reason to skip the long.
📉 CONDITIONAL SHORT SIGNAL — SUPPORT BREAK AND FAILED RETEST
Activation:
Wait for a 1-hour close below $82,822, followed by a retest of $82,750–$82,850 that fails to recover support.
Planned entry zone: $82,750–$82,850
Stop-loss: $83,250
Take-profit 1: $81,800
Take-profit 2: $80,962
Take-profit 3: $79,719
Using an example entry of $82,800, the approximate reward-to-risk ratios are:
• TP1: 2.22R
• TP2: 4.08R
• TP3: 6.85R
These calculations exclude fees, funding and slippage.
Cancel the short idea if BTC reclaims support and holds above it. A temporary wick below the level is insufficient confirmation.
🛡️ TRADE MANAGEMENT
These are alternative scenarios, not instructions to open both positions.
Size the position from the distance to the stop-loss and your predefined account risk. Consider taking partial profit at the first target and reassessing the remaining position as price approaches liquidity or resistance.
If price has already reached a target before the entry trigger appears, reassess the setup instead of chasing it. Higher targets may require multiple sessions.
Bitcoin’s next meaningful move depends on how it behaves around $84,676 and $82,822. Buyers retain the structural advantage above support, but confirmation will determine whether today delivers continuation, another range session, or a deeper pullback.
Educational market analysis only. Trade setups are conditional and profits are not guaranteed.
#bitcoin #BTC #CryptoTradingInsights #BTCanalysis #muhammadranarizwan $LTC
Bitcoin’s October Opening Battle: $84,676 Next—or a Sweep Below $83,000?
$BTC
Bitcoin Next Move Analysis | October 1, 2026
Bitcoin is consolidating after its strong September rally, with buyers defending support inside an ascending daily channel. The structure still favors bullish continuation, but nearby liquidation levels and mixed market conditions make confirmation essential.
This analysis uses my October 1 chart snapshot, captured around 10:06 AM Pakistan time, and my Daily Watching dashboard. BTCUSDT perpetual was trading near $84,200 at the chart capture. These are snapshot-based levels; check the current price before acting.
📊 DAILY STRUCTURE: BULLISH, BUT STILL INSIDE A RANGE
The daily chart shows Bitcoin holding within an ascending channel after breaking above its previous consolidation area. Price is now trading inside a smaller range between approximately $82,822 and $86,606.
This is the key decision zone:
• Holding $82,822 keeps the current consolidation structure intact.
• Breaking above $86,606 would strengthen the continuation case toward $88,308.
• Losing $82,822 would expose the previous breakout area near $80,962.
Daily RSI is around 63, while the dashboard shows the 4-hour and 1-hour RSI readings around 54 and 57. Momentum remains positive, although these readings alone do not confirm an imminent breakout.
The latest daily candle is still forming. Its green color should not be treated as a confirmed daily close.
🎯 KEY LEVELS TO WATCH
Immediate upside liquidity: $84,598–$84,676
Major range resistance: $86,606
Higher resistance: $88,308
Immediate downside liquidity: $82,974–$82,998
Critical range support: $82,822
Next major support: $80,962
Lower supports: $79,719 and $78,727
The $84,600–$84,700 area is an immediate liquidity target, while $86,606 is the more important structural resistance. Reaching the first zone would not automatically confirm a larger breakout.
💧 LIQUIDITY: BOTH SIDES CAN BE SWEPT
My dashboard places potential short-liquidation liquidity near $84,676 and long-liquidation liquidity near $82,998, with nearby heatmap levels around $84,598 and $82,974.
This creates two possible paths:
BTC pushes above $84,600, triggering short liquidations, then either continues higher or rejects back into the range.BTC first sweeps below $83,000, then recovers support—or breaks lower if buyers fail to respond.
Liquidation clusters can help identify areas where volatility may increase. They do not guarantee which level price will hit first.
A move above resistance followed by a quick rejection could trap breakout buyers. Equally, a move below support followed by a strong reclaim could trap late sellers.
🌍 MARKET CONTEXT: SUPPORTIVE MOMENTUM, WITH HEADWINDS
My daily dashboard reports:
• Crypto Fear & Greed: 74
• Crypto average RSI: approximately 52.68
• BTC dominance: approximately 59.15%
• USDT dominance: approximately 6.44%, trending lower
• BTC funding: positive
• Reported US spot BTC ETF net flow: approximately -$148.69 million
These dashboard readings were not independently verified for this article, and their reporting periods may differ.
Falling USDT dominance can accompany greater risk appetite, while positive funding suggests longs are paying shorts. However, positive funding can also make crowded long positions vulnerable to liquidation.
The reported ETF outflow, stronger dollar and rising Treasury yields add caution to the bullish chart structure.
My dashboard also shows crypto market capitalization falling from $2.91 trillion to $2.87 trillion. That is a $40 billion change in market valuation; it should not be described as proof that $40 billion of cash left the market.
🔮 MY NEXT-MOVE OUTLOOK
My directional preference is cautiously bullish while BTC holds the $82,822 support area.
The first upside zone to watch is $84,598–$84,676. If buyers establish support above this area, the next meaningful objective becomes $86,606.
However, a sweep toward $83,000 could happen before an upside attempt. If BTC loses $82,822 and fails to reclaim it, the bullish intraday thesis weakens and $80,962 becomes the next major downside reference.
The daily chart supports the broader structure, but entries need lower-timeframe confirmation. I would not assign a precise probability to either path without a tested statistical model.
📈 CONDITIONAL LONG SIGNAL — SUPPORT SWEEP AND RECLAIM
Activation:
Wait for BTC to test the $82,850–$83,100 area, then produce a 1-hour close back above $83,100. Look for a retest that holds before entering.
Planned entry zone: $83,100–$83,250
Stop-loss: $82,650
Take-profit 1: $84,200
Take-profit 2: $84,600–$84,676
Take-profit 3: $86,500
Using an example entry of $83,175, the approximate reward-to-risk ratios are:
• TP1: 1.95R
• TP2 at $84,650: 2.81R
• TP3: 6.33R
These calculations exclude fees, funding and slippage.
This setup is inactive until the reclaim occurs. A sustained move below $82,822 without recovery is a reason to skip the long.
📉 CONDITIONAL SHORT SIGNAL — SUPPORT BREAK AND FAILED RETEST
Activation:
Wait for a 1-hour close below $82,822, followed by a retest of $82,750–$82,850 that fails to recover support.
Planned entry zone: $82,750–$82,850
Stop-loss: $83,250
Take-profit 1: $81,800
Take-profit 2: $80,962
Take-profit 3: $79,719
Using an example entry of $82,800, the approximate reward-to-risk ratios are:
• TP1: 2.22R
• TP2: 4.08R
• TP3: 6.85R
These calculations exclude fees, funding and slippage.
Cancel the short idea if BTC reclaims support and holds above it. A temporary wick below the level is insufficient confirmation.
🛡️ TRADE MANAGEMENT
These are alternative scenarios, not instructions to open both positions.
Size the position from the distance to the stop-loss and your predefined account risk. Consider taking partial profit at the first target and reassessing the remaining position as price approaches liquidity or resistance.
If price has already reached a target before the entry trigger appears, reassess the setup instead of chasing it. Higher targets may require multiple sessions.
Bitcoin’s next meaningful move depends on how it behaves around $84,676 and $82,822. Buyers retain the structural advantage above support, but confirmation will determine whether today delivers continuation, another range session, or a deeper pullback.
Educational market analysis only. Trade setups are conditional and profits are not guaranteed.
#bitcoin #BTC #CryptoTradingInsights #BTCanalysis #muhammadranarizwan $LTC
Bitcoin Next Move Analysis | October 1, 2026
Bitcoin is consolidating after its strong September rally, with buyers defending support inside an ascending daily channel. The structure still favors bullish continuation, but nearby liquidation levels and mixed market conditions make confirmation essential.
This analysis uses my October 1 chart snapshot, captured around 10:06 AM Pakistan time, and my Daily Watching dashboard. BTCUSDT perpetual was trading near $84,200 at the chart capture. These are snapshot-based levels; check the current price before acting.
📊 DAILY STRUCTURE: BULLISH, BUT STILL INSIDE A RANGE
The daily chart shows Bitcoin holding within an ascending channel after breaking above its previous consolidation area. Price is now trading inside a smaller range between approximately $82,822 and $86,606.
This is the key decision zone:
• Holding $82,822 keeps the current consolidation structure intact.
• Breaking above $86,606 would strengthen the continuation case toward $88,308.
• Losing $82,822 would expose the previous breakout area near $80,962.
Daily RSI is around 63, while the dashboard shows the 4-hour and 1-hour RSI readings around 54 and 57. Momentum remains positive, although these readings alone do not confirm an imminent breakout.
The latest daily candle is still forming. Its green color should not be treated as a confirmed daily close.
🎯 KEY LEVELS TO WATCH
Immediate upside liquidity: $84,598–$84,676
Major range resistance: $86,606
Higher resistance: $88,308
Immediate downside liquidity: $82,974–$82,998
Critical range support: $82,822
Next major support: $80,962
Lower supports: $79,719 and $78,727
The $84,600–$84,700 area is an immediate liquidity target, while $86,606 is the more important structural resistance. Reaching the first zone would not automatically confirm a larger breakout.
💧 LIQUIDITY: BOTH SIDES CAN BE SWEPT
My dashboard places potential short-liquidation liquidity near $84,676 and long-liquidation liquidity near $82,998, with nearby heatmap levels around $84,598 and $82,974.
This creates two possible paths:
BTC pushes above $84,600, triggering short liquidations, then either continues higher or rejects back into the range.BTC first sweeps below $83,000, then recovers support—or breaks lower if buyers fail to respond.
Liquidation clusters can help identify areas where volatility may increase. They do not guarantee which level price will hit first.
A move above resistance followed by a quick rejection could trap breakout buyers. Equally, a move below support followed by a strong reclaim could trap late sellers.
🌍 MARKET CONTEXT: SUPPORTIVE MOMENTUM, WITH HEADWINDS
My daily dashboard reports:
• Crypto Fear & Greed: 74
• Crypto average RSI: approximately 52.68
• BTC dominance: approximately 59.15%
• USDT dominance: approximately 6.44%, trending lower
• BTC funding: positive
• Reported US spot BTC ETF net flow: approximately -$148.69 million
These dashboard readings were not independently verified for this article, and their reporting periods may differ.
Falling USDT dominance can accompany greater risk appetite, while positive funding suggests longs are paying shorts. However, positive funding can also make crowded long positions vulnerable to liquidation.
The reported ETF outflow, stronger dollar and rising Treasury yields add caution to the bullish chart structure.
My dashboard also shows crypto market capitalization falling from $2.91 trillion to $2.87 trillion. That is a $40 billion change in market valuation; it should not be described as proof that $40 billion of cash left the market.
🔮 MY NEXT-MOVE OUTLOOK
My directional preference is cautiously bullish while BTC holds the $82,822 support area.
The first upside zone to watch is $84,598–$84,676. If buyers establish support above this area, the next meaningful objective becomes $86,606.
However, a sweep toward $83,000 could happen before an upside attempt. If BTC loses $82,822 and fails to reclaim it, the bullish intraday thesis weakens and $80,962 becomes the next major downside reference.
The daily chart supports the broader structure, but entries need lower-timeframe confirmation. I would not assign a precise probability to either path without a tested statistical model.
📈 CONDITIONAL LONG SIGNAL — SUPPORT SWEEP AND RECLAIM
Activation:
Wait for BTC to test the $82,850–$83,100 area, then produce a 1-hour close back above $83,100. Look for a retest that holds before entering.
Planned entry zone: $83,100–$83,250
Stop-loss: $82,650
Take-profit 1: $84,200
Take-profit 2: $84,600–$84,676
Take-profit 3: $86,500
Using an example entry of $83,175, the approximate reward-to-risk ratios are:
• TP1: 1.95R
• TP2 at $84,650: 2.81R
• TP3: 6.33R
These calculations exclude fees, funding and slippage.
This setup is inactive until the reclaim occurs. A sustained move below $82,822 without recovery is a reason to skip the long.
📉 CONDITIONAL SHORT SIGNAL — SUPPORT BREAK AND FAILED RETEST
Activation:
Wait for a 1-hour close below $82,822, followed by a retest of $82,750–$82,850 that fails to recover support.
Planned entry zone: $82,750–$82,850
Stop-loss: $83,250
Take-profit 1: $81,800
Take-profit 2: $80,962
Take-profit 3: $79,719
Using an example entry of $82,800, the approximate reward-to-risk ratios are:
• TP1: 2.22R
• TP2: 4.08R
• TP3: 6.85R
These calculations exclude fees, funding and slippage.
Cancel the short idea if BTC reclaims support and holds above it. A temporary wick below the level is insufficient confirmation.
🛡️ TRADE MANAGEMENT
These are alternative scenarios, not instructions to open both positions.
Size the position from the distance to the stop-loss and your predefined account risk. Consider taking partial profit at the first target and reassessing the remaining position as price approaches liquidity or resistance.
If price has already reached a target before the entry trigger appears, reassess the setup instead of chasing it. Higher targets may require multiple sessions.
Bitcoin’s next meaningful move depends on how it behaves around $84,676 and $82,822. Buyers retain the structural advantage above support, but confirmation will determine whether today delivers continuation, another range session, or a deeper pullback.
Educational market analysis only. Trade setups are conditional and profits are not guaranteed.
#bitcoin #BTC #CryptoTradingInsights #BTCanalysis #muhammadranarizwan $LTC
86

Article
Bitcoin at a Decision Point: $84K Breakout or $82K Liquidity Sweep?$BTC
{spot}(BTCUSDT)
Bitcoin Next Move Analysis | September 30, 2026
By Muhammad Rana Rizwan
Bitcoin is trading near $83,550 in the chart snapshot, following a pullback from the $86,600 region. The broader daily structure remains bullish inside the marked ascending channel, but short-term momentum has cooled.
The key question today: can buyers defend $82,822 and push BTC through $84,231, or will support failure expose liquidity near $82,225?
Here is the technical outlook and the conditional trading plan.
📊 1. Daily Structure: Uptrend Intact, Buyers Under Pressure
BTC has advanced strongly from its earlier consolidation and continues to trade inside an ascending channel.
However, the recent rejection around $86,606 has produced several corrective daily candles. Price is now approaching the lower portion of the channel, making the current support area important.
Holding this area would support a recovery attempt. A confirmed break below it would increase the risk of a deeper correction.
My current bias is cautiously bullish above $82,822, with confirmation needed before expecting stronger upside.
📈 2. Momentum: Daily Strength, Short-Term Consolidation
The daily chart shows RSI near 60.97. This suggests positive broader momentum, although RSI has eased from its recent peak.
The accompanying dashboard shows:
• Daily BTC RSI: approximately 61.
• 4-hour RSI: approximately 49.
• 1-hour RSI: approximately 53.
This combination suggests that the daily trend remains stronger than the immediate trading momentum. BTC may need further consolidation or a support retest before another sustained move higher.
The current daily candle is unfinished. Its volume should not be directly compared with completed daily candles to confirm a breakout or breakdown.
💧 3. Liquidity Levels to Watch
The supplied dashboard highlights potential liquidity areas near:
• $83,916 and $84,231 above the snapshot price.
• $82,579 and $82,225 below the snapshot price.
These are areas to monitor for acceleration, rejection or a liquidity sweep. They are estimates, not guaranteed destinations, and the dashboard’s long/short labels are inconsistent.
Two possible paths deserve attention:
An upward move into $83,916–$84,231 could develop into a breakout if buyers hold above that zone. A rejection there could send price back toward support.
Alternatively, BTC could sweep below $82,822 toward $82,579–$82,225. A quick reclaim would improve the recovery case; continued trading below support would favour further downside.
Neither sequence is confirmed yet.
🎯 4. Important Price Levels
Immediate support:
$82,822
Lower liquidity/support area:
$82,579–$82,225
Further downside levels:
$80,963
$79,719
$78,727–$78,234
$77,160
Immediate upside hurdles:
$83,916–$84,231
Major resistance:
$86,606
Higher resistance:
$88,308
Extended daily-chart resistance:
$93,929
The higher resistance levels are broader continuation references. They should not be treated as guaranteed targets for today.
🌍 5. Market Context: Mixed Signals
The supplied dashboard reports a crypto Fear & Greed reading of 29, indicating cautious sentiment. It also shows total crypto market capitalisation declining from approximately $2.88 trillion to $2.86 trillion.
That market-cap decline represents a change in market valuation; it does not prove that exactly $20 billion in cash exited crypto.
The dashboard also reports positive BTC spot ETF net inflows of approximately $66.19 million. This is potentially supportive, but the reporting period should be verified before treating it as today’s completed flow.
Together, these readings suggest a mixed backdrop: supportive institutional demand in the reported data, alongside weaker broader sentiment.
Price confirmation remains essential.
🟢 6. Conditional Long Signal: Support Hold and Reclaim
This setup becomes relevant only if BTC tests support, rejects lower prices and reclaims the entry area.
Entry zone:
$82,900–$83,100
Confirmation:
Wait for a 1-hour candle to reclaim $82,900 after a support test, followed by a retest that holds. Skip the entry if price continues accepting below $82,822.
Stop-loss:
$82,150
Take-profit levels:
TP1: $83,916
TP2: $84,231
TP3: $85,000
TP4: $86,606
At a reference entry of $83,000, the stop distance is $850 per BTC. TP2 offers approximately 1.45:1 reward-to-risk, while TP3 offers approximately 2.35:1, before fees and slippage.
TP1 is an early partial-profit area. Traders requiring at least 2:1 reward-to-risk should assess whether a move toward TP3 is realistic before entering.
This is a support-recovery setup, not an instruction to buy immediately at market.
🔴 7. Conditional Short Signal: Breakdown and Failed Retest
The bearish setup becomes relevant if buyers lose $82,822 and fail to recover it.
Entry zone:
$82,650–$82,800
Confirmation:
Wait for a 1-hour close below $82,822, then a failed retest from underneath. Avoid entering solely because of a brief wick below support.
Stop-loss:
$83,250
Take-profit levels:
TP1: $82,225
TP2: $80,963
TP3: $79,719
At a reference entry of $82,700, the stop distance is $550 per BTC. TP2 offers approximately 3.16:1 reward-to-risk before fees and slippage.
The bearish case weakens if BTC reclaims $82,822 and holds above it.
🚀 8. What Would Confirm Stronger Upside?
A convincing recovery requires BTC to break above $84,231 and hold that level on a retest, ideally with stronger completed-candle volume.
That would improve the case for a move toward $85,000 and potentially $86,606.
A sustained break above $86,606 would bring $88,308 into focus. Until those confirmations appear, an upward move can still be a bounce within the recent correction.
🛡️ 9. Risk Management
Use one confirmed setup at a time. Both signals remain inactive until their conditions occur.
Keep planned account risk small—for example, 0.5% per trade—and calculate position size from the entry-to-stop distance. Include fees and potential slippage.
Leverage should not determine how much you are willing to lose. Avoid increasing size after a losing trade or chasing price after it has already moved beyond the planned entry.
If neither setup confirms, waiting is a valid trading decision.
📝 My BTC Outlook for Today
Above $82,822, BTC retains a cautiously bullish recovery case, with $83,916–$84,231 as the first important upside test.
A confirmed hold above $84,231 would strengthen the continuation case toward $85,000 and $86,606.
Below $82,822, watch $82,579–$82,225 closely. A failed recovery could expose $80,963.
The daily trend remains constructive, but today’s direction depends on how price reacts at support and nearby liquidity. Let the candle close and the retest confirm the trade.
This analysis reflects the September 30 chart snapshot. Trade setups are educational scenarios, carry risk and may become invalid as price changes.
#bitcoin #BTC #BTCUSDTAnalysis #CryptoTradingInsights #muhammadranarizwan $BNB
$SOL
{spot}(SOLUSDT)
Bitcoin at a Decision Point: $84K Breakout or $82K Liquidity Sweep?
$BTC
Bitcoin Next Move Analysis | September 30, 2026
By Muhammad Rana Rizwan
Bitcoin is trading near $83,550 in the chart snapshot, following a pullback from the $86,600 region. The broader daily structure remains bullish inside the marked ascending channel, but short-term momentum has cooled.
The key question today: can buyers defend $82,822 and push BTC through $84,231, or will support failure expose liquidity near $82,225?
Here is the technical outlook and the conditional trading plan.
📊 1. Daily Structure: Uptrend Intact, Buyers Under Pressure
BTC has advanced strongly from its earlier consolidation and continues to trade inside an ascending channel.
However, the recent rejection around $86,606 has produced several corrective daily candles. Price is now approaching the lower portion of the channel, making the current support area important.
Holding this area would support a recovery attempt. A confirmed break below it would increase the risk of a deeper correction.
My current bias is cautiously bullish above $82,822, with confirmation needed before expecting stronger upside.
📈 2. Momentum: Daily Strength, Short-Term Consolidation
The daily chart shows RSI near 60.97. This suggests positive broader momentum, although RSI has eased from its recent peak.
The accompanying dashboard shows:
• Daily BTC RSI: approximately 61.
• 4-hour RSI: approximately 49.
• 1-hour RSI: approximately 53.
This combination suggests that the daily trend remains stronger than the immediate trading momentum. BTC may need further consolidation or a support retest before another sustained move higher.
The current daily candle is unfinished. Its volume should not be directly compared with completed daily candles to confirm a breakout or breakdown.
💧 3. Liquidity Levels to Watch
The supplied dashboard highlights potential liquidity areas near:
• $83,916 and $84,231 above the snapshot price.
• $82,579 and $82,225 below the snapshot price.
These are areas to monitor for acceleration, rejection or a liquidity sweep. They are estimates, not guaranteed destinations, and the dashboard’s long/short labels are inconsistent.
Two possible paths deserve attention:
An upward move into $83,916–$84,231 could develop into a breakout if buyers hold above that zone. A rejection there could send price back toward support.
Alternatively, BTC could sweep below $82,822 toward $82,579–$82,225. A quick reclaim would improve the recovery case; continued trading below support would favour further downside.
Neither sequence is confirmed yet.
🎯 4. Important Price Levels
Immediate support:
$82,822
Lower liquidity/support area:
$82,579–$82,225
Further downside levels:
$80,963
$79,719
$78,727–$78,234
$77,160
Immediate upside hurdles:
$83,916–$84,231
Major resistance:
$86,606
Higher resistance:
$88,308
Extended daily-chart resistance:
$93,929
The higher resistance levels are broader continuation references. They should not be treated as guaranteed targets for today.
🌍 5. Market Context: Mixed Signals
The supplied dashboard reports a crypto Fear & Greed reading of 29, indicating cautious sentiment. It also shows total crypto market capitalisation declining from approximately $2.88 trillion to $2.86 trillion.
That market-cap decline represents a change in market valuation; it does not prove that exactly $20 billion in cash exited crypto.
The dashboard also reports positive BTC spot ETF net inflows of approximately $66.19 million. This is potentially supportive, but the reporting period should be verified before treating it as today’s completed flow.
Together, these readings suggest a mixed backdrop: supportive institutional demand in the reported data, alongside weaker broader sentiment.
Price confirmation remains essential.
🟢 6. Conditional Long Signal: Support Hold and Reclaim
This setup becomes relevant only if BTC tests support, rejects lower prices and reclaims the entry area.
Entry zone:
$82,900–$83,100
Confirmation:
Wait for a 1-hour candle to reclaim $82,900 after a support test, followed by a retest that holds. Skip the entry if price continues accepting below $82,822.
Stop-loss:
$82,150
Take-profit levels:
TP1: $83,916
TP2: $84,231
TP3: $85,000
TP4: $86,606
At a reference entry of $83,000, the stop distance is $850 per BTC. TP2 offers approximately 1.45:1 reward-to-risk, while TP3 offers approximately 2.35:1, before fees and slippage.
TP1 is an early partial-profit area. Traders requiring at least 2:1 reward-to-risk should assess whether a move toward TP3 is realistic before entering.
This is a support-recovery setup, not an instruction to buy immediately at market.
🔴 7. Conditional Short Signal: Breakdown and Failed Retest
The bearish setup becomes relevant if buyers lose $82,822 and fail to recover it.
Entry zone:
$82,650–$82,800
Confirmation:
Wait for a 1-hour close below $82,822, then a failed retest from underneath. Avoid entering solely because of a brief wick below support.
Stop-loss:
$83,250
Take-profit levels:
TP1: $82,225
TP2: $80,963
TP3: $79,719
At a reference entry of $82,700, the stop distance is $550 per BTC. TP2 offers approximately 3.16:1 reward-to-risk before fees and slippage.
The bearish case weakens if BTC reclaims $82,822 and holds above it.
🚀 8. What Would Confirm Stronger Upside?
A convincing recovery requires BTC to break above $84,231 and hold that level on a retest, ideally with stronger completed-candle volume.
That would improve the case for a move toward $85,000 and potentially $86,606.
A sustained break above $86,606 would bring $88,308 into focus. Until those confirmations appear, an upward move can still be a bounce within the recent correction.
🛡️ 9. Risk Management
Use one confirmed setup at a time. Both signals remain inactive until their conditions occur.
Keep planned account risk small—for example, 0.5% per trade—and calculate position size from the entry-to-stop distance. Include fees and potential slippage.
Leverage should not determine how much you are willing to lose. Avoid increasing size after a losing trade or chasing price after it has already moved beyond the planned entry.
If neither setup confirms, waiting is a valid trading decision.
📝 My BTC Outlook for Today
Above $82,822, BTC retains a cautiously bullish recovery case, with $83,916–$84,231 as the first important upside test.
A confirmed hold above $84,231 would strengthen the continuation case toward $85,000 and $86,606.
Below $82,822, watch $82,579–$82,225 closely. A failed recovery could expose $80,963.
The daily trend remains constructive, but today’s direction depends on how price reacts at support and nearby liquidity. Let the candle close and the retest confirm the trade.
This analysis reflects the September 30 chart snapshot. Trade setups are educational scenarios, carry risk and may become invalid as price changes.
#bitcoin #BTC #BTCUSDTAnalysis #CryptoTradingInsights #muhammadranarizwan $BNB
$SOL
Bitcoin Next Move Analysis | September 30, 2026
By Muhammad Rana Rizwan
Bitcoin is trading near $83,550 in the chart snapshot, following a pullback from the $86,600 region. The broader daily structure remains bullish inside the marked ascending channel, but short-term momentum has cooled.
The key question today: can buyers defend $82,822 and push BTC through $84,231, or will support failure expose liquidity near $82,225?
Here is the technical outlook and the conditional trading plan.
📊 1. Daily Structure: Uptrend Intact, Buyers Under Pressure
BTC has advanced strongly from its earlier consolidation and continues to trade inside an ascending channel.
However, the recent rejection around $86,606 has produced several corrective daily candles. Price is now approaching the lower portion of the channel, making the current support area important.
Holding this area would support a recovery attempt. A confirmed break below it would increase the risk of a deeper correction.
My current bias is cautiously bullish above $82,822, with confirmation needed before expecting stronger upside.
📈 2. Momentum: Daily Strength, Short-Term Consolidation
The daily chart shows RSI near 60.97. This suggests positive broader momentum, although RSI has eased from its recent peak.
The accompanying dashboard shows:
• Daily BTC RSI: approximately 61.
• 4-hour RSI: approximately 49.
• 1-hour RSI: approximately 53.
This combination suggests that the daily trend remains stronger than the immediate trading momentum. BTC may need further consolidation or a support retest before another sustained move higher.
The current daily candle is unfinished. Its volume should not be directly compared with completed daily candles to confirm a breakout or breakdown.
💧 3. Liquidity Levels to Watch
The supplied dashboard highlights potential liquidity areas near:
• $83,916 and $84,231 above the snapshot price.
• $82,579 and $82,225 below the snapshot price.
These are areas to monitor for acceleration, rejection or a liquidity sweep. They are estimates, not guaranteed destinations, and the dashboard’s long/short labels are inconsistent.
Two possible paths deserve attention:
An upward move into $83,916–$84,231 could develop into a breakout if buyers hold above that zone. A rejection there could send price back toward support.
Alternatively, BTC could sweep below $82,822 toward $82,579–$82,225. A quick reclaim would improve the recovery case; continued trading below support would favour further downside.
Neither sequence is confirmed yet.
🎯 4. Important Price Levels
Immediate support:
$82,822
Lower liquidity/support area:
$82,579–$82,225
Further downside levels:
$80,963
$79,719
$78,727–$78,234
$77,160
Immediate upside hurdles:
$83,916–$84,231
Major resistance:
$86,606
Higher resistance:
$88,308
Extended daily-chart resistance:
$93,929
The higher resistance levels are broader continuation references. They should not be treated as guaranteed targets for today.
🌍 5. Market Context: Mixed Signals
The supplied dashboard reports a crypto Fear & Greed reading of 29, indicating cautious sentiment. It also shows total crypto market capitalisation declining from approximately $2.88 trillion to $2.86 trillion.
That market-cap decline represents a change in market valuation; it does not prove that exactly $20 billion in cash exited crypto.
The dashboard also reports positive BTC spot ETF net inflows of approximately $66.19 million. This is potentially supportive, but the reporting period should be verified before treating it as today’s completed flow.
Together, these readings suggest a mixed backdrop: supportive institutional demand in the reported data, alongside weaker broader sentiment.
Price confirmation remains essential.
🟢 6. Conditional Long Signal: Support Hold and Reclaim
This setup becomes relevant only if BTC tests support, rejects lower prices and reclaims the entry area.
Entry zone:
$82,900–$83,100
Confirmation:
Wait for a 1-hour candle to reclaim $82,900 after a support test, followed by a retest that holds. Skip the entry if price continues accepting below $82,822.
Stop-loss:
$82,150
Take-profit levels:
TP1: $83,916
TP2: $84,231
TP3: $85,000
TP4: $86,606
At a reference entry of $83,000, the stop distance is $850 per BTC. TP2 offers approximately 1.45:1 reward-to-risk, while TP3 offers approximately 2.35:1, before fees and slippage.
TP1 is an early partial-profit area. Traders requiring at least 2:1 reward-to-risk should assess whether a move toward TP3 is realistic before entering.
This is a support-recovery setup, not an instruction to buy immediately at market.
🔴 7. Conditional Short Signal: Breakdown and Failed Retest
The bearish setup becomes relevant if buyers lose $82,822 and fail to recover it.
Entry zone:
$82,650–$82,800
Confirmation:
Wait for a 1-hour close below $82,822, then a failed retest from underneath. Avoid entering solely because of a brief wick below support.
Stop-loss:
$83,250
Take-profit levels:
TP1: $82,225
TP2: $80,963
TP3: $79,719
At a reference entry of $82,700, the stop distance is $550 per BTC. TP2 offers approximately 3.16:1 reward-to-risk before fees and slippage.
The bearish case weakens if BTC reclaims $82,822 and holds above it.
🚀 8. What Would Confirm Stronger Upside?
A convincing recovery requires BTC to break above $84,231 and hold that level on a retest, ideally with stronger completed-candle volume.
That would improve the case for a move toward $85,000 and potentially $86,606.
A sustained break above $86,606 would bring $88,308 into focus. Until those confirmations appear, an upward move can still be a bounce within the recent correction.
🛡️ 9. Risk Management
Use one confirmed setup at a time. Both signals remain inactive until their conditions occur.
Keep planned account risk small—for example, 0.5% per trade—and calculate position size from the entry-to-stop distance. Include fees and potential slippage.
Leverage should not determine how much you are willing to lose. Avoid increasing size after a losing trade or chasing price after it has already moved beyond the planned entry.
If neither setup confirms, waiting is a valid trading decision.
📝 My BTC Outlook for Today
Above $82,822, BTC retains a cautiously bullish recovery case, with $83,916–$84,231 as the first important upside test.
A confirmed hold above $84,231 would strengthen the continuation case toward $85,000 and $86,606.
Below $82,822, watch $82,579–$82,225 closely. A failed recovery could expose $80,963.
The daily trend remains constructive, but today’s direction depends on how price reacts at support and nearby liquidity. Let the candle close and the retest confirm the trade.
This analysis reflects the September 30 chart snapshot. Trade setups are educational scenarios, carry risk and may become invalid as price changes.
#bitcoin #BTC #BTCUSDTAnalysis #CryptoTradingInsights #muhammadranarizwan $BNB
$SOL
84

Article
Bitcoin’s Next Move: Can BTC Break $84,850, or Is a Pullback Coming? BTC market outlook | September$BTC
{spot}(BTCUSDT)
Bitcoin is trading around $84,330 on the BTCUSDT perpetual chart captured at 6:16 PM Pakistan time. The daily candle is green, but price is still consolidating after its recent push higher. The next move depends on whether buyers can clear the resistance above the current range.
The broader chart remains constructive. BTC has been moving within a rising channel, and the daily RSI is around 63: bullish momentum is present, though price is approaching an area where sellers may respond. My market notes also show BTC open interest easing and funding near neutral. That gives room for a move, but it does not tell us which side will win.
Levels I’m Watching
Immediate resistance: $84,843–$84,856. This is the nearby upside liquidity area. A quick move into it could trigger short liquidations, but a touch alone would not confirm a breakout.
Next resistance: $86,605, followed by $88,308 if buyers sustain momentum.
Immediate support: $83,393, then the $82,823–$82,133 zone. Losing this area would weaken the bullish case and expose lower chart supports near $80,963 and $79,719.
My Primary Trade Setup: Conditional Long
I’m watching for a one-hour candle close above $84,850, followed by a successful retest of the $84,800–$84,950 area. If that happens, a possible long setup is:
Entry: $84,800–$84,950 after the retest holdsStop loss: Below $84,200Target 1: $86,605Target 2: $88,308
I would consider taking partial profit at the first target and managing the remainder with a raised stop. Entering simply because price spikes above $84,850 is riskier; I want to see buyers defend the breakout.
What If BTC Moves Down First?
A rejection at $84,850 could send price back toward $83,393 or $82,823. That would still be a pullback within the broader upward structure unless support breaks decisively.
My bullish setup is invalidated if BTC closes below $82,823 and fails to reclaim it on a retest. In that case, I would stop looking for the long and watch for a possible short toward $80,963, then $79,719. A short would need its own confirmed entry and stop above the failed retest; it is not an automatic trade the moment support is touched.
My view: BTC has a path toward $84,850 first, but the trade comes from confirmation, not a predicted percentage. The breakout and retest are the signal. If price stays trapped between support and resistance, patience is the position.
These are chart-based scenarios, not guaranteed outcomes. Set position size from the distance to your stop, especially when trading perpetual futures with leverage.
#bitcoin #BTCUSDT #BitcoinAnalysis" #CryptoTradingInsights #muhammadranarizwan
Bitcoin’s Next Move: Can BTC Break $84,850, or Is a Pullback Coming? BTC market outlook | September
$BTC
Bitcoin is trading around $84,330 on the BTCUSDT perpetual chart captured at 6:16 PM Pakistan time. The daily candle is green, but price is still consolidating after its recent push higher. The next move depends on whether buyers can clear the resistance above the current range.
The broader chart remains constructive. BTC has been moving within a rising channel, and the daily RSI is around 63: bullish momentum is present, though price is approaching an area where sellers may respond. My market notes also show BTC open interest easing and funding near neutral. That gives room for a move, but it does not tell us which side will win.
Levels I’m Watching
Immediate resistance: $84,843–$84,856. This is the nearby upside liquidity area. A quick move into it could trigger short liquidations, but a touch alone would not confirm a breakout.
Next resistance: $86,605, followed by $88,308 if buyers sustain momentum.
Immediate support: $83,393, then the $82,823–$82,133 zone. Losing this area would weaken the bullish case and expose lower chart supports near $80,963 and $79,719.
My Primary Trade Setup: Conditional Long
I’m watching for a one-hour candle close above $84,850, followed by a successful retest of the $84,800–$84,950 area. If that happens, a possible long setup is:
Entry: $84,800–$84,950 after the retest holdsStop loss: Below $84,200Target 1: $86,605Target 2: $88,308
I would consider taking partial profit at the first target and managing the remainder with a raised stop. Entering simply because price spikes above $84,850 is riskier; I want to see buyers defend the breakout.
What If BTC Moves Down First?
A rejection at $84,850 could send price back toward $83,393 or $82,823. That would still be a pullback within the broader upward structure unless support breaks decisively.
My bullish setup is invalidated if BTC closes below $82,823 and fails to reclaim it on a retest. In that case, I would stop looking for the long and watch for a possible short toward $80,963, then $79,719. A short would need its own confirmed entry and stop above the failed retest; it is not an automatic trade the moment support is touched.
My view: BTC has a path toward $84,850 first, but the trade comes from confirmation, not a predicted percentage. The breakout and retest are the signal. If price stays trapped between support and resistance, patience is the position.
These are chart-based scenarios, not guaranteed outcomes. Set position size from the distance to your stop, especially when trading perpetual futures with leverage.
#bitcoin #BTCUSDT #BitcoinAnalysis" #CryptoTradingInsights #muhammadranarizwan
Bitcoin is trading around $84,330 on the BTCUSDT perpetual chart captured at 6:16 PM Pakistan time. The daily candle is green, but price is still consolidating after its recent push higher. The next move depends on whether buyers can clear the resistance above the current range.
The broader chart remains constructive. BTC has been moving within a rising channel, and the daily RSI is around 63: bullish momentum is present, though price is approaching an area where sellers may respond. My market notes also show BTC open interest easing and funding near neutral. That gives room for a move, but it does not tell us which side will win.
Levels I’m Watching
Immediate resistance: $84,843–$84,856. This is the nearby upside liquidity area. A quick move into it could trigger short liquidations, but a touch alone would not confirm a breakout.
Next resistance: $86,605, followed by $88,308 if buyers sustain momentum.
Immediate support: $83,393, then the $82,823–$82,133 zone. Losing this area would weaken the bullish case and expose lower chart supports near $80,963 and $79,719.
My Primary Trade Setup: Conditional Long
I’m watching for a one-hour candle close above $84,850, followed by a successful retest of the $84,800–$84,950 area. If that happens, a possible long setup is:
Entry: $84,800–$84,950 after the retest holdsStop loss: Below $84,200Target 1: $86,605Target 2: $88,308
I would consider taking partial profit at the first target and managing the remainder with a raised stop. Entering simply because price spikes above $84,850 is riskier; I want to see buyers defend the breakout.
What If BTC Moves Down First?
A rejection at $84,850 could send price back toward $83,393 or $82,823. That would still be a pullback within the broader upward structure unless support breaks decisively.
My bullish setup is invalidated if BTC closes below $82,823 and fails to reclaim it on a retest. In that case, I would stop looking for the long and watch for a possible short toward $80,963, then $79,719. A short would need its own confirmed entry and stop above the failed retest; it is not an automatic trade the moment support is touched.
My view: BTC has a path toward $84,850 first, but the trade comes from confirmation, not a predicted percentage. The breakout and retest are the signal. If price stays trapped between support and resistance, patience is the position.
These are chart-based scenarios, not guaranteed outcomes. Set position size from the distance to your stop, especially when trading perpetual futures with leverage.
#bitcoin #BTCUSDT #BitcoinAnalysis" #CryptoTradingInsights #muhammadranarizwan
75
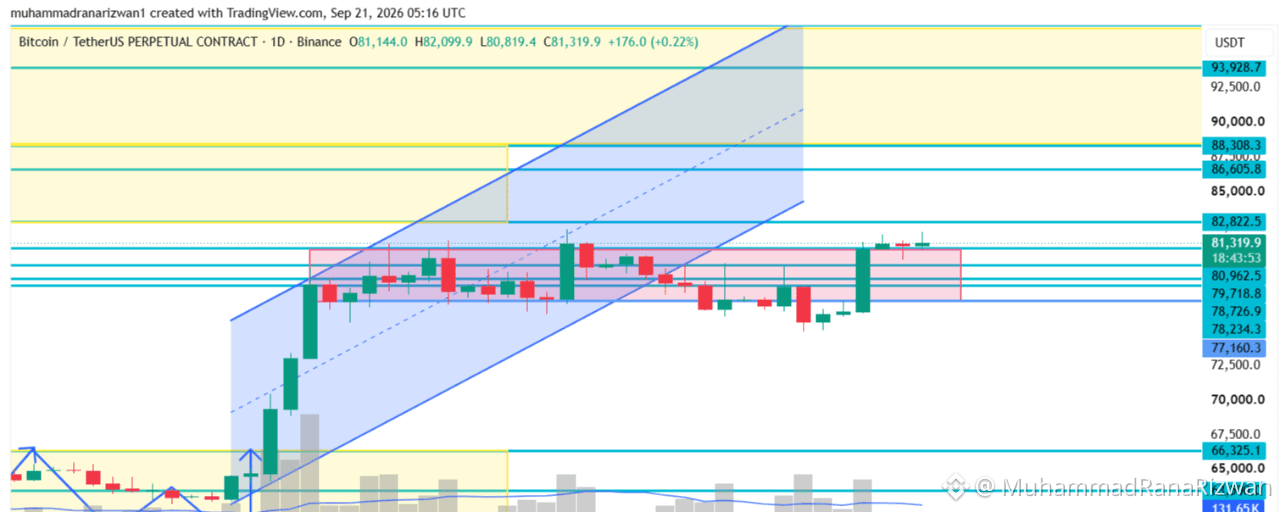
Article
BTC AT $81.3K: Breakout Loading or Another Rejection? Key Levels to Watch Today$BTC
{spot}(BTCUSDT)
Bitcoin is currently trading around $81,320, sitting at an important decision zone after a strong recovery from the $77K–$79K area. The daily chart shows BTC maintaining an overall uptrend, while the latest data also indicates positive momentum across BTC/USD and BTCUSDT.P. The attached market dashboard shows BTC daily RSI around 64, 4H RSI around 67, and 1H RSI around 55, with the trend marked as bullish.
Recent market coverage also shows BTC reclaiming the $80K area and trading above $81K, although the $82K–$83K region remains an important resistance/supply area.
📊 BTC Technical Structure
On the 1D chart, Bitcoin has formed a strong upward channel after bouncing from the lower $77K region. Price is now testing the upper portion of the recent consolidation.
The most important immediate resistance is around:
$81,800–$82,000
A clean daily breakout above this zone could open the way toward the next major resistance around:
🎯 $82,822
If buyers successfully turn $82.8K into support, the next upside zone visible on the chart is approximately:
🎯 $86,605
🎯 $88,308
This would represent a continuation of the current bullish structure rather than simply another range move.
🟢 Bullish Scenario
The bullish setup becomes stronger if BTC maintains price above $80,962–$81,000 and produces a convincing breakout above $82,000–$82,300.
In that situation, traders could watch:
$82,822 → $86,605 → $88,308
The attached dashboard also indicates a 75% long-side / 25% short-side directional reading, with $82,144.30 identified as the long-side level and $80,408.86 as the opposing level.
However, these readings are indicators rather than guarantees, so confirmation through price action and volume remains important.
🔴 Bearish / Pullback Scenario
BTC could face rejection if it repeatedly fails around $81.8K–$82.3K.
If price loses $80,962, the next support areas from the chart are:
$79,718 → $78,726 → $78,234 → $77,160
A move below $78.2K would weaken the current bullish structure and increase the possibility of a deeper retest toward the lower part of the channel.
The market dashboard also describes BTC volatility as elevated while funding is neutral, meaning sudden moves in either direction remain possible.
🎯 BTC Trade Setup — Educational Signal
LONG SETUP:
Entry: $80,900–$81,200 after confirmation
Stop Loss: $79,650
TP1: $82,000
TP2: $82,822
TP3: $86,605
BREAKOUT LONG:
Entry after confirmed breakout above $82,300
SL: $81,300
Targets: $84,000 → $86,605 → $88,308
SHORT SETUP:
Only consider if BTC shows a confirmed rejection around $82K–$82.8K and loses $80,900.
Potential targets: $79,718 → $78,726 → $78,234
⚠️ Risk Management: These are chart-based scenarios, not guaranteed signals. Avoid entering solely because price touches a level. Wait for confirmation, control position size, and always define your invalidation before entering a trade.
🔥 Final Outlook
BTC is currently at a high-impact decision zone. The broader structure remains bullish, but price is approaching resistance where sellers could become active.
For bulls, the key message is simple:
Hold above $80.9K + break $82.3K = potential continuation toward $82.8K, $86.6K and $88.3K.
For bears, the important confirmation would be a rejection followed by a breakdown below $80.9K, which could send BTC back toward the $79.7K–$78.2K support cluster.
The next major move will likely be decided by how BTC reacts around $82K. 👀📈
#BitcoinDunyamiz #BTC走势分析 #BTCUSDTAnalysis #CryptoTradingInsights #BinanceSquare $BTC $BNB
BTC AT $81.3K: Breakout Loading or Another Rejection? Key Levels to Watch Today
$BTC
Bitcoin is currently trading around $81,320, sitting at an important decision zone after a strong recovery from the $77K–$79K area. The daily chart shows BTC maintaining an overall uptrend, while the latest data also indicates positive momentum across BTC/USD and BTCUSDT.P. The attached market dashboard shows BTC daily RSI around 64, 4H RSI around 67, and 1H RSI around 55, with the trend marked as bullish.
Recent market coverage also shows BTC reclaiming the $80K area and trading above $81K, although the $82K–$83K region remains an important resistance/supply area.
📊 BTC Technical Structure
On the 1D chart, Bitcoin has formed a strong upward channel after bouncing from the lower $77K region. Price is now testing the upper portion of the recent consolidation.
The most important immediate resistance is around:
$81,800–$82,000
A clean daily breakout above this zone could open the way toward the next major resistance around:
🎯 $82,822
If buyers successfully turn $82.8K into support, the next upside zone visible on the chart is approximately:
🎯 $86,605
🎯 $88,308
This would represent a continuation of the current bullish structure rather than simply another range move.
🟢 Bullish Scenario
The bullish setup becomes stronger if BTC maintains price above $80,962–$81,000 and produces a convincing breakout above $82,000–$82,300.
In that situation, traders could watch:
$82,822 → $86,605 → $88,308
The attached dashboard also indicates a 75% long-side / 25% short-side directional reading, with $82,144.30 identified as the long-side level and $80,408.86 as the opposing level.
However, these readings are indicators rather than guarantees, so confirmation through price action and volume remains important.
🔴 Bearish / Pullback Scenario
BTC could face rejection if it repeatedly fails around $81.8K–$82.3K.
If price loses $80,962, the next support areas from the chart are:
$79,718 → $78,726 → $78,234 → $77,160
A move below $78.2K would weaken the current bullish structure and increase the possibility of a deeper retest toward the lower part of the channel.
The market dashboard also describes BTC volatility as elevated while funding is neutral, meaning sudden moves in either direction remain possible.
🎯 BTC Trade Setup — Educational Signal
LONG SETUP:
Entry: $80,900–$81,200 after confirmation
Stop Loss: $79,650
TP1: $82,000
TP2: $82,822
TP3: $86,605
BREAKOUT LONG:
Entry after confirmed breakout above $82,300
SL: $81,300
Targets: $84,000 → $86,605 → $88,308
SHORT SETUP:
Only consider if BTC shows a confirmed rejection around $82K–$82.8K and loses $80,900.
Potential targets: $79,718 → $78,726 → $78,234
⚠️ Risk Management: These are chart-based scenarios, not guaranteed signals. Avoid entering solely because price touches a level. Wait for confirmation, control position size, and always define your invalidation before entering a trade.
🔥 Final Outlook
BTC is currently at a high-impact decision zone. The broader structure remains bullish, but price is approaching resistance where sellers could become active.
For bulls, the key message is simple:
Hold above $80.9K + break $82.3K = potential continuation toward $82.8K, $86.6K and $88.3K.
For bears, the important confirmation would be a rejection followed by a breakdown below $80.9K, which could send BTC back toward the $79.7K–$78.2K support cluster.
The next major move will likely be decided by how BTC reacts around $82K. 👀📈
#BitcoinDunyamiz #BTC走势分析 #BTCUSDTAnalysis #CryptoTradingInsights #BinanceSquare $BTC $BNB
Bitcoin is currently trading around $81,320, sitting at an important decision zone after a strong recovery from the $77K–$79K area. The daily chart shows BTC maintaining an overall uptrend, while the latest data also indicates positive momentum across BTC/USD and BTCUSDT.P. The attached market dashboard shows BTC daily RSI around 64, 4H RSI around 67, and 1H RSI around 55, with the trend marked as bullish.
Recent market coverage also shows BTC reclaiming the $80K area and trading above $81K, although the $82K–$83K region remains an important resistance/supply area.
📊 BTC Technical Structure
On the 1D chart, Bitcoin has formed a strong upward channel after bouncing from the lower $77K region. Price is now testing the upper portion of the recent consolidation.
The most important immediate resistance is around:
$81,800–$82,000
A clean daily breakout above this zone could open the way toward the next major resistance around:
🎯 $82,822
If buyers successfully turn $82.8K into support, the next upside zone visible on the chart is approximately:
🎯 $86,605
🎯 $88,308
This would represent a continuation of the current bullish structure rather than simply another range move.
🟢 Bullish Scenario
The bullish setup becomes stronger if BTC maintains price above $80,962–$81,000 and produces a convincing breakout above $82,000–$82,300.
In that situation, traders could watch:
$82,822 → $86,605 → $88,308
The attached dashboard also indicates a 75% long-side / 25% short-side directional reading, with $82,144.30 identified as the long-side level and $80,408.86 as the opposing level.
However, these readings are indicators rather than guarantees, so confirmation through price action and volume remains important.
🔴 Bearish / Pullback Scenario
BTC could face rejection if it repeatedly fails around $81.8K–$82.3K.
If price loses $80,962, the next support areas from the chart are:
$79,718 → $78,726 → $78,234 → $77,160
A move below $78.2K would weaken the current bullish structure and increase the possibility of a deeper retest toward the lower part of the channel.
The market dashboard also describes BTC volatility as elevated while funding is neutral, meaning sudden moves in either direction remain possible.
🎯 BTC Trade Setup — Educational Signal
LONG SETUP:
Entry: $80,900–$81,200 after confirmation
Stop Loss: $79,650
TP1: $82,000
TP2: $82,822
TP3: $86,605
BREAKOUT LONG:
Entry after confirmed breakout above $82,300
SL: $81,300
Targets: $84,000 → $86,605 → $88,308
SHORT SETUP:
Only consider if BTC shows a confirmed rejection around $82K–$82.8K and loses $80,900.
Potential targets: $79,718 → $78,726 → $78,234
⚠️ Risk Management: These are chart-based scenarios, not guaranteed signals. Avoid entering solely because price touches a level. Wait for confirmation, control position size, and always define your invalidation before entering a trade.
🔥 Final Outlook
BTC is currently at a high-impact decision zone. The broader structure remains bullish, but price is approaching resistance where sellers could become active.
For bulls, the key message is simple:
Hold above $80.9K + break $82.3K = potential continuation toward $82.8K, $86.6K and $88.3K.
For bears, the important confirmation would be a rejection followed by a breakdown below $80.9K, which could send BTC back toward the $79.7K–$78.2K support cluster.
The next major move will likely be decided by how BTC reacts around $82K. 👀📈
#BitcoinDunyamiz #BTC走势分析 #BTCUSDTAnalysis #CryptoTradingInsights #BinanceSquare $BTC $BNB
73
The only Cyber Truck my portfolio can get me….
The only Cyber Truck my portfolio can get me….

73
Which Altcoin could 10x in the coming bull run?
$SOL
$XRP
$HYPE
$SUI
$ONDO
$NEAR
$ZEC
$DOGE
Which Altcoin could 10x in the coming bull run?
$SOL
$XRP
$HYPE
$SUI
$ONDO
$NEAR
$ZEC
$DOGE
$SOL
$XRP
$HYPE
$SUI
$ONDO
$NEAR
$ZEC
$DOGE
73
STOP SEARCHING FINANCIAL SITES ON GOOGLE 🚨🛑👀
Scammers copy apps and sites, buy the top sponsored Google slot, and sit above the real link. On 6 August 2026, a user said that trap took his life savings after a fake Trezor page asked for seed words (wallet backup). 💸🔓
Same class of hits 🟥
🔶 Uniswap Google ads above about $400k · 🔷 SEAL near about $1.27M · 🔸 Ledger app-style clone about $9.5M
Never type seed words into a browser. Type the real URL or use a bookmark. ✅
Will people keep clicking the top Google ad for “wallet,” or switch to typed URLs and bookmarks only? 👇
#CryptoScamAlert #CryptoScamAwareness #crypto #CryptoPatience #DollarSetForBestDayInTwoWeeks
STOP SEARCHING FINANCIAL SITES ON GOOGLE 🚨🛑👀
Scammers copy apps and sites, buy the top sponsored Google slot, and sit above the real link. On 6 August 2026, a user said that trap took his life savings after a fake Trezor page asked for seed words (wallet backup). 💸🔓
Same class of hits 🟥
🔶 Uniswap Google ads above about $400k · 🔷 SEAL near about $1.27M · 🔸 Ledger app-style clone about $9.5M
Never type seed words into a browser. Type the real URL or use a bookmark. ✅
Will people keep clicking the top Google ad for “wallet,” or switch to typed URLs and bookmarks only? 👇
#CryptoScamAlert #CryptoScamAwareness #crypto #CryptoPatience #DollarSetForBestDayInTwoWeeks
Scammers copy apps and sites, buy the top sponsored Google slot, and sit above the real link. On 6 August 2026, a user said that trap took his life savings after a fake Trezor page asked for seed words (wallet backup). 💸🔓
Same class of hits 🟥
🔶 Uniswap Google ads above about $400k · 🔷 SEAL near about $1.27M · 🔸 Ledger app-style clone about $9.5M
Never type seed words into a browser. Type the real URL or use a bookmark. ✅
Will people keep clicking the top Google ad for “wallet,” or switch to typed URLs and bookmarks only? 👇
#CryptoScamAlert #CryptoScamAwareness #crypto #CryptoPatience #DollarSetForBestDayInTwoWeeks
74
#USToCancelIranAttackSubjectToDeal 🌍 Macro Update: Geopolitical Risk Cooling?
Reports suggest President Trump has paused planned strikes on Iran while efforts continue toward a rapid diplomatic deal and the reopening of the Strait of Hormuz. Oil prices have reacted lower as markets price in reduced geopolitical risk, although key details remain disputed and the situation is still evolving. �
Reuters +1
What does this mean for crypto? ✅ Lower oil prices can ease inflation concerns. ✅ Markets may expect a more dovish outlook if energy prices stay contained. ✅ Bitcoin could benefit if global risk sentiment continues to improve.
But stay cautious: One headline can change everything. Risk management is more important than prediction.
Are you bullish or bearish on BTC this week? 👇
#Bitcoin #BTC #Crypto #BinanceSquare #Macro #iran #Trump #oil #Markets #Trading #Altcoins #Investing
#USToCancelIranAttackSubjectToDeal 🌍 Macro Update: Geopolitical Risk Cooling?
Reports suggest President Trump has paused planned strikes on Iran while efforts continue toward a rapid diplomatic deal and the reopening of the Strait of Hormuz. Oil prices have reacted lower as markets price in reduced geopolitical risk, although key details remain disputed and the situation is still evolving. �
Reuters +1
What does this mean for crypto? ✅ Lower oil prices can ease inflation concerns. ✅ Markets may expect a more dovish outlook if energy prices stay contained. ✅ Bitcoin could benefit if global risk sentiment continues to improve.
But stay cautious: One headline can change everything. Risk management is more important than prediction.
Are you bullish or bearish on BTC this week? 👇
#Bitcoin #BTC #Crypto #BinanceSquare #Macro #iran #Trump #oil #Markets #Trading #Altcoins #Investing
Reports suggest President Trump has paused planned strikes on Iran while efforts continue toward a rapid diplomatic deal and the reopening of the Strait of Hormuz. Oil prices have reacted lower as markets price in reduced geopolitical risk, although key details remain disputed and the situation is still evolving. �
Reuters +1
What does this mean for crypto? ✅ Lower oil prices can ease inflation concerns. ✅ Markets may expect a more dovish outlook if energy prices stay contained. ✅ Bitcoin could benefit if global risk sentiment continues to improve.
But stay cautious: One headline can change everything. Risk management is more important than prediction.
Are you bullish or bearish on BTC this week? 👇
#Bitcoin #BTC #Crypto #BinanceSquare #Macro #iran #Trump #oil #Markets #Trading #Altcoins #Investing
105
#baby $BABY
Trustless Bitcoin Vaults could redefine how long-term BTC holders think about security. Instead of relying on traditional custody, Babylon is exploring a trust-minimized approach that keeps Bitcoin at the center while enabling broader utility. Excited to see how this innovation evolves. @BabylonLabs_io $BABY
{spot}(BABYUSDT)
#baby $BABY
Trustless Bitcoin Vaults could redefine how long-term BTC holders think about security. Instead of relying on traditional custody, Babylon is exploring a trust-minimized approach that keeps Bitcoin at the center while enabling broader utility. Excited to see how this innovation evolves. @BabylonLabs_io $BABY
Trustless Bitcoin Vaults could redefine how long-term BTC holders think about security. Instead of relying on traditional custody, Babylon is exploring a trust-minimized approach that keeps Bitcoin at the center while enabling broader utility. Excited to see how this innovation evolves. @BabylonLabs_io $BABY

70
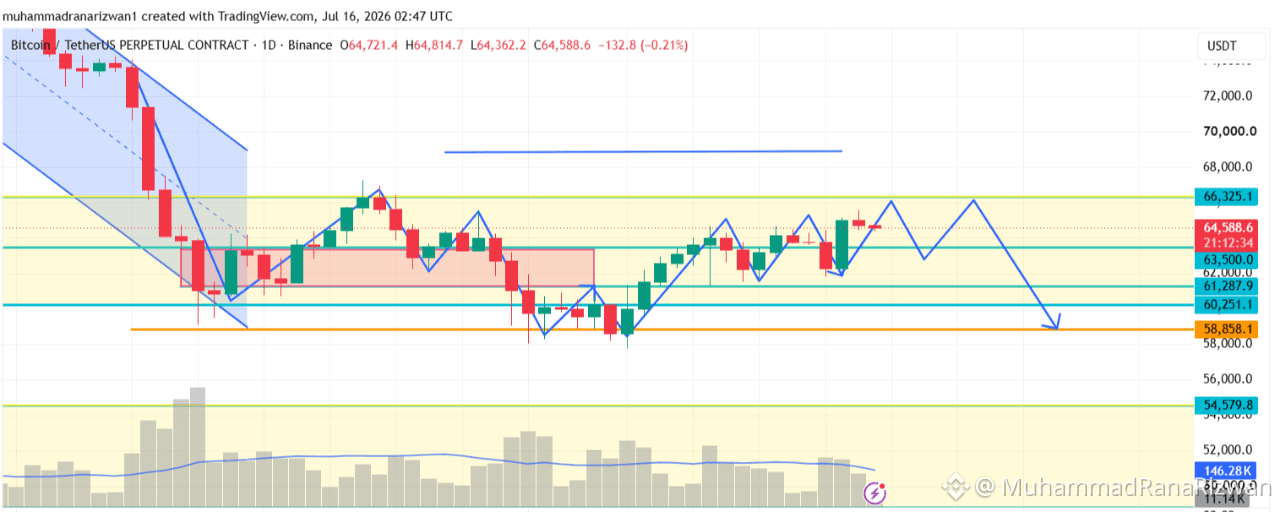
Article
BTC Daily Outlook: Liquidity Trap Before the Big Move? | July 16, 2026$BTC
{future}(BTCUSDT)
📈Bitcoin is currently trading around $64.6K and continues to move inside a well-defined consolidation range. Based on the chart structure and today's market data, BTC is approaching a critical decision point where liquidity on both sides is building. The next move will likely be determined after a sweep of either the upper or lower liquidity zones.
🔍 Market Overview
📌 Current Price: $64,579
The overall market remains in a downtrend on the higher timeframe, but buyers have successfully defended the lower demand zone several times. RSI is sitting near 54.5, indicating neutral momentum without extreme overbought or oversold conditions. The uploaded market sheet also highlights 75% probability that the downside liquidity ($64,026 area) is taken before any upside move, while the first bullish liquidity target remains near $66,100.
📊 Important Levels
🟢 Resistance Zone
$66,300 – $66,500
A strong daily candle close above this zone would invalidate many short positions and could trigger momentum toward:
✅ $68,000
✅ $69,000
🔵 Immediate Support
$63,500
As long as BTC holds above this level, bulls remain in control of the short-term structure.
🔴 Major Demand Zone
$61,300 – $60,250
If sellers gain control and price loses $63.5K, this area becomes the next important support where buyers may step back in.
🟠 Strong Weekly Support
$58,858
This is the strongest support visible on the chart. If panic selling occurs, this zone could provide a high-probability reaction.
📈 Bullish Scenario
✔ Hold above $63.5K
✔ Break above $66.3K
🎯 Targets:
• $68K
• $69K
Momentum confirmation only comes after a daily close above resistance.
📉 Bearish Scenario
If BTC loses $63.5K, expect liquidity to be collected below support first.
Possible downside targets:
🎯 $61.3K
🎯 $60.2K
🎯 $58.8K
This scenario also aligns with today's liquidity positioning shown in the market data sheet.
💡 Market Sentiment
RSI remains neutral around 54, leaving room for movement in either direction.Volatility is still relatively low, which often precedes a larger breakout.Positive funding rate suggests many traders remain long, increasing the possibility of a liquidity sweep before the next sustained move.Bitcoin Spot ETF data shows a modest daily inflow, while the weekly flow remains negative, reflecting mixed institutional sentiment.
📌 Final View
Bitcoin is still ranging, not trending.
The safest approach is to wait for confirmation instead of predicting direction.
Above $66.3K → Bullish continuation
Below $63.5K → Correction toward $61K–$60K becomes more likely
Always manage risk and avoid chasing candles inside the range.
💬 What do you think?
Do you expect BTC to break above $66.3K first, or will it sweep the $61K-$60K liquidity zone before the next rally? 📊
Share your analysis in the comments! 👇
If you enjoy data-driven Bitcoin analysis, follow my profile for daily market updates, technical analysis, and high-probability trading insights. 🚀
⚠️ Not Financial Advice (NFA). Always Do Your Own Research (DYOR).
#PriceActionAnalysis #SupportResistance #BitcoinAnalysis #MarketUpdate #dyor
BTC Daily Outlook: Liquidity Trap Before the Big Move? | July 16, 2026
$BTC
📈Bitcoin is currently trading around $64.6K and continues to move inside a well-defined consolidation range. Based on the chart structure and today's market data, BTC is approaching a critical decision point where liquidity on both sides is building. The next move will likely be determined after a sweep of either the upper or lower liquidity zones.
🔍 Market Overview
📌 Current Price: $64,579
The overall market remains in a downtrend on the higher timeframe, but buyers have successfully defended the lower demand zone several times. RSI is sitting near 54.5, indicating neutral momentum without extreme overbought or oversold conditions. The uploaded market sheet also highlights 75% probability that the downside liquidity ($64,026 area) is taken before any upside move, while the first bullish liquidity target remains near $66,100.
📊 Important Levels
🟢 Resistance Zone
$66,300 – $66,500
A strong daily candle close above this zone would invalidate many short positions and could trigger momentum toward:
✅ $68,000
✅ $69,000
🔵 Immediate Support
$63,500
As long as BTC holds above this level, bulls remain in control of the short-term structure.
🔴 Major Demand Zone
$61,300 – $60,250
If sellers gain control and price loses $63.5K, this area becomes the next important support where buyers may step back in.
🟠 Strong Weekly Support
$58,858
This is the strongest support visible on the chart. If panic selling occurs, this zone could provide a high-probability reaction.
📈 Bullish Scenario
✔ Hold above $63.5K
✔ Break above $66.3K
🎯 Targets:
• $68K
• $69K
Momentum confirmation only comes after a daily close above resistance.
📉 Bearish Scenario
If BTC loses $63.5K, expect liquidity to be collected below support first.
Possible downside targets:
🎯 $61.3K
🎯 $60.2K
🎯 $58.8K
This scenario also aligns with today's liquidity positioning shown in the market data sheet.
💡 Market Sentiment
RSI remains neutral around 54, leaving room for movement in either direction.Volatility is still relatively low, which often precedes a larger breakout.Positive funding rate suggests many traders remain long, increasing the possibility of a liquidity sweep before the next sustained move.Bitcoin Spot ETF data shows a modest daily inflow, while the weekly flow remains negative, reflecting mixed institutional sentiment.
📌 Final View
Bitcoin is still ranging, not trending.
The safest approach is to wait for confirmation instead of predicting direction.
Above $66.3K → Bullish continuation
Below $63.5K → Correction toward $61K–$60K becomes more likely
Always manage risk and avoid chasing candles inside the range.
💬 What do you think?
Do you expect BTC to break above $66.3K first, or will it sweep the $61K-$60K liquidity zone before the next rally? 📊
Share your analysis in the comments! 👇
If you enjoy data-driven Bitcoin analysis, follow my profile for daily market updates, technical analysis, and high-probability trading insights. 🚀
⚠️ Not Financial Advice (NFA). Always Do Your Own Research (DYOR).
#PriceActionAnalysis #SupportResistance #BitcoinAnalysis #MarketUpdate #dyor
📈Bitcoin is currently trading around $64.6K and continues to move inside a well-defined consolidation range. Based on the chart structure and today's market data, BTC is approaching a critical decision point where liquidity on both sides is building. The next move will likely be determined after a sweep of either the upper or lower liquidity zones.
🔍 Market Overview
📌 Current Price: $64,579
The overall market remains in a downtrend on the higher timeframe, but buyers have successfully defended the lower demand zone several times. RSI is sitting near 54.5, indicating neutral momentum without extreme overbought or oversold conditions. The uploaded market sheet also highlights 75% probability that the downside liquidity ($64,026 area) is taken before any upside move, while the first bullish liquidity target remains near $66,100.
📊 Important Levels
🟢 Resistance Zone
$66,300 – $66,500
A strong daily candle close above this zone would invalidate many short positions and could trigger momentum toward:
✅ $68,000
✅ $69,000
🔵 Immediate Support
$63,500
As long as BTC holds above this level, bulls remain in control of the short-term structure.
🔴 Major Demand Zone
$61,300 – $60,250
If sellers gain control and price loses $63.5K, this area becomes the next important support where buyers may step back in.
🟠 Strong Weekly Support
$58,858
This is the strongest support visible on the chart. If panic selling occurs, this zone could provide a high-probability reaction.
📈 Bullish Scenario
✔ Hold above $63.5K
✔ Break above $66.3K
🎯 Targets:
• $68K
• $69K
Momentum confirmation only comes after a daily close above resistance.
📉 Bearish Scenario
If BTC loses $63.5K, expect liquidity to be collected below support first.
Possible downside targets:
🎯 $61.3K
🎯 $60.2K
🎯 $58.8K
This scenario also aligns with today's liquidity positioning shown in the market data sheet.
💡 Market Sentiment
RSI remains neutral around 54, leaving room for movement in either direction.Volatility is still relatively low, which often precedes a larger breakout.Positive funding rate suggests many traders remain long, increasing the possibility of a liquidity sweep before the next sustained move.Bitcoin Spot ETF data shows a modest daily inflow, while the weekly flow remains negative, reflecting mixed institutional sentiment.
📌 Final View
Bitcoin is still ranging, not trending.
The safest approach is to wait for confirmation instead of predicting direction.
Above $66.3K → Bullish continuation
Below $63.5K → Correction toward $61K–$60K becomes more likely
Always manage risk and avoid chasing candles inside the range.
💬 What do you think?
Do you expect BTC to break above $66.3K first, or will it sweep the $61K-$60K liquidity zone before the next rally? 📊
Share your analysis in the comments! 👇
If you enjoy data-driven Bitcoin analysis, follow my profile for daily market updates, technical analysis, and high-probability trading insights. 🚀
⚠️ Not Financial Advice (NFA). Always Do Your Own Research (DYOR).
#PriceActionAnalysis #SupportResistance #BitcoinAnalysis #MarketUpdate #dyor
122

Article
Bitcoin at a Decision Zone: Breakout or Sharp Rejection? | BTC Daily Outlook (July 15)$BTC
{future}(BTCUSDT)
Bitcoin is trading around $64,500 and has reached a critical resistance area between $64.8K–$66.3K. Based on the daily chart, price continues to respect a range structure while making higher lows, but strong overhead resistance is limiting bullish momentum.
The broader trend is still mixed. Buyers remain active above the $60.2K–$61.3K demand zone, yet sellers continue defending the upper range. According to the market data, BTC also faces a higher probability of testing the downside liquidity near $63.5K before attempting another move higher.
A decisive daily close above $66,325 could trigger fresh bullish momentum toward the $68K–$69K region. However, failure to break resistance may lead to another rejection, with price revisiting the $63.5K, $61.3K, and potentially $60.2K support levels.
Volume remains relatively moderate, suggesting that traders should wait for confirmation instead of chasing candles. RSI is around 54, indicating neutral momentum with room for movement in either direction.
📊 Trade Setup (Scalp/Intraday)
Exchange: Binance
Pair: BTC/USDT
Trade Type: SHORT (Preferred while below resistance)
Entry Zone:
$64,800 – $65,200
Take Profit Targets:
🎯 TP1: $64,000🎯 TP2: $63,530🎯 TP3: $61,300
Stop Loss:
❌ $66,450
Leverage:
10x–20x (Use proper risk management)
Confidence:
72%
Risk/Reward:
1:2.5
📈 Bullish Scenario
If BTC closes above $66,325 with strong volume, the bearish setup becomes invalid. In that case, buyers could target $68,000 followed by $69,000+.
🔍 Key Technical Highlights
✅ Daily structure remains range-bound.✅ Strong resistance at $66.3K.✅ Major support at $63.5K, $61.3K, and $60.2K.✅ RSI remains neutral around 54.✅ Volatility expansion is expected near resistance.
⚠️ Risk Disclaimer
This analysis is for educational purposes only and should not be considered financial advice. Always manage your risk and wait for confirmation before entering any trade.
Follow for daily BTC analysis, high-probability trade setups, and real-time market insights. 🚀
#bitcoin #BTCUSDTAnalysis #BinanceSquareTalks #CryptoTradingInsights #PriceActionAnalysis
Bitcoin at a Decision Zone: Breakout or Sharp Rejection? | BTC Daily Outlook (July 15)
$BTC
Bitcoin is trading around $64,500 and has reached a critical resistance area between $64.8K–$66.3K. Based on the daily chart, price continues to respect a range structure while making higher lows, but strong overhead resistance is limiting bullish momentum.
The broader trend is still mixed. Buyers remain active above the $60.2K–$61.3K demand zone, yet sellers continue defending the upper range. According to the market data, BTC also faces a higher probability of testing the downside liquidity near $63.5K before attempting another move higher.
A decisive daily close above $66,325 could trigger fresh bullish momentum toward the $68K–$69K region. However, failure to break resistance may lead to another rejection, with price revisiting the $63.5K, $61.3K, and potentially $60.2K support levels.
Volume remains relatively moderate, suggesting that traders should wait for confirmation instead of chasing candles. RSI is around 54, indicating neutral momentum with room for movement in either direction.
📊 Trade Setup (Scalp/Intraday)
Exchange: Binance
Pair: BTC/USDT
Trade Type: SHORT (Preferred while below resistance)
Entry Zone:
$64,800 – $65,200
Take Profit Targets:
🎯 TP1: $64,000🎯 TP2: $63,530🎯 TP3: $61,300
Stop Loss:
❌ $66,450
Leverage:
10x–20x (Use proper risk management)
Confidence:
72%
Risk/Reward:
1:2.5
📈 Bullish Scenario
If BTC closes above $66,325 with strong volume, the bearish setup becomes invalid. In that case, buyers could target $68,000 followed by $69,000+.
🔍 Key Technical Highlights
✅ Daily structure remains range-bound.✅ Strong resistance at $66.3K.✅ Major support at $63.5K, $61.3K, and $60.2K.✅ RSI remains neutral around 54.✅ Volatility expansion is expected near resistance.
⚠️ Risk Disclaimer
This analysis is for educational purposes only and should not be considered financial advice. Always manage your risk and wait for confirmation before entering any trade.
Follow for daily BTC analysis, high-probability trade setups, and real-time market insights. 🚀
#bitcoin #BTCUSDTAnalysis #BinanceSquareTalks #CryptoTradingInsights #PriceActionAnalysis
Bitcoin is trading around $64,500 and has reached a critical resistance area between $64.8K–$66.3K. Based on the daily chart, price continues to respect a range structure while making higher lows, but strong overhead resistance is limiting bullish momentum.
The broader trend is still mixed. Buyers remain active above the $60.2K–$61.3K demand zone, yet sellers continue defending the upper range. According to the market data, BTC also faces a higher probability of testing the downside liquidity near $63.5K before attempting another move higher.
A decisive daily close above $66,325 could trigger fresh bullish momentum toward the $68K–$69K region. However, failure to break resistance may lead to another rejection, with price revisiting the $63.5K, $61.3K, and potentially $60.2K support levels.
Volume remains relatively moderate, suggesting that traders should wait for confirmation instead of chasing candles. RSI is around 54, indicating neutral momentum with room for movement in either direction.
📊 Trade Setup (Scalp/Intraday)
Exchange: Binance
Pair: BTC/USDT
Trade Type: SHORT (Preferred while below resistance)
Entry Zone:
$64,800 – $65,200
Take Profit Targets:
🎯 TP1: $64,000🎯 TP2: $63,530🎯 TP3: $61,300
Stop Loss:
❌ $66,450
Leverage:
10x–20x (Use proper risk management)
Confidence:
72%
Risk/Reward:
1:2.5
📈 Bullish Scenario
If BTC closes above $66,325 with strong volume, the bearish setup becomes invalid. In that case, buyers could target $68,000 followed by $69,000+.
🔍 Key Technical Highlights
✅ Daily structure remains range-bound.✅ Strong resistance at $66.3K.✅ Major support at $63.5K, $61.3K, and $60.2K.✅ RSI remains neutral around 54.✅ Volatility expansion is expected near resistance.
⚠️ Risk Disclaimer
This analysis is for educational purposes only and should not be considered financial advice. Always manage your risk and wait for confirmation before entering any trade.
Follow for daily BTC analysis, high-probability trade setups, and real-time market insights. 🚀
#bitcoin #BTCUSDTAnalysis #BinanceSquareTalks #CryptoTradingInsights #PriceActionAnalysis
127

Article
Bitcoin at a Decision Point: Will BTC Hold $61.3K or Break Lower Today?$BTC
{future}(BTCUSDT)
Bitcoin is trading around $62.6K, but today's price action suggests the market is entering a critical decision zone. After failing to reclaim the $63.5K resistance, sellers stepped back into the market, increasing the chances of another test of lower support before the next major move.
According to the chart, BTC remains inside a broad consolidation range between $60.2K and $66.3K. Price is currently hovering just above the $61.3K support, which is the most important level to watch today. A successful defense here could trigger another recovery toward $63.5K and possibly $64.8K. However, if this level breaks with strong volume, the next downside target could quickly extend toward $60.2K, while a deeper correction may reach the $58.8K demand zone.
The daily RSI is around 47, indicating neutral-to-bearish momentum. Buyers are losing strength, but the market is not yet oversold, leaving room for another move in either direction.
Market sentiment remains mixed. ETF flows have recently slowed, while overall crypto market structure is still considered bullish despite short-term weakness. As long as Bitcoin stays above the major support region, the broader trend remains intact, but traders should expect increased volatility around today's key levels.
Today's Key Levels
Resistance 1: $63,500Resistance 2: $64,800Major Resistance: $66,325Support 1: $61,288Support 2: $60,251Major Support: $58,858
📈 Trade Signal (Long Setup)
Exchange: Binance
Pair: BTC/USDT Perpetual
Direction: LONG (Support Bounce)
Entry Zone: $61,350 – $61,550
Leverage: 10x–20x
Take Profit Targets:
🎯 TP1: $62,450🎯 TP2: $63,500🎯 TP3: $64,700
Stop Loss: $60,950
Risk/Reward: 1:2.5
Confidence: 68%
Why This Trade?
✅ Price is approaching a strong daily support zone.✅ RSI is neutral, leaving room for a bullish recovery.✅ Overall higher-timeframe market structure remains bullish.✅ A bounce from support could trigger short covering toward $63.5K.
Invalidation: A daily close below $61.2K increases the probability of a move toward $60.2K and possibly $58.8K.
Conclusion
Bitcoin is sitting at one of the most important support areas of the week. Bulls need to defend $61.3K to maintain the current structure. If buyers step in, a recovery toward $63.5K–$64.8K is likely. If support fails, expect increased selling pressure toward the lower demand zone. Manage risk carefully and wait for confirmation before entering a position.
#btcusdtechnicalanalysis #BitcoinAnalysis #MagoCripto #BuyTheDip #TradingLife #BinanceSquare #Write2Earn #TradingSetup #CryptoSignalsToday #BinanceSquareTalks $BNB
Bitcoin at a Decision Point: Will BTC Hold $61.3K or Break Lower Today?
$BTC
Bitcoin is trading around $62.6K, but today's price action suggests the market is entering a critical decision zone. After failing to reclaim the $63.5K resistance, sellers stepped back into the market, increasing the chances of another test of lower support before the next major move.
According to the chart, BTC remains inside a broad consolidation range between $60.2K and $66.3K. Price is currently hovering just above the $61.3K support, which is the most important level to watch today. A successful defense here could trigger another recovery toward $63.5K and possibly $64.8K. However, if this level breaks with strong volume, the next downside target could quickly extend toward $60.2K, while a deeper correction may reach the $58.8K demand zone.
The daily RSI is around 47, indicating neutral-to-bearish momentum. Buyers are losing strength, but the market is not yet oversold, leaving room for another move in either direction.
Market sentiment remains mixed. ETF flows have recently slowed, while overall crypto market structure is still considered bullish despite short-term weakness. As long as Bitcoin stays above the major support region, the broader trend remains intact, but traders should expect increased volatility around today's key levels.
Today's Key Levels
Resistance 1: $63,500Resistance 2: $64,800Major Resistance: $66,325Support 1: $61,288Support 2: $60,251Major Support: $58,858
📈 Trade Signal (Long Setup)
Exchange: Binance
Pair: BTC/USDT Perpetual
Direction: LONG (Support Bounce)
Entry Zone: $61,350 – $61,550
Leverage: 10x–20x
Take Profit Targets:
🎯 TP1: $62,450🎯 TP2: $63,500🎯 TP3: $64,700
Stop Loss: $60,950
Risk/Reward: 1:2.5
Confidence: 68%
Why This Trade?
✅ Price is approaching a strong daily support zone.✅ RSI is neutral, leaving room for a bullish recovery.✅ Overall higher-timeframe market structure remains bullish.✅ A bounce from support could trigger short covering toward $63.5K.
Invalidation: A daily close below $61.2K increases the probability of a move toward $60.2K and possibly $58.8K.
Conclusion
Bitcoin is sitting at one of the most important support areas of the week. Bulls need to defend $61.3K to maintain the current structure. If buyers step in, a recovery toward $63.5K–$64.8K is likely. If support fails, expect increased selling pressure toward the lower demand zone. Manage risk carefully and wait for confirmation before entering a position.
#btcusdtechnicalanalysis #BitcoinAnalysis #MagoCripto #BuyTheDip #TradingLife #BinanceSquare #Write2Earn #TradingSetup #CryptoSignalsToday #BinanceSquareTalks $BNB
Bitcoin is trading around $62.6K, but today's price action suggests the market is entering a critical decision zone. After failing to reclaim the $63.5K resistance, sellers stepped back into the market, increasing the chances of another test of lower support before the next major move.
According to the chart, BTC remains inside a broad consolidation range between $60.2K and $66.3K. Price is currently hovering just above the $61.3K support, which is the most important level to watch today. A successful defense here could trigger another recovery toward $63.5K and possibly $64.8K. However, if this level breaks with strong volume, the next downside target could quickly extend toward $60.2K, while a deeper correction may reach the $58.8K demand zone.
The daily RSI is around 47, indicating neutral-to-bearish momentum. Buyers are losing strength, but the market is not yet oversold, leaving room for another move in either direction.
Market sentiment remains mixed. ETF flows have recently slowed, while overall crypto market structure is still considered bullish despite short-term weakness. As long as Bitcoin stays above the major support region, the broader trend remains intact, but traders should expect increased volatility around today's key levels.
Today's Key Levels
Resistance 1: $63,500Resistance 2: $64,800Major Resistance: $66,325Support 1: $61,288Support 2: $60,251Major Support: $58,858
📈 Trade Signal (Long Setup)
Exchange: Binance
Pair: BTC/USDT Perpetual
Direction: LONG (Support Bounce)
Entry Zone: $61,350 – $61,550
Leverage: 10x–20x
Take Profit Targets:
🎯 TP1: $62,450🎯 TP2: $63,500🎯 TP3: $64,700
Stop Loss: $60,950
Risk/Reward: 1:2.5
Confidence: 68%
Why This Trade?
✅ Price is approaching a strong daily support zone.✅ RSI is neutral, leaving room for a bullish recovery.✅ Overall higher-timeframe market structure remains bullish.✅ A bounce from support could trigger short covering toward $63.5K.
Invalidation: A daily close below $61.2K increases the probability of a move toward $60.2K and possibly $58.8K.
Conclusion
Bitcoin is sitting at one of the most important support areas of the week. Bulls need to defend $61.3K to maintain the current structure. If buyers step in, a recovery toward $63.5K–$64.8K is likely. If support fails, expect increased selling pressure toward the lower demand zone. Manage risk carefully and wait for confirmation before entering a position.
#btcusdtechnicalanalysis #BitcoinAnalysis #MagoCripto #BuyTheDip #TradingLife #BinanceSquare #Write2Earn #TradingSetup #CryptoSignalsToday #BinanceSquareTalks $BNB
91

Article
Bitcoin at a Decision Point: Will BTC Hold Support or Trigger a Bigger Drop?$BTC
{spot}(BTCUSDT)
Bitcoin is trading around $62.8K, and today's price action is taking place at a critical support zone. The daily chart shows BTC struggling to stay above $62,700-$63,000, while sellers continue to defend the $63,500-$64,000 resistance area. The market remains range-bound, but the next breakout or breakdown could define this week's direction.
From the technical perspective, BTC is printing lower highs after multiple failed attempts to reclaim the resistance zone. RSI on the daily timeframe is hovering near 48, reflecting neutral-to-bearish momentum. Volume has also declined, suggesting traders are waiting for confirmation before entering large positions.
The broader crypto market still maintains an overall bullish structure, but short-term momentum has weakened. If Bitcoin loses the current support, a deeper retracement toward the next liquidity zone becomes increasingly likely.
Technical Outlook
Immediate Resistance: $63,500Major Resistance: $66,325Immediate Support: $61,287Major Support: $60,251Strong Demand Zone: $58,858
A daily close below $62,700 would increase bearish pressure and could push BTC toward $61.3K and possibly $60.2K. However, if buyers reclaim $63.5K, momentum may quickly shift back toward $64.8K-$66.3K.
📈 Trade Signal (Intraday)
Exchange: Binance
Pair: BTC/USDT
Setup: SHORT ⚠️
Entry Zone: $62,850 – $63,150
Leverage: 10x–20x
Take Profit Targets:
🎯 TP1: $62,200🎯 TP2: $61,350🎯 TP3: $60,300
Stop Loss: $63,700
Confidence: 68%
Risk/Reward: 1:2.6
Why This Setup?
✅ Lower-high structure remains intact. ✅ Daily RSI below 50 shows weakening momentum. ✅ Strong resistance near $63.5K. ✅ Volume remains relatively weak during recent rebounds. ✅ Breakdown below support could accelerate selling pressure.
Bullish Scenario
If BTC closes above $63,500 with strong buying volume, the bearish setup becomes invalid. In that case, buyers could target $64,800 followed by $66,300.
Risk Management
This week could remain highly volatile due to macroeconomic news and liquidity movements. Never risk more than 1–2% of your trading capital on a single position, and always wait for confirmation before entering.
Follow for daily BTC analysis, high-probability trade setups, and real-time market insights!
#BitcoinDunyamiz #BTC走势分析 #CryptoTradingInsights #BinanceSquareTalks #btcusdtechnicalanalysis $BNB
{spot}(BNBUSDT)
Bitcoin at a Decision Point: Will BTC Hold Support or Trigger a Bigger Drop?
$BTC
Bitcoin is trading around $62.8K, and today's price action is taking place at a critical support zone. The daily chart shows BTC struggling to stay above $62,700-$63,000, while sellers continue to defend the $63,500-$64,000 resistance area. The market remains range-bound, but the next breakout or breakdown could define this week's direction.
From the technical perspective, BTC is printing lower highs after multiple failed attempts to reclaim the resistance zone. RSI on the daily timeframe is hovering near 48, reflecting neutral-to-bearish momentum. Volume has also declined, suggesting traders are waiting for confirmation before entering large positions.
The broader crypto market still maintains an overall bullish structure, but short-term momentum has weakened. If Bitcoin loses the current support, a deeper retracement toward the next liquidity zone becomes increasingly likely.
Technical Outlook
Immediate Resistance: $63,500Major Resistance: $66,325Immediate Support: $61,287Major Support: $60,251Strong Demand Zone: $58,858
A daily close below $62,700 would increase bearish pressure and could push BTC toward $61.3K and possibly $60.2K. However, if buyers reclaim $63.5K, momentum may quickly shift back toward $64.8K-$66.3K.
📈 Trade Signal (Intraday)
Exchange: Binance
Pair: BTC/USDT
Setup: SHORT ⚠️
Entry Zone: $62,850 – $63,150
Leverage: 10x–20x
Take Profit Targets:
🎯 TP1: $62,200🎯 TP2: $61,350🎯 TP3: $60,300
Stop Loss: $63,700
Confidence: 68%
Risk/Reward: 1:2.6
Why This Setup?
✅ Lower-high structure remains intact. ✅ Daily RSI below 50 shows weakening momentum. ✅ Strong resistance near $63.5K. ✅ Volume remains relatively weak during recent rebounds. ✅ Breakdown below support could accelerate selling pressure.
Bullish Scenario
If BTC closes above $63,500 with strong buying volume, the bearish setup becomes invalid. In that case, buyers could target $64,800 followed by $66,300.
Risk Management
This week could remain highly volatile due to macroeconomic news and liquidity movements. Never risk more than 1–2% of your trading capital on a single position, and always wait for confirmation before entering.
Follow for daily BTC analysis, high-probability trade setups, and real-time market insights!
#BitcoinDunyamiz #BTC走势分析 #CryptoTradingInsights #BinanceSquareTalks #btcusdtechnicalanalysis $BNB
Bitcoin is trading around $62.8K, and today's price action is taking place at a critical support zone. The daily chart shows BTC struggling to stay above $62,700-$63,000, while sellers continue to defend the $63,500-$64,000 resistance area. The market remains range-bound, but the next breakout or breakdown could define this week's direction.
From the technical perspective, BTC is printing lower highs after multiple failed attempts to reclaim the resistance zone. RSI on the daily timeframe is hovering near 48, reflecting neutral-to-bearish momentum. Volume has also declined, suggesting traders are waiting for confirmation before entering large positions.
The broader crypto market still maintains an overall bullish structure, but short-term momentum has weakened. If Bitcoin loses the current support, a deeper retracement toward the next liquidity zone becomes increasingly likely.
Technical Outlook
Immediate Resistance: $63,500Major Resistance: $66,325Immediate Support: $61,287Major Support: $60,251Strong Demand Zone: $58,858
A daily close below $62,700 would increase bearish pressure and could push BTC toward $61.3K and possibly $60.2K. However, if buyers reclaim $63.5K, momentum may quickly shift back toward $64.8K-$66.3K.
📈 Trade Signal (Intraday)
Exchange: Binance
Pair: BTC/USDT
Setup: SHORT ⚠️
Entry Zone: $62,850 – $63,150
Leverage: 10x–20x
Take Profit Targets:
🎯 TP1: $62,200🎯 TP2: $61,350🎯 TP3: $60,300
Stop Loss: $63,700
Confidence: 68%
Risk/Reward: 1:2.6
Why This Setup?
✅ Lower-high structure remains intact. ✅ Daily RSI below 50 shows weakening momentum. ✅ Strong resistance near $63.5K. ✅ Volume remains relatively weak during recent rebounds. ✅ Breakdown below support could accelerate selling pressure.
Bullish Scenario
If BTC closes above $63,500 with strong buying volume, the bearish setup becomes invalid. In that case, buyers could target $64,800 followed by $66,300.
Risk Management
This week could remain highly volatile due to macroeconomic news and liquidity movements. Never risk more than 1–2% of your trading capital on a single position, and always wait for confirmation before entering.
Follow for daily BTC analysis, high-probability trade setups, and real-time market insights!
#BitcoinDunyamiz #BTC走势分析 #CryptoTradingInsights #BinanceSquareTalks #btcusdtechnicalanalysis $BNB
125

Article
BTC at a Decision Zone: Breakout or Sharp Rejection? | July 12 Market Outlook$BTC
{spot}(BTCUSDT)
Bitcoin is trading around $64.1K, sitting just below a key resistance zone after recovering from recent lows. The market is showing signs of strength, but price is still trapped beneath a major supply area. Today's move will likely decide whether BTC pushes toward $66K+ or faces another correction toward lower support.
Market Overview
BTC has printed a series of higher lows, indicating buyers are gradually gaining control. RSI is hovering near 53-54, suggesting neutral momentum with room for another upside move. However, the overall higher-timeframe trend remains cautious, meaning traders should wait for confirmation before chasing price.
The important levels visible on the chart are:
Immediate Resistance: $64,800 - $65,000Major Resistance: $66,325Support Zone: $63,500Strong Support: $61,287Invalidation Level: Below $60,250
A daily close above $64.8K-$65K could trigger momentum toward $66.3K, while rejection from current levels may send BTC back to retest $63.5K before deciding the next trend.
📈 Trade Signal (Scalp Long)
Exchange: Binance
Pair: BTC/USDT
Trade Setup: LONG (Only after confirmation)
Entry: $63,850 – $64,100
Leverage: 10x–20x
Take Profit Targets:
🎯 TP1: $64,800🎯 TP2: $65,500🎯 TP3: $66,300
Stop Loss:
❌ $63,300
Confidence: 68%
Risk/Reward: 1:2.5
Technical Reasons
✅ Price continues to form higher lows.
✅ RSI remains above 50, supporting bullish momentum.
✅ Buyers are defending the $63.5K support region.
✅ Break above $64.8K could accelerate buying toward $66K.
Bearish Scenario
If BTC loses $63.5K, sellers may regain control, opening the door for a move toward $61.3K. A break below that support would increase the probability of testing the $60.2K region.
Final Thoughts
Bitcoin is approaching one of the week's most important resistance levels. Bulls still have the advantage as long as price remains above $63.5K, but confirmation is essential before entering aggressive long positions. Watch today's daily close carefully—it could define the market's direction for the coming sessions.
⚠️ Disclaimer: This analysis is for educational purposes only and is not financial advice. Always use proper risk management and do your own research before entering any trade.
#Bitcoin #BTC #CryptoTradingSignalsAnysis #BinanceSquareTalks #BTCUSDTAnalysis
BTC at a Decision Zone: Breakout or Sharp Rejection? | July 12 Market Outlook
$BTC
Bitcoin is trading around $64.1K, sitting just below a key resistance zone after recovering from recent lows. The market is showing signs of strength, but price is still trapped beneath a major supply area. Today's move will likely decide whether BTC pushes toward $66K+ or faces another correction toward lower support.
Market Overview
BTC has printed a series of higher lows, indicating buyers are gradually gaining control. RSI is hovering near 53-54, suggesting neutral momentum with room for another upside move. However, the overall higher-timeframe trend remains cautious, meaning traders should wait for confirmation before chasing price.
The important levels visible on the chart are:
Immediate Resistance: $64,800 - $65,000Major Resistance: $66,325Support Zone: $63,500Strong Support: $61,287Invalidation Level: Below $60,250
A daily close above $64.8K-$65K could trigger momentum toward $66.3K, while rejection from current levels may send BTC back to retest $63.5K before deciding the next trend.
📈 Trade Signal (Scalp Long)
Exchange: Binance
Pair: BTC/USDT
Trade Setup: LONG (Only after confirmation)
Entry: $63,850 – $64,100
Leverage: 10x–20x
Take Profit Targets:
🎯 TP1: $64,800🎯 TP2: $65,500🎯 TP3: $66,300
Stop Loss:
❌ $63,300
Confidence: 68%
Risk/Reward: 1:2.5
Technical Reasons
✅ Price continues to form higher lows.
✅ RSI remains above 50, supporting bullish momentum.
✅ Buyers are defending the $63.5K support region.
✅ Break above $64.8K could accelerate buying toward $66K.
Bearish Scenario
If BTC loses $63.5K, sellers may regain control, opening the door for a move toward $61.3K. A break below that support would increase the probability of testing the $60.2K region.
Final Thoughts
Bitcoin is approaching one of the week's most important resistance levels. Bulls still have the advantage as long as price remains above $63.5K, but confirmation is essential before entering aggressive long positions. Watch today's daily close carefully—it could define the market's direction for the coming sessions.
⚠️ Disclaimer: This analysis is for educational purposes only and is not financial advice. Always use proper risk management and do your own research before entering any trade.
#Bitcoin #BTC #CryptoTradingSignalsAnysis #BinanceSquareTalks #BTCUSDTAnalysis
Bitcoin is trading around $64.1K, sitting just below a key resistance zone after recovering from recent lows. The market is showing signs of strength, but price is still trapped beneath a major supply area. Today's move will likely decide whether BTC pushes toward $66K+ or faces another correction toward lower support.
Market Overview
BTC has printed a series of higher lows, indicating buyers are gradually gaining control. RSI is hovering near 53-54, suggesting neutral momentum with room for another upside move. However, the overall higher-timeframe trend remains cautious, meaning traders should wait for confirmation before chasing price.
The important levels visible on the chart are:
Immediate Resistance: $64,800 - $65,000Major Resistance: $66,325Support Zone: $63,500Strong Support: $61,287Invalidation Level: Below $60,250
A daily close above $64.8K-$65K could trigger momentum toward $66.3K, while rejection from current levels may send BTC back to retest $63.5K before deciding the next trend.
📈 Trade Signal (Scalp Long)
Exchange: Binance
Pair: BTC/USDT
Trade Setup: LONG (Only after confirmation)
Entry: $63,850 – $64,100
Leverage: 10x–20x
Take Profit Targets:
🎯 TP1: $64,800🎯 TP2: $65,500🎯 TP3: $66,300
Stop Loss:
❌ $63,300
Confidence: 68%
Risk/Reward: 1:2.5
Technical Reasons
✅ Price continues to form higher lows.
✅ RSI remains above 50, supporting bullish momentum.
✅ Buyers are defending the $63.5K support region.
✅ Break above $64.8K could accelerate buying toward $66K.
Bearish Scenario
If BTC loses $63.5K, sellers may regain control, opening the door for a move toward $61.3K. A break below that support would increase the probability of testing the $60.2K region.
Final Thoughts
Bitcoin is approaching one of the week's most important resistance levels. Bulls still have the advantage as long as price remains above $63.5K, but confirmation is essential before entering aggressive long positions. Watch today's daily close carefully—it could define the market's direction for the coming sessions.
⚠️ Disclaimer: This analysis is for educational purposes only and is not financial advice. Always use proper risk management and do your own research before entering any trade.
#Bitcoin #BTC #CryptoTradingSignalsAnysis #BinanceSquareTalks #BTCUSDTAnalysis
166

Article
Bitcoin at a Decision Point: Will BTC Reclaim $65K or Drop Toward $63.5K First?$BTC
{spot}(BTCUSDT)
Bitcoin is trading around $64,064, and today's market structure suggests that volatility is likely to increase over the next few hours. Although BTC posted a bullish daily candle and spot ETF inflows remain positive, the broader crypto market is still technically in a downtrend, meaning traders should remain disciplined and avoid chasing impulsive moves.
One of the strongest bullish factors today is the continued institutional demand. US Bitcoin Spot ETFs recorded positive net inflows, while the total crypto market cap climbed back to $2.20 trillion, showing that fresh capital is still entering the market. At the same time, Bitcoin dominance is weakening, which could eventually support altcoins if BTC remains stable above key support.
However, traders should also pay attention to the liquidation heatmap. The data indicates a 75% probability that Bitcoin could sweep the $63,498 liquidity zone before attempting a stronger recovery. This means a temporary downside move cannot be ruled out even if the medium-term outlook remains constructive.
Momentum indicators are mixed. The Daily RSI is near 53, while the 4H RSI remains close to 59, suggesting buyers still have some control but without strong momentum. Funding rates remain positive, showing that long positions dominate the market. If too many traders become overleveraged on the long side, a quick liquidity sweep is possible before the next bullish expansion.
📊 Trade Signal (Educational Only)
Exchange: Binance Pair: BTC/USDT Trade Setup: Long (Buy the Dip)
Entry Zone: $63,550 – $63,750
Take Profit Targets:
TP1: $64,450TP2: $64,850TP3: $65,300
Stop Loss: $63,200
Leverage: 10x–20x (Use proper risk management)
Risk/Reward: Approximately 1:2.5
Confidence: 68%
Key Reasons Behind This Setup
✅ Positive Bitcoin Spot ETF inflows continue.
✅ Daily candle remains bullish despite overall market weakness.
✅ RSI is recovering from neutral levels.
✅ Strong liquidity sits below current price, making a sweep-and-reversal scenario possible.
✅ A reclaim above $64,500 could open the path toward $65K+.
Final Outlook
Today's market favors patient traders rather than aggressive entries. If Bitcoin revisits the $63.5K-$63.7K support zone and buyers defend it, the probability of a recovery toward $65K increases significantly. However, losing $63.2K would invalidate the bullish setup and could expose BTC to deeper downside.
Always wait for confirmation before entering a trade, manage your risk carefully, and never risk more than you can afford to lose.
Follow for daily BTC analysis, high-probability trade setups, and market insights!
#bitcoin #BTC #CryptoTradingInsights #BinanceSquareTalks #btcusdtechnicalanalysis
Bitcoin at a Decision Point: Will BTC Reclaim $65K or Drop Toward $63.5K First?
$BTC
Bitcoin is trading around $64,064, and today's market structure suggests that volatility is likely to increase over the next few hours. Although BTC posted a bullish daily candle and spot ETF inflows remain positive, the broader crypto market is still technically in a downtrend, meaning traders should remain disciplined and avoid chasing impulsive moves.
One of the strongest bullish factors today is the continued institutional demand. US Bitcoin Spot ETFs recorded positive net inflows, while the total crypto market cap climbed back to $2.20 trillion, showing that fresh capital is still entering the market. At the same time, Bitcoin dominance is weakening, which could eventually support altcoins if BTC remains stable above key support.
However, traders should also pay attention to the liquidation heatmap. The data indicates a 75% probability that Bitcoin could sweep the $63,498 liquidity zone before attempting a stronger recovery. This means a temporary downside move cannot be ruled out even if the medium-term outlook remains constructive.
Momentum indicators are mixed. The Daily RSI is near 53, while the 4H RSI remains close to 59, suggesting buyers still have some control but without strong momentum. Funding rates remain positive, showing that long positions dominate the market. If too many traders become overleveraged on the long side, a quick liquidity sweep is possible before the next bullish expansion.
📊 Trade Signal (Educational Only)
Exchange: Binance Pair: BTC/USDT Trade Setup: Long (Buy the Dip)
Entry Zone: $63,550 – $63,750
Take Profit Targets:
TP1: $64,450TP2: $64,850TP3: $65,300
Stop Loss: $63,200
Leverage: 10x–20x (Use proper risk management)
Risk/Reward: Approximately 1:2.5
Confidence: 68%
Key Reasons Behind This Setup
✅ Positive Bitcoin Spot ETF inflows continue.
✅ Daily candle remains bullish despite overall market weakness.
✅ RSI is recovering from neutral levels.
✅ Strong liquidity sits below current price, making a sweep-and-reversal scenario possible.
✅ A reclaim above $64,500 could open the path toward $65K+.
Final Outlook
Today's market favors patient traders rather than aggressive entries. If Bitcoin revisits the $63.5K-$63.7K support zone and buyers defend it, the probability of a recovery toward $65K increases significantly. However, losing $63.2K would invalidate the bullish setup and could expose BTC to deeper downside.
Always wait for confirmation before entering a trade, manage your risk carefully, and never risk more than you can afford to lose.
Follow for daily BTC analysis, high-probability trade setups, and market insights!
#bitcoin #BTC #CryptoTradingInsights #BinanceSquareTalks #btcusdtechnicalanalysis
Bitcoin is trading around $64,064, and today's market structure suggests that volatility is likely to increase over the next few hours. Although BTC posted a bullish daily candle and spot ETF inflows remain positive, the broader crypto market is still technically in a downtrend, meaning traders should remain disciplined and avoid chasing impulsive moves.
One of the strongest bullish factors today is the continued institutional demand. US Bitcoin Spot ETFs recorded positive net inflows, while the total crypto market cap climbed back to $2.20 trillion, showing that fresh capital is still entering the market. At the same time, Bitcoin dominance is weakening, which could eventually support altcoins if BTC remains stable above key support.
However, traders should also pay attention to the liquidation heatmap. The data indicates a 75% probability that Bitcoin could sweep the $63,498 liquidity zone before attempting a stronger recovery. This means a temporary downside move cannot be ruled out even if the medium-term outlook remains constructive.
Momentum indicators are mixed. The Daily RSI is near 53, while the 4H RSI remains close to 59, suggesting buyers still have some control but without strong momentum. Funding rates remain positive, showing that long positions dominate the market. If too many traders become overleveraged on the long side, a quick liquidity sweep is possible before the next bullish expansion.
📊 Trade Signal (Educational Only)
Exchange: Binance Pair: BTC/USDT Trade Setup: Long (Buy the Dip)
Entry Zone: $63,550 – $63,750
Take Profit Targets:
TP1: $64,450TP2: $64,850TP3: $65,300
Stop Loss: $63,200
Leverage: 10x–20x (Use proper risk management)
Risk/Reward: Approximately 1:2.5
Confidence: 68%
Key Reasons Behind This Setup
✅ Positive Bitcoin Spot ETF inflows continue.
✅ Daily candle remains bullish despite overall market weakness.
✅ RSI is recovering from neutral levels.
✅ Strong liquidity sits below current price, making a sweep-and-reversal scenario possible.
✅ A reclaim above $64,500 could open the path toward $65K+.
Final Outlook
Today's market favors patient traders rather than aggressive entries. If Bitcoin revisits the $63.5K-$63.7K support zone and buyers defend it, the probability of a recovery toward $65K increases significantly. However, losing $63.2K would invalidate the bullish setup and could expose BTC to deeper downside.
Always wait for confirmation before entering a trade, manage your risk carefully, and never risk more than you can afford to lose.
Follow for daily BTC analysis, high-probability trade setups, and market insights!
#bitcoin #BTC #CryptoTradingInsights #BinanceSquareTalks #btcusdtechnicalanalysis
106

Article
Bitcoin at a Decision Zone: Breakout or Brutal Rejection? | BTC Daily Outlook (July 10)$BTC
{spot}(BTCUSDT)
Bitcoin is trading around $64,050, approaching one of the most important resistance zones on the daily timeframe. Buyers have managed to defend the $61.2K–$62.7K support region multiple times, but price is now testing the upper boundary of the current range.
From the chart, BTC remains inside a broader bearish market structure, although the recent recovery suggests short-term bullish momentum is building. The next 24 hours could determine whether Bitcoin pushes toward higher resistance or gets rejected back into the range.
📊 Technical Analysis
The daily chart shows BTC bouncing strongly after holding the $60.2K–$61.2K demand zone. Price is now trading above short-term support, but it is still facing heavy resistance near $64.5K–$66.3K.
Several technical factors stand out:
Buyers continue defending the $61K support area.RSI has recovered above 53, indicating improving momentum without entering overbought territory.Volume remains moderate, suggesting confirmation is still needed for a sustained breakout.The overall higher-timeframe trend is still cautious unless BTC closes decisively above $66.3K.
A daily candle closing above resistance could trigger fresh buying pressure, while rejection from current levels may send price back toward major support.
🎯 Key Levels
🟢 Support
$63,500$61,287$60,251
🔴 Resistance
$64,500$66,325$67,800
📈 Trade Signal (Binance)
Exchange: Binance
Pair: BTC/USDT
Trade Setup: LONG (Breakout Confirmation)
Entry Zone:
$63,900 – $64,200
Take Profit Targets:
🎯 TP1: $64,900🎯 TP2: $65,700🎯 TP3: $66,300
Stop Loss:
$63,200
Leverage:
10x–20x (Use proper risk management)
Risk/Reward:
1:2.4
Confidence:
68%
📉 Alternative Bearish Scenario
If BTC fails to break above $64.5K–$65K and prints a strong bearish rejection candle, sellers could regain control.
Potential downside targets:
$63,500$61,287$60,251
A breakdown below $60.2K would significantly increase bearish pressure and could open the path toward much lower liquidity zones.
💡 Trading Strategy
Patience is key here. Avoid chasing green candles directly into resistance. Wait for either:
✅ A confirmed breakout above resistance with strong volume.
OR
✅ A pullback toward support followed by a bullish confirmation candle.
Risk management remains the most important part of today's setup.
📢 Final Thoughts
Bitcoin is sitting at a critical technical level where volatility is likely to increase. Bulls are slowly regaining momentum, but the market still needs a decisive breakout above $66K to shift sentiment toward a stronger uptrend. Until then, expect sharp moves in both directions and trade with discipline.
⚠️ Disclaimer: This analysis is for educational purposes only and is not financial advice. Always do your own research (DYOR) and manage your risk before entering any trade.
👉 Follow for daily BTC analysis, high-probability trade setups, and real-time crypto market insights!
#BitcoinDunyamiz #BTC #CryptoTradingInsights #BinanceSquareFamily #BTCUSDTAnalysis
Bitcoin at a Decision Zone: Breakout or Brutal Rejection? | BTC Daily Outlook (July 10)
$BTC
Bitcoin is trading around $64,050, approaching one of the most important resistance zones on the daily timeframe. Buyers have managed to defend the $61.2K–$62.7K support region multiple times, but price is now testing the upper boundary of the current range.
From the chart, BTC remains inside a broader bearish market structure, although the recent recovery suggests short-term bullish momentum is building. The next 24 hours could determine whether Bitcoin pushes toward higher resistance or gets rejected back into the range.
📊 Technical Analysis
The daily chart shows BTC bouncing strongly after holding the $60.2K–$61.2K demand zone. Price is now trading above short-term support, but it is still facing heavy resistance near $64.5K–$66.3K.
Several technical factors stand out:
Buyers continue defending the $61K support area.RSI has recovered above 53, indicating improving momentum without entering overbought territory.Volume remains moderate, suggesting confirmation is still needed for a sustained breakout.The overall higher-timeframe trend is still cautious unless BTC closes decisively above $66.3K.
A daily candle closing above resistance could trigger fresh buying pressure, while rejection from current levels may send price back toward major support.
🎯 Key Levels
🟢 Support
$63,500$61,287$60,251
🔴 Resistance
$64,500$66,325$67,800
📈 Trade Signal (Binance)
Exchange: Binance
Pair: BTC/USDT
Trade Setup: LONG (Breakout Confirmation)
Entry Zone:
$63,900 – $64,200
Take Profit Targets:
🎯 TP1: $64,900🎯 TP2: $65,700🎯 TP3: $66,300
Stop Loss:
$63,200
Leverage:
10x–20x (Use proper risk management)
Risk/Reward:
1:2.4
Confidence:
68%
📉 Alternative Bearish Scenario
If BTC fails to break above $64.5K–$65K and prints a strong bearish rejection candle, sellers could regain control.
Potential downside targets:
$63,500$61,287$60,251
A breakdown below $60.2K would significantly increase bearish pressure and could open the path toward much lower liquidity zones.
💡 Trading Strategy
Patience is key here. Avoid chasing green candles directly into resistance. Wait for either:
✅ A confirmed breakout above resistance with strong volume.
OR
✅ A pullback toward support followed by a bullish confirmation candle.
Risk management remains the most important part of today's setup.
📢 Final Thoughts
Bitcoin is sitting at a critical technical level where volatility is likely to increase. Bulls are slowly regaining momentum, but the market still needs a decisive breakout above $66K to shift sentiment toward a stronger uptrend. Until then, expect sharp moves in both directions and trade with discipline.
⚠️ Disclaimer: This analysis is for educational purposes only and is not financial advice. Always do your own research (DYOR) and manage your risk before entering any trade.
👉 Follow for daily BTC analysis, high-probability trade setups, and real-time crypto market insights!
#BitcoinDunyamiz #BTC #CryptoTradingInsights #BinanceSquareFamily #BTCUSDTAnalysis
Bitcoin is trading around $64,050, approaching one of the most important resistance zones on the daily timeframe. Buyers have managed to defend the $61.2K–$62.7K support region multiple times, but price is now testing the upper boundary of the current range.
From the chart, BTC remains inside a broader bearish market structure, although the recent recovery suggests short-term bullish momentum is building. The next 24 hours could determine whether Bitcoin pushes toward higher resistance or gets rejected back into the range.
📊 Technical Analysis
The daily chart shows BTC bouncing strongly after holding the $60.2K–$61.2K demand zone. Price is now trading above short-term support, but it is still facing heavy resistance near $64.5K–$66.3K.
Several technical factors stand out:
Buyers continue defending the $61K support area.RSI has recovered above 53, indicating improving momentum without entering overbought territory.Volume remains moderate, suggesting confirmation is still needed for a sustained breakout.The overall higher-timeframe trend is still cautious unless BTC closes decisively above $66.3K.
A daily candle closing above resistance could trigger fresh buying pressure, while rejection from current levels may send price back toward major support.
🎯 Key Levels
🟢 Support
$63,500$61,287$60,251
🔴 Resistance
$64,500$66,325$67,800
📈 Trade Signal (Binance)
Exchange: Binance
Pair: BTC/USDT
Trade Setup: LONG (Breakout Confirmation)
Entry Zone:
$63,900 – $64,200
Take Profit Targets:
🎯 TP1: $64,900🎯 TP2: $65,700🎯 TP3: $66,300
Stop Loss:
$63,200
Leverage:
10x–20x (Use proper risk management)
Risk/Reward:
1:2.4
Confidence:
68%
📉 Alternative Bearish Scenario
If BTC fails to break above $64.5K–$65K and prints a strong bearish rejection candle, sellers could regain control.
Potential downside targets:
$63,500$61,287$60,251
A breakdown below $60.2K would significantly increase bearish pressure and could open the path toward much lower liquidity zones.
💡 Trading Strategy
Patience is key here. Avoid chasing green candles directly into resistance. Wait for either:
✅ A confirmed breakout above resistance with strong volume.
OR
✅ A pullback toward support followed by a bullish confirmation candle.
Risk management remains the most important part of today's setup.
📢 Final Thoughts
Bitcoin is sitting at a critical technical level where volatility is likely to increase. Bulls are slowly regaining momentum, but the market still needs a decisive breakout above $66K to shift sentiment toward a stronger uptrend. Until then, expect sharp moves in both directions and trade with discipline.
⚠️ Disclaimer: This analysis is for educational purposes only and is not financial advice. Always do your own research (DYOR) and manage your risk before entering any trade.
👉 Follow for daily BTC analysis, high-probability trade setups, and real-time crypto market insights!
#BitcoinDunyamiz #BTC #CryptoTradingInsights #BinanceSquareFamily #BTCUSDTAnalysis
73

Article
BTC at a Decision Zone: Will Bulls Hold $61K or Are Bears Targeting $58K?$BTC
{spot}(BTCUSDT)
Bitcoin is trading around $62,000 after another volatile session, and the market is approaching a critical decision point. Based on the daily chart, price remains trapped inside a consolidation range after a strong bearish impulse. Buyers have defended the $61,250–$61,400 support multiple times, but the inability to reclaim higher resistance suggests sellers are still in control.
The overall daily trend remains bearish, with lower highs continuing to form. However, short-term price action shows buyers attempting to build a base above support. As long as BTC holds above $61.2K, a relief bounce toward the next resistance zone remains possible. Losing this level, however, could trigger another sharp wave of selling.
The strongest resistance sits between $63,500 and $66,325. This zone has rejected price several times and is likely where bears will become aggressive again. A daily close above $63,500 would improve bullish momentum and increase the probability of a move toward $66,300–68,000.
On the downside, the key level to watch is $61,250. If sellers push below it with strong volume, the next downside targets become $60,250, followed by the major demand zone near $58,850. If panic selling accelerates, the broader support around $54,600 cannot be ruled out.
Volume remains relatively average, showing that neither side has full control yet. Meanwhile, RSI is hovering around 45, indicating neutral-to-bearish momentum without entering oversold territory. This means BTC still has room to move in either direction depending on market catalysts.
According to the market dashboard, overall crypto market sentiment remains cautious. Bitcoin dominance is weakening while the total crypto market trend still points downward. ETF flows are mixed, and liquidity conditions suggest volatility could increase over the coming sessions. Until Bitcoin breaks above resistance, traders should remain disciplined and avoid chasing candles.
📈 Trade Signal (Educational)
Exchange: Binance Pair: BTC/USDT Trade Setup: Long (Support Bounce)
Entry: $61,300 – $61,500Take Profit 1: $62,700Take Profit 2: $63,500Take Profit 3: $66,300Stop Loss: $60,900Leverage: 10x–20xRisk/Reward: Approximately 1:2.5Confidence: 68%
Alternative Scenario
If BTC closes below $61,250, bullish setups become invalid. In that case, traders should wait for bearish confirmation targeting $60,250 and $58,850.
Final Thoughts
Bitcoin is sitting at one of the most important support zones of the month. Bulls still have a chance to reclaim momentum, but they must defend the $61K region and break above $63.5K to shift sentiment. Until then, traders should remain patient, manage risk carefully, and wait for confirmation before entering positions.
⚠️ Disclaimer: This analysis is for educational purposes only and is not financial advice. Always do your own research (DYOR) and use proper risk management.
#BitcoinPriceUpdate #Btcsignal #CryptoTradingInsights #BinanceSquareTalks #BTCUSDTAnalysis $RWA
BTC at a Decision Zone: Will Bulls Hold $61K or Are Bears Targeting $58K?
$BTC
Bitcoin is trading around $62,000 after another volatile session, and the market is approaching a critical decision point. Based on the daily chart, price remains trapped inside a consolidation range after a strong bearish impulse. Buyers have defended the $61,250–$61,400 support multiple times, but the inability to reclaim higher resistance suggests sellers are still in control.
The overall daily trend remains bearish, with lower highs continuing to form. However, short-term price action shows buyers attempting to build a base above support. As long as BTC holds above $61.2K, a relief bounce toward the next resistance zone remains possible. Losing this level, however, could trigger another sharp wave of selling.
The strongest resistance sits between $63,500 and $66,325. This zone has rejected price several times and is likely where bears will become aggressive again. A daily close above $63,500 would improve bullish momentum and increase the probability of a move toward $66,300–68,000.
On the downside, the key level to watch is $61,250. If sellers push below it with strong volume, the next downside targets become $60,250, followed by the major demand zone near $58,850. If panic selling accelerates, the broader support around $54,600 cannot be ruled out.
Volume remains relatively average, showing that neither side has full control yet. Meanwhile, RSI is hovering around 45, indicating neutral-to-bearish momentum without entering oversold territory. This means BTC still has room to move in either direction depending on market catalysts.
According to the market dashboard, overall crypto market sentiment remains cautious. Bitcoin dominance is weakening while the total crypto market trend still points downward. ETF flows are mixed, and liquidity conditions suggest volatility could increase over the coming sessions. Until Bitcoin breaks above resistance, traders should remain disciplined and avoid chasing candles.
📈 Trade Signal (Educational)
Exchange: Binance Pair: BTC/USDT Trade Setup: Long (Support Bounce)
Entry: $61,300 – $61,500Take Profit 1: $62,700Take Profit 2: $63,500Take Profit 3: $66,300Stop Loss: $60,900Leverage: 10x–20xRisk/Reward: Approximately 1:2.5Confidence: 68%
Alternative Scenario
If BTC closes below $61,250, bullish setups become invalid. In that case, traders should wait for bearish confirmation targeting $60,250 and $58,850.
Final Thoughts
Bitcoin is sitting at one of the most important support zones of the month. Bulls still have a chance to reclaim momentum, but they must defend the $61K region and break above $63.5K to shift sentiment. Until then, traders should remain patient, manage risk carefully, and wait for confirmation before entering positions.
⚠️ Disclaimer: This analysis is for educational purposes only and is not financial advice. Always do your own research (DYOR) and use proper risk management.
#BitcoinPriceUpdate #Btcsignal #CryptoTradingInsights #BinanceSquareTalks #BTCUSDTAnalysis $RWA
Bitcoin is trading around $62,000 after another volatile session, and the market is approaching a critical decision point. Based on the daily chart, price remains trapped inside a consolidation range after a strong bearish impulse. Buyers have defended the $61,250–$61,400 support multiple times, but the inability to reclaim higher resistance suggests sellers are still in control.
The overall daily trend remains bearish, with lower highs continuing to form. However, short-term price action shows buyers attempting to build a base above support. As long as BTC holds above $61.2K, a relief bounce toward the next resistance zone remains possible. Losing this level, however, could trigger another sharp wave of selling.
The strongest resistance sits between $63,500 and $66,325. This zone has rejected price several times and is likely where bears will become aggressive again. A daily close above $63,500 would improve bullish momentum and increase the probability of a move toward $66,300–68,000.
On the downside, the key level to watch is $61,250. If sellers push below it with strong volume, the next downside targets become $60,250, followed by the major demand zone near $58,850. If panic selling accelerates, the broader support around $54,600 cannot be ruled out.
Volume remains relatively average, showing that neither side has full control yet. Meanwhile, RSI is hovering around 45, indicating neutral-to-bearish momentum without entering oversold territory. This means BTC still has room to move in either direction depending on market catalysts.
According to the market dashboard, overall crypto market sentiment remains cautious. Bitcoin dominance is weakening while the total crypto market trend still points downward. ETF flows are mixed, and liquidity conditions suggest volatility could increase over the coming sessions. Until Bitcoin breaks above resistance, traders should remain disciplined and avoid chasing candles.
📈 Trade Signal (Educational)
Exchange: Binance Pair: BTC/USDT Trade Setup: Long (Support Bounce)
Entry: $61,300 – $61,500Take Profit 1: $62,700Take Profit 2: $63,500Take Profit 3: $66,300Stop Loss: $60,900Leverage: 10x–20xRisk/Reward: Approximately 1:2.5Confidence: 68%
Alternative Scenario
If BTC closes below $61,250, bullish setups become invalid. In that case, traders should wait for bearish confirmation targeting $60,250 and $58,850.
Final Thoughts
Bitcoin is sitting at one of the most important support zones of the month. Bulls still have a chance to reclaim momentum, but they must defend the $61K region and break above $63.5K to shift sentiment. Until then, traders should remain patient, manage risk carefully, and wait for confirmation before entering positions.
⚠️ Disclaimer: This analysis is for educational purposes only and is not financial advice. Always do your own research (DYOR) and use proper risk management.
#BitcoinPriceUpdate #Btcsignal #CryptoTradingInsights #BinanceSquareTalks #BTCUSDTAnalysis $RWA
90
Log in to explore more content
Join global crypto users on Binance Square
⚡️ Get latest and useful information about crypto.
💬 Trusted by the world’s largest crypto exchange.
👍 Discover real insights from verified creators.
Email / Phone number
Trending Topics
BinanceLaunchesBinanceIntelligence
825,712 views
5,151 Discussing
🚀 BINANCE IS PUSHING AI DEEPER INTO FINANCE
Binance Intelligence brings together three products aimed at different users — everyday traders, advanced users and developers.
For traders, the interesting part is simple:
More data → better analysis → faster decisions.
Now the real question:
Can AI actually give retail traders an edge? 👀
$BNB $BTC $ETH
#binancelaunchesbinanceintelligence
CryptoMahibaloch
·0 Likes
·131 views
RobinhoodAdds$25MInBitcoinToBalanceSheet
0 views
0 Discussing
SP500AndNasdaqHitRecordHighs
0 views
19 Discussing