

bihun_nv
55 Posts

bihun_nv
Report
Block User
Хочеш мені допомогти мій id: 527652598💵
Open Trade
Frequent Trader
4 Years
1 Following
22 Followers
55 Liked
Posts
Portfolio
All
Videos
PINNED
·
--

Article
📈 Digital assets aren’t a game of chance: how the myth of easy riches breaks those just starting out#btc #eth #solana #bnb #atom
📈 Digital assets aren’t a game of chance: how the myth of easy riches breaks those just starting out
On social media, the cryptocurrency market is often portrayed as an endless source of easy money: quick “multiples” overnight, successful trades, and a lavish lifestyle. As a result, many beginners develop the dangerous illusion that crypto is the easiest path to millions, and all you have to do is guess which way the price will move.
📈 Digital assets aren’t a game of chance: how the myth of easy riches breaks those just starting out
#btc #eth #solana #bnb #atom
📈 Digital assets aren’t a game of chance: how the myth of easy riches breaks those just starting out
On social media, the cryptocurrency market is often portrayed as an endless source of easy money: quick “multiples” overnight, successful trades, and a lavish lifestyle. As a result, many beginners develop the dangerous illusion that crypto is the easiest path to millions, and all you have to do is guess which way the price will move.
📈 Digital assets aren’t a game of chance: how the myth of easy riches breaks those just starting out
On social media, the cryptocurrency market is often portrayed as an endless source of easy money: quick “multiples” overnight, successful trades, and a lavish lifestyle. As a result, many beginners develop the dangerous illusion that crypto is the easiest path to millions, and all you have to do is guess which way the price will move.
2
23
·
--
Bullish
Holding $BTC 69.1 USDT
$BTC
Analysis of the price movement on the chart:
1. A breather before the next surge: Bitcoin made a quick spike to $81,823 and is now calmly consolidating above the $81,000 mark. This is a healthy pause to build volume, not a trend reversal.
2. Key resistance: The main intermediate hurdle is the 81,823 USDT level. As soon as the market closes a candle above this peak, the momentum could easily push the price into our take-profit zone of $83,500–$85,000.
{spot}(BTCUSDT)
$BTC
Analysis of the price movement on the chart:
1. A breather before the next surge: Bitcoin made a quick spike to $81,823 and is now calmly consolidating above the $81,000 mark. This is a healthy pause to build volume, not a trend reversal.
2. Key resistance: The main intermediate hurdle is the 81,823 USDT level. As soon as the market closes a candle above this peak, the momentum could easily push the price into our take-profit zone of $83,500–$85,000.
25
·
--
Bullish
Holding $SOL 19.1 USDT
$SOL
SOL/USDT Analysis:
On the hourly chart, SOL is showing a confident bounce from a local low of 98.62. The current price is trading at 102.95, up +1.70% over the past 24 hours. The asset has successfully moved back above the psychological level of 100 and is approaching the 24-hour high of 103.69.
📊 Current position status:
Entry price: 106.45. The position is currently in an unrealized drawdown.
Key support: 98.62–100.46 zone (the established local low and 24-hour low).
Nearest structural resistance: 109.20 (the high from which the latest downward wave began).
⚙️ Action plan:
1. Hold: The primary technical target is a breakout above 103.69, which would open a direct path to our breakeven price of 106.45.
2. Averaging down (DCA): The 98.62 level has already prompted a strong buyer response. If the leading altcoin (ETH) pulls the market into a local correction, the 98.00–100.00 range is an ideal zone for the DCA bot’s lower protective orders to trigger. This will effectively lower the average entry price (106.45).
3. Taking profit: Consider closing the position in profit only after the price holds above 106.45, with a view to testing the 109.20 resistance.
{spot}(SOLUSDT)
$SOL
SOL/USDT Analysis:
On the hourly chart, SOL is showing a confident bounce from a local low of 98.62. The current price is trading at 102.95, up +1.70% over the past 24 hours. The asset has successfully moved back above the psychological level of 100 and is approaching the 24-hour high of 103.69.
📊 Current position status:
Entry price: 106.45. The position is currently in an unrealized drawdown.
Key support: 98.62–100.46 zone (the established local low and 24-hour low).
Nearest structural resistance: 109.20 (the high from which the latest downward wave began).
⚙️ Action plan:
1. Hold: The primary technical target is a breakout above 103.69, which would open a direct path to our breakeven price of 106.45.
2. Averaging down (DCA): The 98.62 level has already prompted a strong buyer response. If the leading altcoin (ETH) pulls the market into a local correction, the 98.00–100.00 range is an ideal zone for the DCA bot’s lower protective orders to trigger. This will effectively lower the average entry price (106.45).
3. Taking profit: Consider closing the position in profit only after the price holds above 106.45, with a view to testing the 109.20 resistance.
95
·
--
Bullish
30D trade $PEPE 5.8 USDT
$PEPE 🐸 PEPE/USDT: Steady growth and managing profits (+9.98%)
On the 1-hour chart (1H), PEPE is showing strong upward momentum, gaining nearly 10% over the past day. The current price is trading at 0.00000496, approaching the daily high of 0.00000505.
📊 Technical outlook and our position:
Cost basis (our entry): 0.00000457.
Local resistance: 0.00000511 (the high recorded on the chart before the local pullback).
Key support: 0.00000421 (the local low from which the current momentum began).
Volume: More than 93.23 million USDT has been traded over the past 24 hours, confirming strong buyer interest in the asset.
⚙️ Action plan:
1. Managing profits: Since the position is already profitable, it makes sense to consider taking partial profits as the price approaches the 0.00000505–0.00000511 resistance zone.
2. Holding for a breakout: If the price impulsively breaks through 0.00000511 and holds above it, the remainder of the position can be held in line with the trend, simply moving the stop-loss up to the breakeven zone.
3. Protection against a correction: If the market declines, our cost basis zone (0.00000457) will serve as the first line of defense. To add to the position (DCA), consider using safe limit orders closer to the 0.00000421 support level.
{spot}(PEPEUSDT)
$PEPE 🐸 PEPE/USDT: Steady growth and managing profits (+9.98%)
On the 1-hour chart (1H), PEPE is showing strong upward momentum, gaining nearly 10% over the past day. The current price is trading at 0.00000496, approaching the daily high of 0.00000505.
📊 Technical outlook and our position:
Cost basis (our entry): 0.00000457.
Local resistance: 0.00000511 (the high recorded on the chart before the local pullback).
Key support: 0.00000421 (the local low from which the current momentum began).
Volume: More than 93.23 million USDT has been traded over the past 24 hours, confirming strong buyer interest in the asset.
⚙️ Action plan:
1. Managing profits: Since the position is already profitable, it makes sense to consider taking partial profits as the price approaches the 0.00000505–0.00000511 resistance zone.
2. Holding for a breakout: If the price impulsively breaks through 0.00000511 and holds above it, the remainder of the position can be held in line with the trend, simply moving the stop-loss up to the breakeven zone.
3. Protection against a correction: If the market declines, our cost basis zone (0.00000457) will serve as the first line of defense. To add to the position (DCA), consider using safe limit orders closer to the 0.00000421 support level.
65
·
--
Bullish
30D trade $SUI 5.8 USDT
$SUI
💧 SUI/USDT Analysis: Local Bounce and Position Management
SUI is showing a technical bounce from the local low of 0.9001. The current price is 0.9481, with a 24-hour gain of +2.36%. The asset is attempting to break the 24-hour high at 0.9504.
📊 Current Situation:
Average entry price (position cost basis) — 0.9919.
Local low (support) — 0.9001.
Key higher-timeframe resistance — 1.0566.
⚙️ Action Plan:
1. Hold until breakeven: For the current position to break even, the price needs to move above 0.9919. Given the upward momentum, the first priority is to establish a foothold above 0.9500.
2. Using protective orders: The 0.9000–0.9200 zone has confirmed itself as strong support. If this range is retested, it is an optimal zone for the DCA bot’s lower orders to be triggered. This will allow you to average down the position effectively and bring the cost basis below 0.9919.
3. Taking profits: If the price reaches the 1.0000–1.0500 zone, consider taking partial profits, as 1.0566 has already proven to be strong seller resistance.
{spot}(SUIUSDT)
$SUI
💧 SUI/USDT Analysis: Local Bounce and Position Management
SUI is showing a technical bounce from the local low of 0.9001. The current price is 0.9481, with a 24-hour gain of +2.36%. The asset is attempting to break the 24-hour high at 0.9504.
📊 Current Situation:
Average entry price (position cost basis) — 0.9919.
Local low (support) — 0.9001.
Key higher-timeframe resistance — 1.0566.
⚙️ Action Plan:
1. Hold until breakeven: For the current position to break even, the price needs to move above 0.9919. Given the upward momentum, the first priority is to establish a foothold above 0.9500.
2. Using protective orders: The 0.9000–0.9200 zone has confirmed itself as strong support. If this range is retested, it is an optimal zone for the DCA bot’s lower orders to be triggered. This will allow you to average down the position effectively and bring the cost basis below 0.9919.
3. Taking profits: If the price reaches the 1.0000–1.0500 zone, consider taking partial profits, as 1.0566 has already proven to be strong seller resistance.
114
·
--
Bullish
Holding $DOGE 9.9 USDT
$DOGE
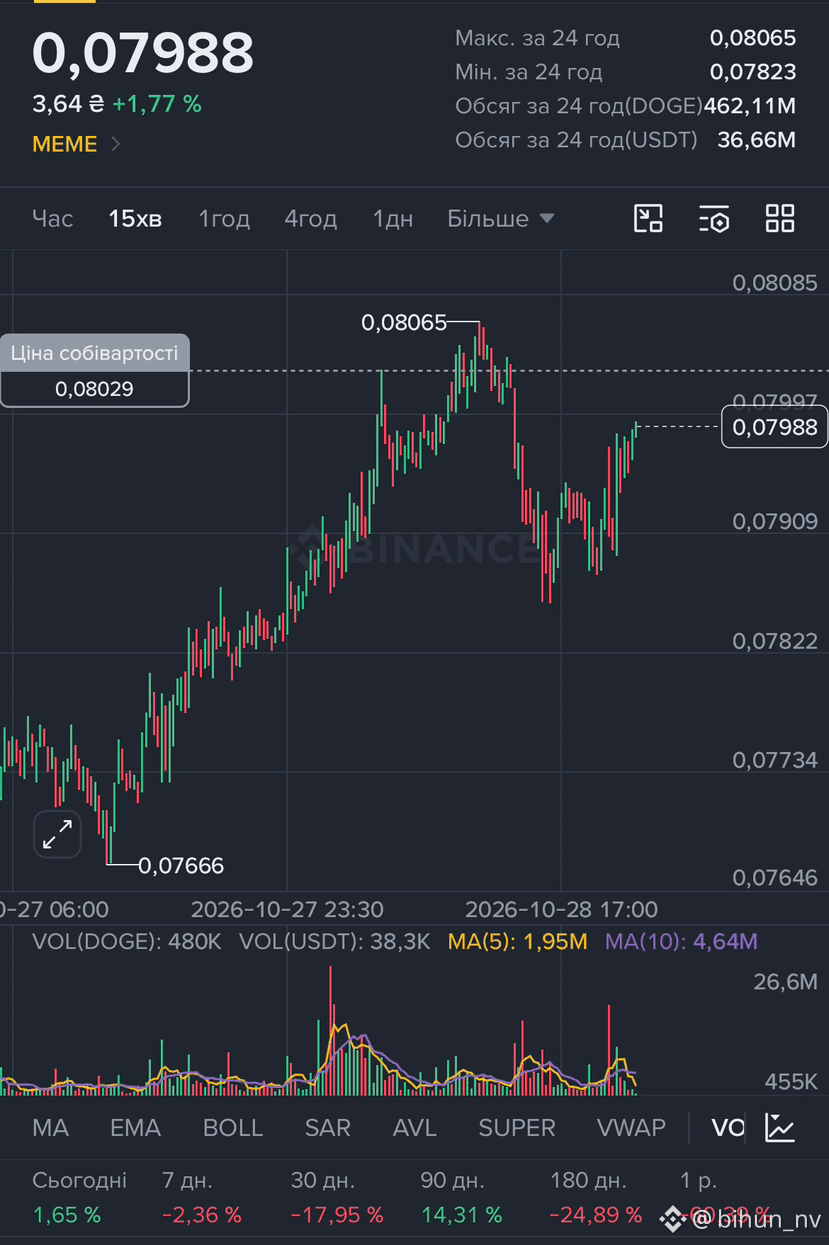
🐕 Local DOGE/USDT setup: Testing the 0.08000 level
On the 15-minute timeframe, we’re seeing a strong recovery in DOGE following a sharp correction from the local high. The price is currently 0.07988 and is testing the key psychological level of 0.08000.
📊 Technical picture (15m):
Local high (resistance): 0.08065.
Local low (support): 0.07666, where the current upward impulse began.
Intermediate support: The 0.07900 zone, where buyers reacted after a slight pullback.
⚙️ Plan of action:
1. Breakout: If the coin breaks through 0.08000 and holds above it, the way is open for a retest of the local high at 0.08065. This is a signal to hold positions or trade the breakout.
2. Pullback: If the 0.08000 level holds, a correction is possible. Rather than entering at market price, it may be better to place limit buy orders in the intermediate support zone of 0.07850–0.07900 or set up a DCA bot grid to average down more safely.
The market is showing positive momentum (+1.77% for the day), but we’re waiting for confirmation of a breakout on volume before increasing the position size.
{spot}(DOGEUSDT)
$DOGE
🐕 Local DOGE/USDT setup: Testing the 0.08000 level
On the 15-minute timeframe, we’re seeing a strong recovery in DOGE following a sharp correction from the local high. The price is currently 0.07988 and is testing the key psychological level of 0.08000.
📊 Technical picture (15m):
Local high (resistance): 0.08065.
Local low (support): 0.07666, where the current upward impulse began.
Intermediate support: The 0.07900 zone, where buyers reacted after a slight pullback.
⚙️ Plan of action:
1. Breakout: If the coin breaks through 0.08000 and holds above it, the way is open for a retest of the local high at 0.08065. This is a signal to hold positions or trade the breakout.
2. Pullback: If the 0.08000 level holds, a correction is possible. Rather than entering at market price, it may be better to place limit buy orders in the intermediate support zone of 0.07850–0.07900 or set up a DCA bot grid to average down more safely.
The market is showing positive momentum (+1.77% for the day), but we’re waiting for confirmation of a breakout on volume before increasing the position size.
54
·
--
Bearish
Holding $BTC 68.4 USDT
$BTC
BTC/USDT
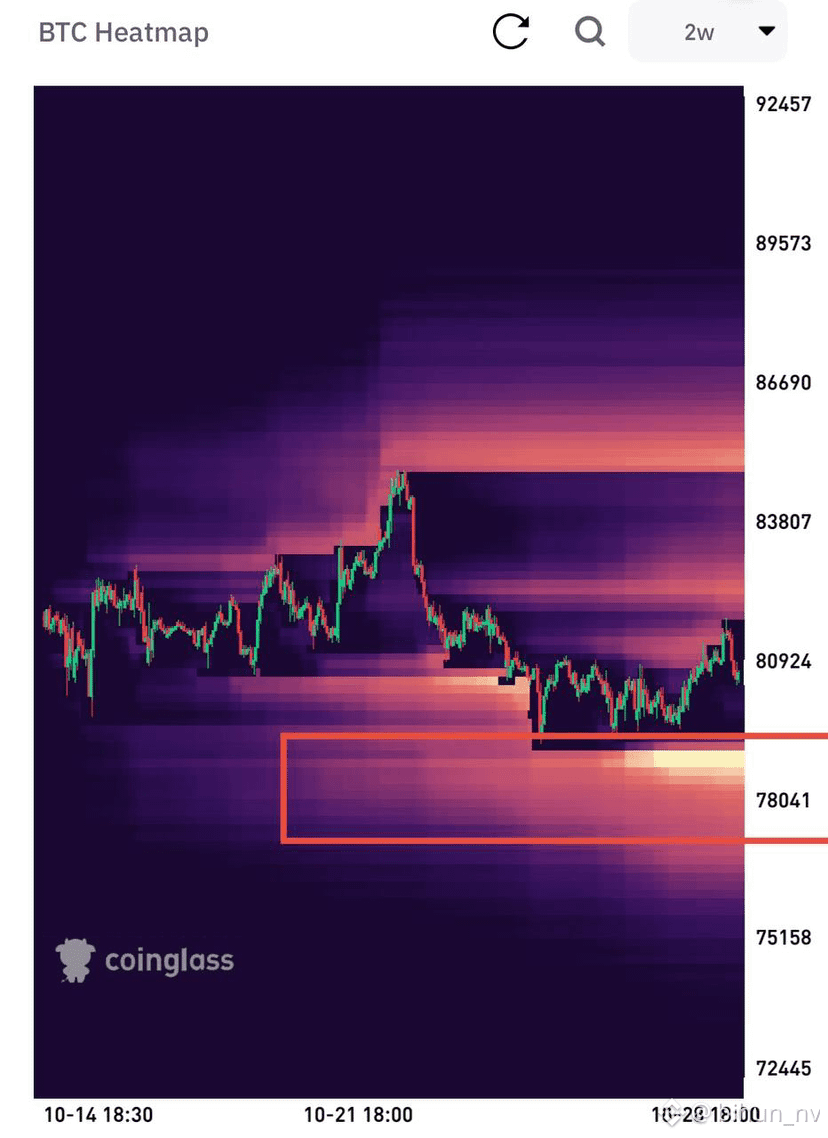
The Fed meeting is just a few hours away—it will determine the direction and price zone.
The liquidation map shows a very large, attractive zone around $78,000, where a large number of stop orders have accumulated. The price is being pulled there, and it may act as a magnet for the subsequent move. In any case, $78,000 remains the area of interest for now.
{spot}(BTCUSDT)
$BTC
BTC/USDT
The Fed meeting is just a few hours away—it will determine the direction and price zone.
The liquidation map shows a very large, attractive zone around $78,000, where a large number of stop orders have accumulated. The price is being pulled there, and it may act as a magnet for the subsequent move. In any case, $78,000 remains the area of interest for now.
841
·
--
The US national debt has reached a record $40.5T!
It’s increasing by $7B every day.
That amounts to $118,175 for every US resident, including men, women, and children. At the current rate, the debt is expected to exceed a staggering $41T by early January 2027!
The US national debt has reached a record $40.5T!
It’s increasing by $7B every day.
That amounts to $118,175 for every US resident, including men, women, and children. At the current rate, the debt is expected to exceed a staggering $41T by early January 2027!
It’s increasing by $7B every day.
That amounts to $118,175 for every US resident, including men, women, and children. At the current rate, the debt is expected to exceed a staggering $41T by early January 2027!
1
5
·
--
Holding $ATOM 18.4 USDT
$SOL & $ATOM — Altcoin traps are set
⚡️ $SOL and $ATOM: getting ready to take profits on price spikes.
Solana is holding its levels for a move to $128, while Cosmos ($ATOM) is building volume with a target of $2.15. The key rule when trading altcoins is strict discipline: don’t exit manually too early—let your orders take the planned profit.
What target levels are you setting for SOL this week?
#SOL #ATOM #Altcoins #BinanceSquare
{spot}(SOLUSDT)
{spot}(ATOMUSDT)
$SOL & $ATOM — Altcoin traps are set
⚡️ $SOL and $ATOM : getting ready to take profits on price spikes.
Solana is holding its levels for a move to $128, while Cosmos ($ATOM ) is building volume with a target of $2.15. The key rule when trading altcoins is strict discipline: don’t exit manually too early—let your orders take the planned profit.
What target levels are you setting for SOL this week?
#SOL #ATOM #Altcoins #BinanceSquare
40
·
--
Holding $SOL 18.9 USDT
$SOL & $ATOM — Altcoin traps are set
⚡️ $SOL and $ATOM: getting ready to take profits on sharp moves.
Solana is holding its levels for a move to $128, while Cosmos ($ATOM) is building volume toward the $2.15 target. The key rule when trading altcoins is strict discipline: don’t exit manually too early; let your orders take their planned profits.
What target levels are you setting for SOL this week?
#SOL #ATOM #Altcoins #BinanceSquare
{spot}(ATOMUSDT)
{spot}(SOLUSDT)
$SOL & $ATOM — Altcoin traps are set
⚡️ $SOL and $ATOM : getting ready to take profits on sharp moves.
Solana is holding its levels for a move to $128, while Cosmos ($ATOM ) is building volume toward the $2.15 target. The key rule when trading altcoins is strict discipline: don’t exit manually too early; let your orders take their planned profits.
What target levels are you setting for SOL this week?
#SOL #ATOM #Altcoins #BinanceSquare
146
·
--
Holding $BTC 68.4 USDT
$BTC & $ETH — 50/50 Strategy on Top Coins
BTC at $85,000 and a rally $ETH — what to expect from the major assets?
Bitcoin continues to hold a bullish structure with $85,000 in sight, while Ether is building a base for a move toward $2,850+. In this market phase, the 50/50 model works perfectly: half of your position earns yield in Earn, while the other half sits in limit orders for a breakout.
Which asset in your portfolio is currently showing the best PnL?
#BTC #ETH #CryptoMarket #TradingTips
{spot}(ETHUSDT)
{spot}(BTCUSDT)
$BTC & $ETH — 50/50 Strategy on Top Coins
BTC at $85,000 and a rally $ETH — what to expect from the major assets?
Bitcoin continues to hold a bullish structure with $85,000 in sight, while Ether is building a base for a move toward $2,850+. In this market phase, the 50/50 model works perfectly: half of your position earns yield in Earn, while the other half sits in limit orders for a breakout.
Which asset in your portfolio is currently showing the best PnL?
#BTC #ETH #CryptoMarket #TradingTips
66
·
--
Holding $DOGE 9.8 USDT
$DOGE — Local entry point and accumulation
🐕 $DOGE gearing up for another explosive move?
After consolidating locally around $0.079–$0.080, the coin looks like an interesting option for a disciplined entry. The first breakout target is +15% growth (the $0.092+ zone). Memecoins always make sudden moves on volume, so it’s best to have limit orders ready in advance.
Are you buying DOGE on the spot market, or waiting for a deeper pullback? Let us know in the comments!
#DOGE #Memecoins #Crypto #Binance
{spot}(DOGEUSDT)
$DOGE — Local entry point and accumulation
🐕 $DOGE gearing up for another explosive move?
After consolidating locally around $0.079–$0.080, the coin looks like an interesting option for a disciplined entry. The first breakout target is +15% growth (the $0.092+ zone). Memecoins always make sudden moves on volume, so it’s best to have limit orders ready in advance.
Are you buying DOGE on the spot market, or waiting for a deeper pullback? Let us know in the comments!
#DOGE #Memecoins #Crypto #Binance
1
1
465
·
--
Holding $BNB 21 USDT
$BNB — Level Breakout and Profit-Taking
🚀 $BNB is showing tremendous strength! The break above $755 went perfectly.
The price is pushing confidently upward, setting new local highs. Those who positioned themselves for the breakout are already taking clean profits on the spot market. If the momentum continues, the next key target is the $780–$800 zone.
How are you managing your BNB right now: taking profits in portions, or keeping 100% in Earn to earn passive interest?
#BNB #CryptoTrading #BinanceSquare #TradingStrategy
{spot}(BNBUSDT)
$BNB — Level Breakout and Profit-Taking
🚀 $BNB is showing tremendous strength! The break above $755 went perfectly.
The price is pushing confidently upward, setting new local highs. Those who positioned themselves for the breakout are already taking clean profits on the spot market. If the momentum continues, the next key target is the $780–$800 zone.
How are you managing your BNB right now: taking profits in portions, or keeping 100% in Earn to earn passive interest?
#BNB #CryptoTrading #BinanceSquare #TradingStrategy
1
205
·
--
$AIN
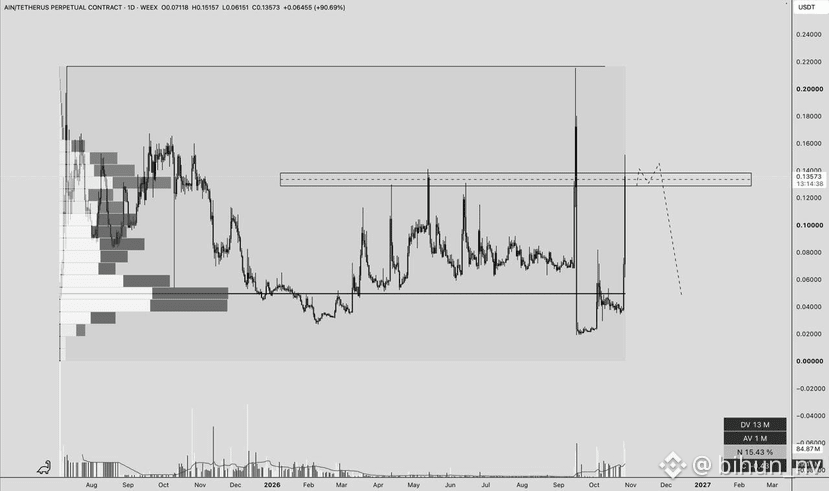
🕵️♀️ Coin: AIN - SHORT - x20!
Position entry range: 0.13-0.14!
Take profit: 5-10-20% + range 0.054-0.046!
The trade is based on 0.25% risk, with 1-2 averaging entries. Please take this into account when building the position!
{future}(AINUSDT)
$AIN
🕵️♀️ Coin: AIN - SHORT - x20!
Position entry range: 0.13-0.14!
Take profit: 5-10-20% + range 0.054-0.046!
The trade is based on 0.25% risk, with 1-2 averaging entries. Please take this into account when building the position!
🕵️♀️ Coin: AIN - SHORT - x20!
Position entry range: 0.13-0.14!
Take profit: 5-10-20% + range 0.054-0.046!
The trade is based on 0.25% risk, with 1-2 averaging entries. Please take this into account when building the position!
2
546
·
--
Holding $ETH 46.7 USDT
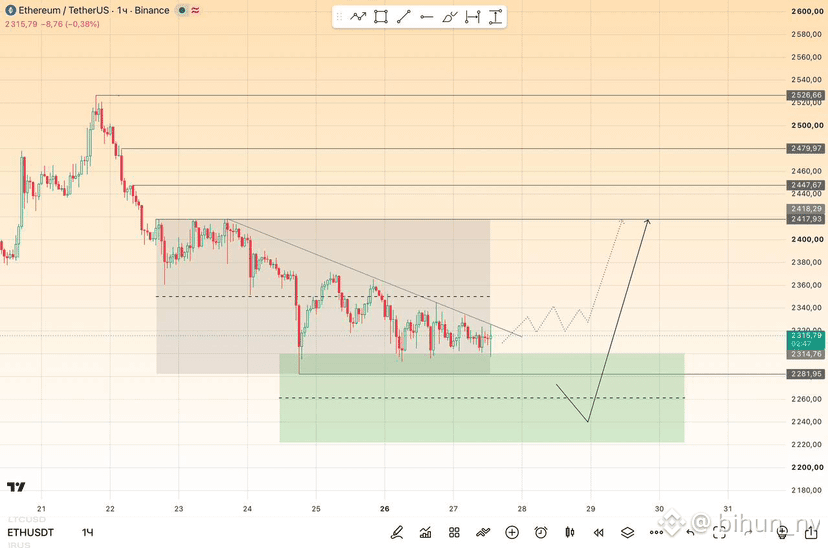
$ETH The chart clearly outlines two potential scenarios for a move near the current descending resistance trendline:
1. Breakout and consolidation (dashed line): The price breaks through the trendline, makes a local retest, and moves up toward the 2417 resistance zone.
2. Pullback to the support zone (solid line): The price fails to break through resistance and drops into the green support zone (levels 2240–2260), then reverses and climbs sharply toward the same target of 2417.
{spot}(ETHUSDT)
$ETH The chart clearly outlines two potential scenarios for a move near the current descending resistance trendline:
1. Breakout and consolidation (dashed line): The price breaks through the trendline, makes a local retest, and moves up toward the 2417 resistance zone.
2. Pullback to the support zone (solid line): The price fails to break through resistance and drops into the green support zone (levels 2240–2260), then reverses and climbs sharply toward the same target of 2417.
1
646
·
--
$Q Q/USDT
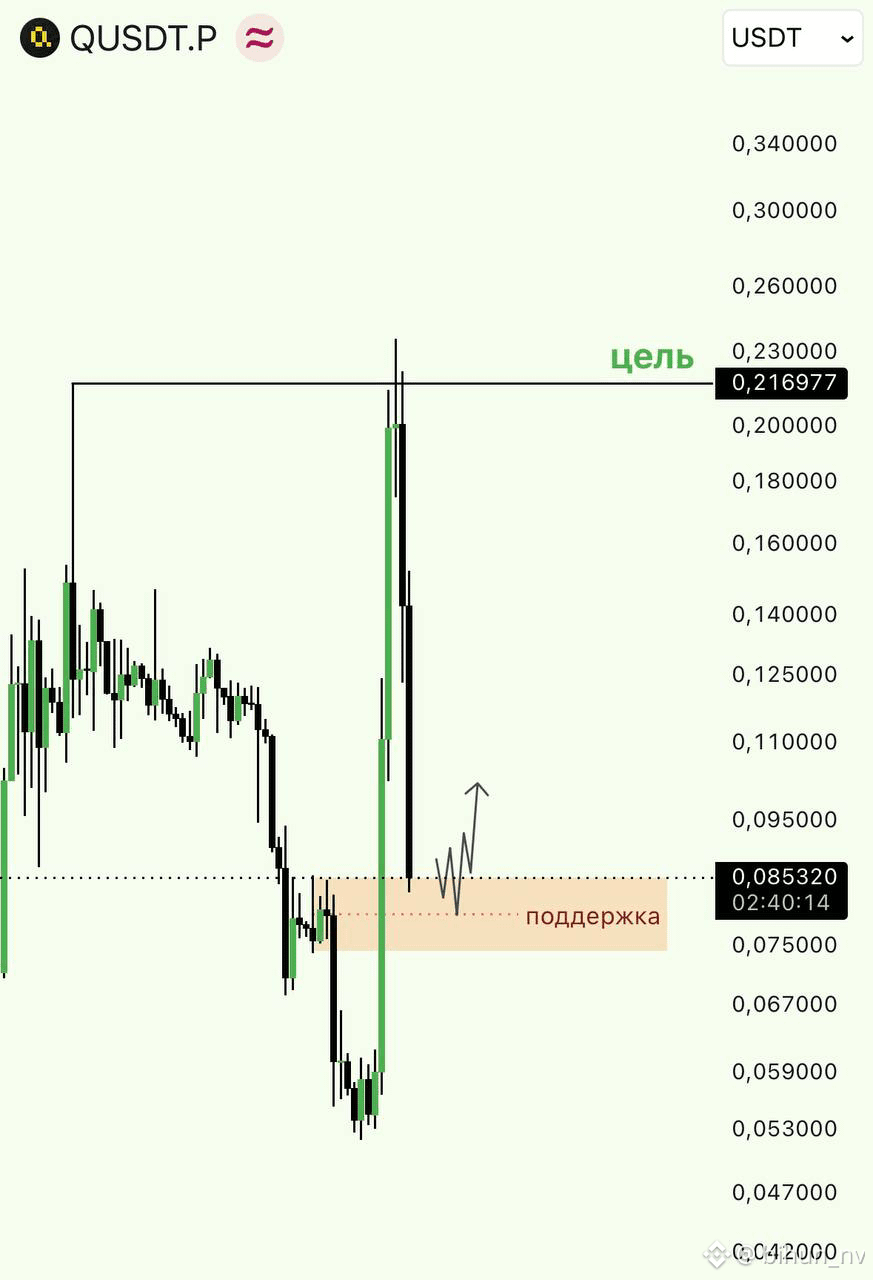
Yesterday, we had a similar situation with IRYS. A participant stepped in and started pumping the price above the previous high, but today they’ve started dumping the token. We’ve now reached a retest of the support level, so I’ll try to look for a local long here on a pullback if there’s a reaction, and take profit depending on how much of a bounce we get.
Yesterday, we had a similar situation with IRYS. A participant stepped in and started pumping the price above the previous high, but today they’ve started dumping the token. We’ve now reached a retest of the support level, so I’ll try to look for a local long here on a pullback if there’s a reaction, and take profit depending on how much of a bounce we get.
1
92
·
--
Bullish
Holding $ETH 46.9 USDT
$ETH 🦇 Ethereum looks sluggish. Should I rotate it into other altcoins?
My ETH position is currently in the red (-5.8%). People are saying that Solana or SUI will soon overtake it. But let’s not forget: most DeFi, NFTs, and the deepest liquidity are still in the Ethereum ecosystem. With the development of L2 solutions, fees are no longer a problem. ETH isn’t about quick hype—it’s built on a rock-solid foundation.
Are you holding $ETH or do you prefer "faster" coins?
#Ethereum #ETH #DeFi #CryptoMarket
{spot}(ETHUSDT)
$ETH 🦇 Ethereum looks sluggish. Should I rotate it into other altcoins?
My ETH position is currently in the red (-5.8%). People are saying that Solana or SUI will soon overtake it. But let’s not forget: most DeFi, NFTs, and the deepest liquidity are still in the Ethereum ecosystem. With the development of L2 solutions, fees are no longer a problem. ETH isn’t about quick hype—it’s built on a rock-solid foundation.
Are you holding $ETH or do you prefer "faster" coins?
#Ethereum #ETH #DeFi #CryptoMarket
2
119
·
--
$BTC 🐋 While you’re panicking over a 2% dip, the whales keep buying Bitcoin.
I’m looking at my BTC balance: a local dip means nothing when you look at the global chart. ETFs are scooping coins off the market, the halving has done its job, and exchange supply is falling. Selling Bitcoin during these tiny dips is handing your asset to the big players for next to nothing. Hold the line!
#Bitcoin #BTC #HODL #CryptoWhales
{spot}(BTCUSDT)
{spot}(ETHUSDT)
$BTC 🐋 While you’re panicking over a 2% dip, the whales keep buying Bitcoin.
I’m looking at my BTC balance: a local dip means nothing when you look at the global chart. ETFs are scooping coins off the market, the halving has done its job, and exchange supply is falling. Selling Bitcoin during these tiny dips is handing your asset to the big players for next to nothing. Hold the line!
#Bitcoin #BTC #HODL #CryptoWhales
1
46
·
--
Holding $SOL 18.9 USDT
$SOL 🚀 SUI — is it a “Solana killer” or just temporary hype?
Right now, SUI is showing incredible growth. The Move programming language, parallel transaction processing, and millions pouring into the DeFi sector are making every trader take notice.
My strategy is to hold SUI as a high-risk but extremely promising asset. If they keep this up, we’ll see a change in the L1 sector’s leaders.
🤔 What do you choose: the time-tested $SOL or the innovative $SUI? Vote in the comments!
#SUI #Solana #L1 #Web3
{spot}(SUIUSDT)
{spot}(SOLUSDT)
$SOL 🚀 SUI — is it a “Solana killer” or just temporary hype?
Right now, SUI is showing incredible growth. The Move programming language, parallel transaction processing, and millions pouring into the DeFi sector are making every trader take notice.
My strategy is to hold SUI as a high-risk but extremely promising asset. If they keep this up, we’ll see a change in the L1 sector’s leaders.
🤔 What do you choose: the time-tested $SOL or the innovative $SUI? Vote in the comments!
#SUI #Solana #L1 #Web3
1
131
·
--
Bullish
Holding $ATOM 18.6 USDT
$ATOM
🌌 Cosmos (ATOM): Undervalued giant or investor trap?
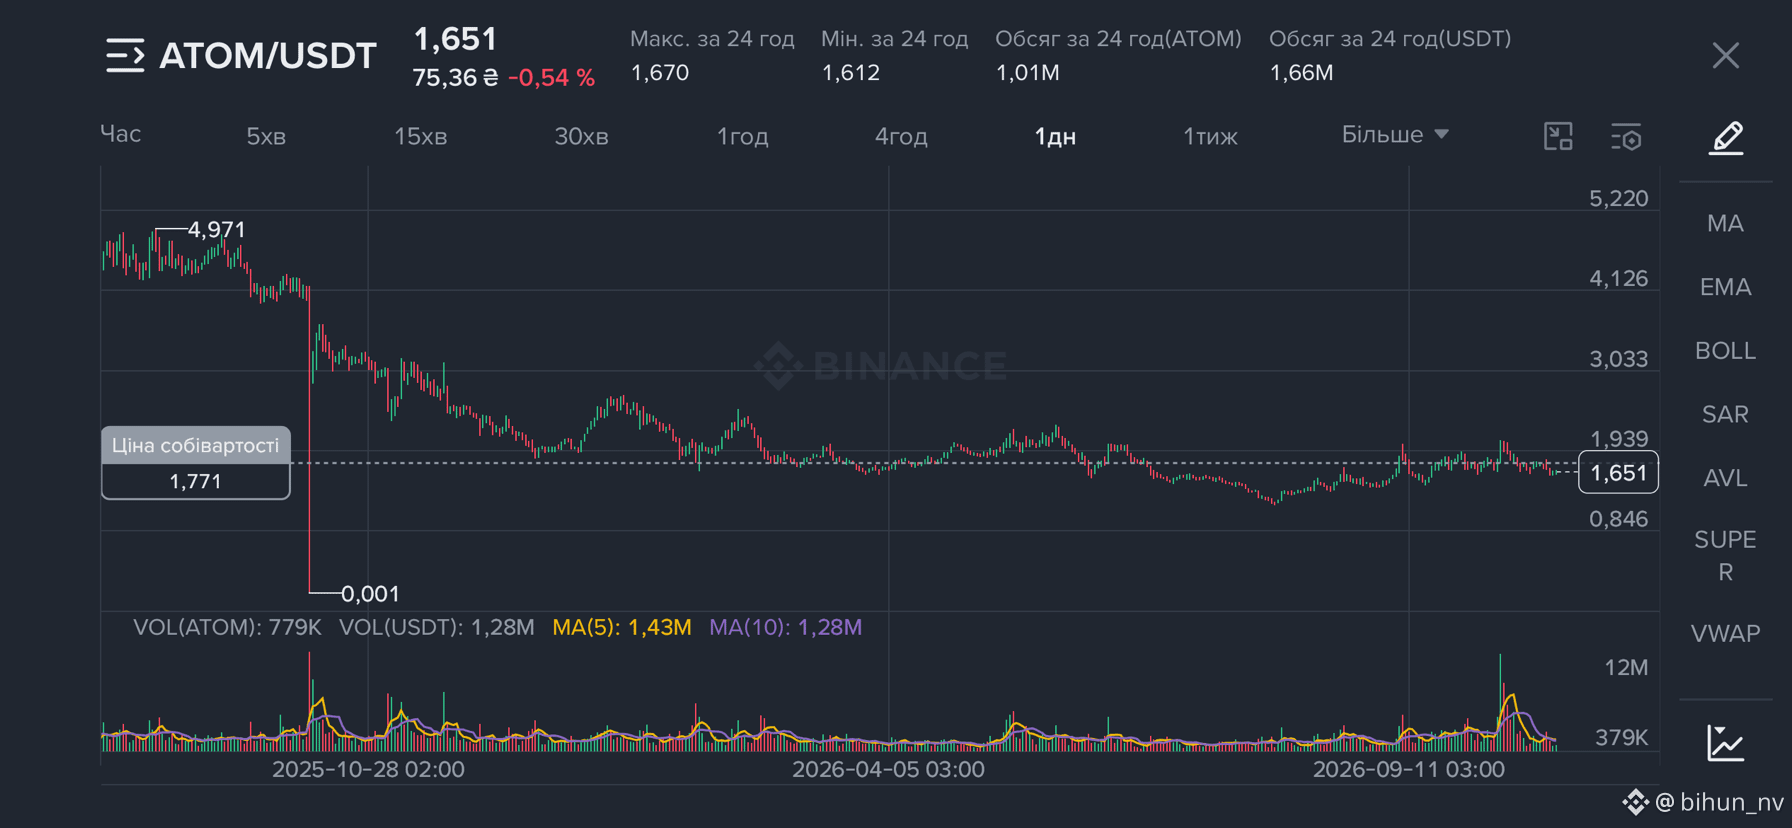
Right now, ATOM has the biggest drawdown among my assets (-6.6%). You might think it’s time to cut my losses and move on, but let’s take a closer look at the technology.
Cosmos is the “Internet of Blockchains.” Its IBC (Inter-Blockchain Communication) technology allows completely different networks to safely exchange data and assets. A huge number of top projects are built on the Cosmos SDK.
Why is the price falling?
ATOM currently faces challenges with its inflationary tokenomics model and the lack of a direct link between the success of new networks and the value of the ATOM token itself.
Why am I not selling?
ATOM remains one of the best assets for staking. Its high annual percentage yield (APY) partly offsets the price decline, while regular, substantial airdrops for ATOM stakers have historically made up for any local losses.
Who else is staking $ATOM , waiting for an ecosystem boom? ⚛️
#Cosmos #ATOM #Staking #Altcoins
{spot}(ATOMUSDT)
$ATOM
🌌 Cosmos (ATOM): Undervalued giant or investor trap?
Right now, ATOM has the biggest drawdown among my assets (-6.6%). You might think it’s time to cut my losses and move on, but let’s take a closer look at the technology.
Cosmos is the “Internet of Blockchains.” Its IBC (Inter-Blockchain Communication) technology allows completely different networks to safely exchange data and assets. A huge number of top projects are built on the Cosmos SDK.
Why is the price falling?
ATOM currently faces challenges with its inflationary tokenomics model and the lack of a direct link between the success of new networks and the value of the ATOM token itself.
Why am I not selling?
ATOM remains one of the best assets for staking. Its high annual percentage yield (APY) partly offsets the price decline, while regular, substantial airdrops for ATOM stakers have historically made up for any local losses.
Who else is staking $ATOM , waiting for an ecosystem boom? ⚛️
#Cosmos #ATOM #Staking #Altcoins
2
141
Log in to explore more content
Join global crypto users on Binance Square
⚡️ Get latest and useful information about crypto.
💬 Trusted by the world’s largest crypto exchange.
👍 Discover real insights from verified creators.
Email / Phone number