
In the past three weeks, the cryptocurrency market has been experiencing a silent liquidity crisis. The Coinbase Premium Index is deeply negative, Bitcoin ETFs have faced the largest capital outflow in history, and exchange reserves continue to decline - three key indicators are all flashing red, revealing the grim reality that institutional funds in the U.S. are being withdrawn on a large scale.
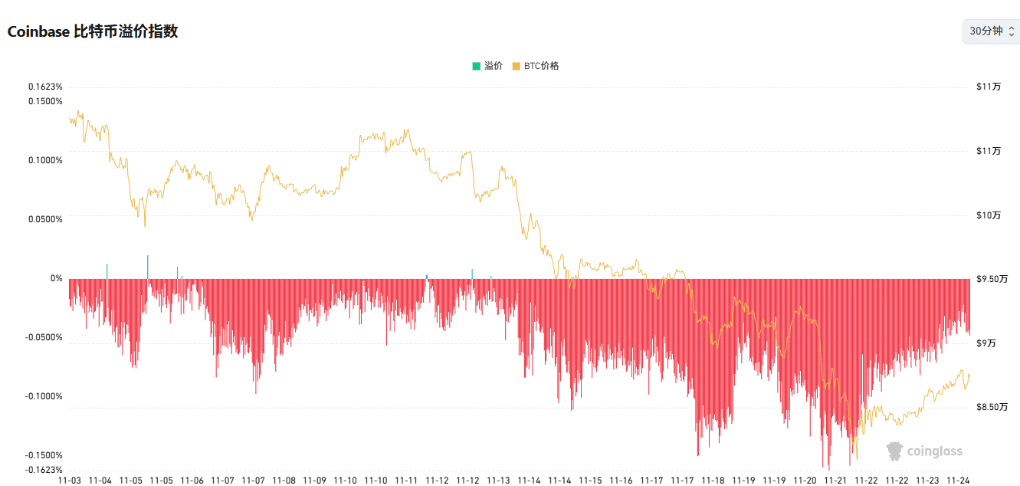
 I. Alarm bells ring: Three major indicators deteriorate simultaneously - Coinbase Premium Index
1. Coinbase Bitcoin Premium Index is used to measure the deviation of Bitcoin prices on Coinbase (a mainstream compliant exchange in the U.S.) compared to the global market average, serving as an important indicator of U.S. capital movement.
2. When Coinbase price is higher than the global average price (positive premium), it usually indicates strong buying in the U.S. market, active entry of institutions or U.S. dollar funds, and a recovery in risk appetite; when the index is negative, it means increased selling pressure, cold sentiment, or capital outflow.
3. Historically, the long-term positive premium during the 2020-2021 bull market reflected continuous institutional buying, while the frequent negative premium during the 2022-2023 bear market corresponded to panic selling. By 2024-2025, this indicator will still be widely used to compare the strength and sentiment differences between the 'U.S. vs Asian markets' and will be an indispensable reference in cryptocurrency market analysis.
● As a core barometer for observing the flow of U.S. institutional funds, the Coinbase Bitcoin premium index has remained in negative territory for 24 consecutive trading days since October 31. This is the first time this year.
● Deep negative premium means that Bitcoin prices on Coinbase continue to be lower than the global average price, indicating that U.S. professional investors have not only failed to buy the dip but are also continuously reducing their positions or engaging in hedging trades.
 Bitcoin ETF: A historical record of $3.8 billion in single-month net outflow
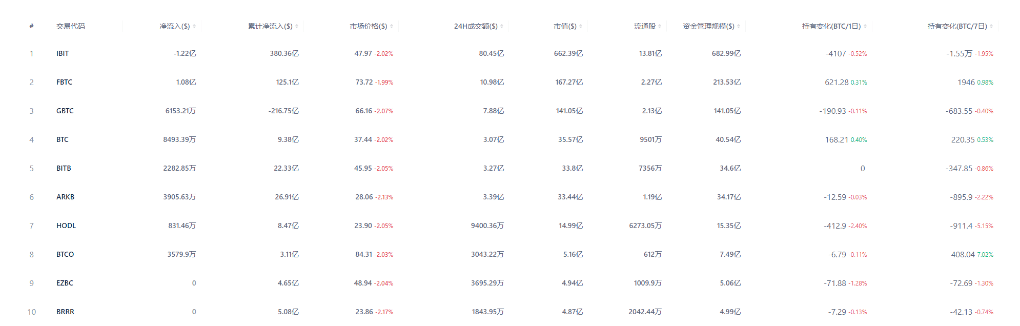
● The U.S. Bitcoin spot ETF is undergoing the most severe test since its approval for listing in January. As of November 21, the net outflow of all Bitcoin ETFs in November has reached $3.79 billion, breaking the historical record of $3.56 billion set in February.
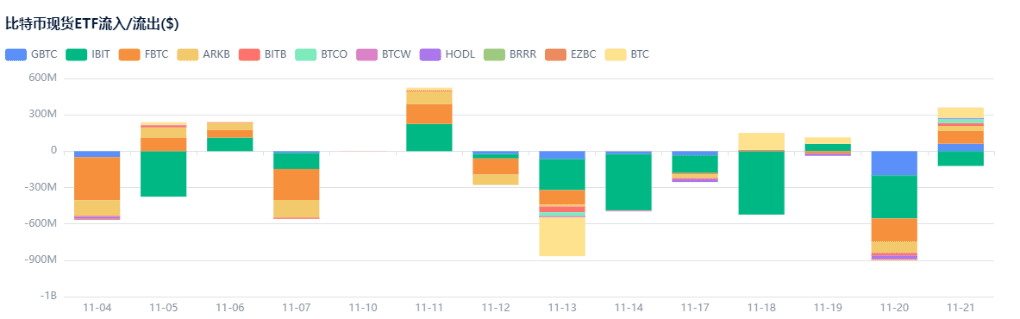
● Among them, BlackRock's IBIT fund had a net outflow of $2.47 billion in a single month, and Fidelity's FBTC had a net outflow of $1.09 billion, with the two giants' products accounting for 91% of the total net outflow. On November 20, all Bitcoin ETFs recorded a single-day net outflow of $903 million, the second highest in history.
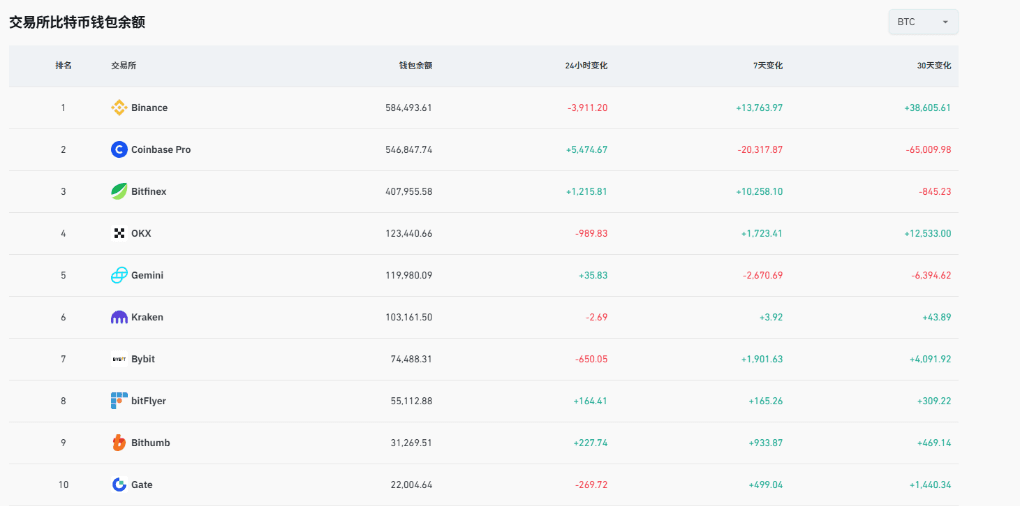
 Exchange reserves: long-term trend of total reserves decreasing by 18%
● CEX reduced its holdings by approximately 8,181 BTC in November compared to October, worth about $842 million. More macro data shows that the total Bitcoin reserves of all centralized exchanges have decreased by about 18% from the levels at the end of 2024, currently slightly above 2.4 million.
This ongoing 'blood loss' state indicates that investors are transferring assets from exchanges to private wallets or other investment channels, and the liquidity of exchanges is gradually being drained.
 Two, Chain reaction: Market structure is changing
● Lack of momentum during trading hours
The continuous negative Coinbase premium directly affects Bitcoin's performance during different trading periods. Due to a lack of institutional buying support during U.S. trading hours, price rebounds appear particularly weak. Market analysts note that recent Bitcoin upward momentum mainly comes from Asian and European trading hours, while the U.S. market has become a drag.
● The structural buying power of ETFs has disappeared
The Bitcoin spot ETF was originally the most important source of structural buying in the market, but now it has become a net seller. At the current outflow rate, the daily net outflow of the ETF far exceeds the daily output of miners at about 450 BTC, indicating that the market is accumulating positive net supply, continuously pressuring prices.
● Liquidity stratification intensifies
Against the backdrop of widespread outflows, different exchanges show obvious differentiation. Platforms dominated by institutions, such as Coinbase and Kraken, have the most severe outflows, while Binance, which gathers retail users, plays the role of a 'buyer' to some extent. This liquidity stratification may lead to persistent price differences for the same asset across different platforms, increasing arbitrage opportunities while also raising trading costs.
Three, In-depth analysis: Who is withdrawing? Why are they withdrawing?
Tactical adjustments of U.S. institutions
From the data distribution, this round of capital withdrawal is obviously dominated by U.S. institutions. This may be the result of multiple factors driving it:
● Year-end reallocation pressure: As the end of the fourth quarter approaches, some funds may choose to take profits or reduce risk asset allocations.
● Macroeconomic uncertainty: The rebound in U.S. Treasury yields and the strengthening of the dollar and other traditional financial market factors are prompting a reallocation of funds.
● Heightened regulatory concerns: The recent enforcement actions by the U.S. Securities and Exchange Commission against several cryptocurrency companies have intensified institutions' concerns about compliance risks.
Leading indicators of smart money
Historical data shows that the Coinbase premium index has a leading relationship with Bitcoin price trends. When the premium is deeply negative, it often signals that the short-term price bottom is approaching. Similar patterns have emerged in historical cycles such as 2019 and 2022—institutions have shown extreme pessimism in local bottom regions before the market rebounds.
Funding diversion in the on-chain ecosystem
Not all funds flowing out of exchanges have left the market. A significant portion of Bitcoin has flowed into decentralized finance (DeFi) ecosystems, participating in staking, providing liquidity, or lending. On-chain data shows that the amount of Bitcoin locked in DeFi protocols has reached an all-time high, indicating that funds are simply searching for higher-yielding applications.
Four, Market impact: The game pattern hidden in the crisis
1. Short-term pain and long-term benefits
Although the continuous decrease in exchange reserves suppresses prices in the short term, it is a healthy signal in the long term. Most of the Bitcoin withdrawn has entered a long-term storage state, reducing market floating supply. Once demand warms up, a small amount of buying can trigger a significant rise, creating a so-called 'supply shock.'
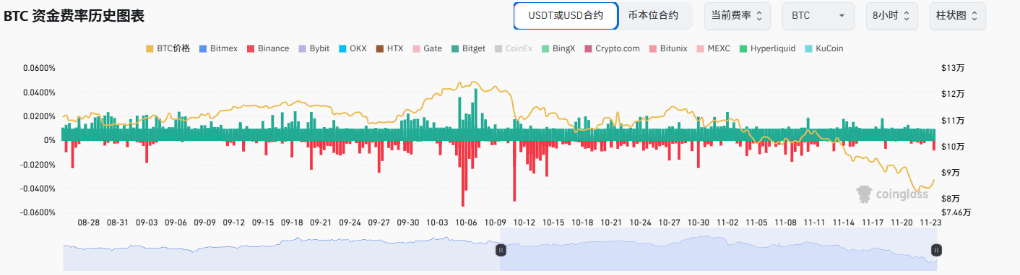
2. Risk accumulation in the derivatives market
While outflows from the spot market are happening, the funding rates for perpetual contracts remain relatively high, indicating that leveraged longs have not completely exited. This divergence between weak spot and strong derivatives increases the risk of cascading liquidations. Once prices experience significant fluctuations, it may trigger a chain liquidation.
3. The transition of old and new capital
The current market is in a transitional period of the handover between old and new capital. Early profit-taking U.S. institutions are exiting, while new funds—whether from Asian capital or long-term allocations from traditional financial institutions—have not yet entered on a large scale. This state of transition is a typical characteristic of the market bottoming phase.
Five, Future outlook: When will the turning point appear?
1. Key observation signals
Market stabilization requires attention to several key signals:
● Coinbase premium index turns positive: This is the most direct evidence of the recovery of U.S. institutional demand.
● Slowdown in ETF fund outflows: When daily net outflows drop below $100 million, it may indicate that selling pressure is nearing its end.
● Positive net inflow to exchanges: Continuous net inflows usually indicate that a price bottom is forming.
2. Potential catalysts
The following factors may become catalysts for market turning points:
● December FOMC meeting: If the Federal Reserve releases clear dovish signals, it may reignite risk appetite.
● Institutional quarterly reports: The Bitcoin holdings disclosed by large listed companies in their Q4 reports may affect market sentiment.
● Technical breakout: If it can effectively break through the previous high of $68,000, it will break the current downtrend and attract trend traders to enter.
3. Lessons from historical cycles
From the Bitcoin halving cycle perspective, we are currently in the 18th month after the third halving. Historical data shows that this stage is often accompanied by violent fluctuations and adjustments in institutional holdings, but it is also a key period for accumulating energy for the next round of major upward waves.
Historical experience shows that the darkest moments often breed the greatest opportunities. When the Coinbase premium index returns to positive territory, when ETF funds resume net inflows, and when exchanges start to see sustained net inflows, the spring of the market may not be far away. For rational investors, the key now is not to be blindly pessimistic but to closely monitor changes in these key indicators, seeking the flame of hope in the market's freezing point.
Join our community, let's discuss and become stronger together!
Official Telegram community: https://t.me/aicoincn
AiCoin Chinese Twitter: https://x.com/AiCoinzh
OKX benefits group: https://aicoin.com/link/chat?cid=l61eM4owQ
Binance benefits group: https://aicoin.com/link/chat?cid=ynr7d1P6Z


