

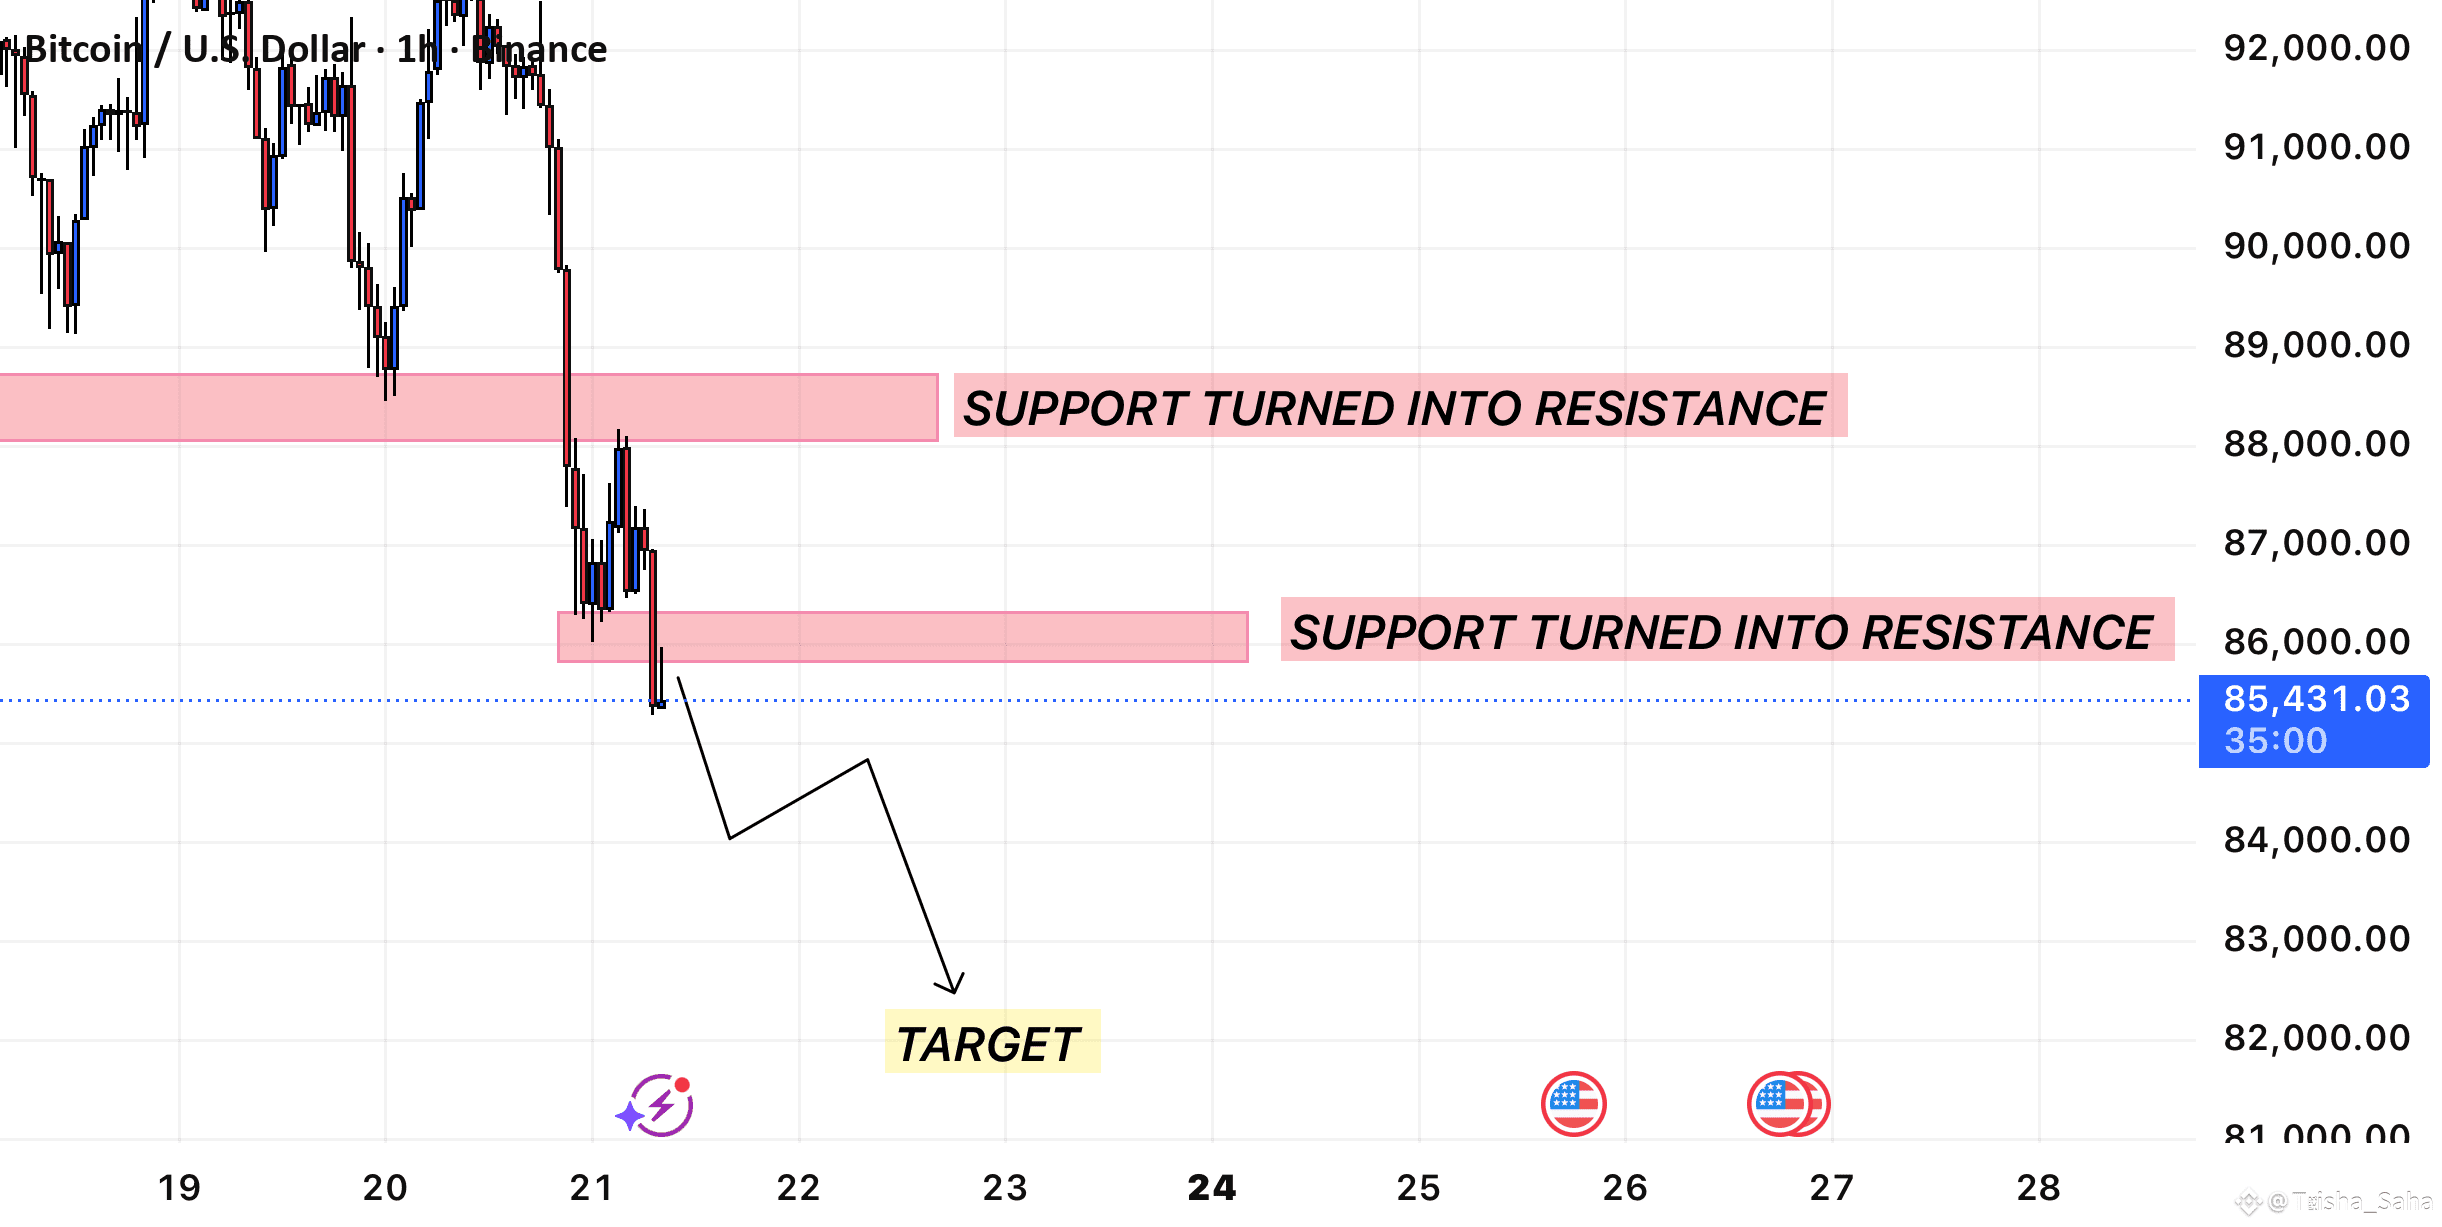
 Bitcoin has broken below a key support zone, which has now flipped into resistance on both the upper and lower highlighted regions. These zones have already been respected multiple times, confirming a shift in market structure from bullish support to bearish resistance.
Price is currently pulling back toward the nearest resistance zone. As long as BTC remains below this level, the bias stays bearish.
🔍 Market Structure
Previous support levels have turned into resistance, signaling sellers are in control.
Breakdown followed by consolidation below resistance suggests continuation to the downside.
The projected TARGET zone aligns with the next major demand area where buyers may attempt to re-enter.
📉 Bearish Scenario (Primary Bias)
Price retests the lower resistance zone.
Rejection keeps momentum bearish.
BTC moves toward the TARGET area marked on the chart for potential reaction.
📈 Bullish Invalidation
A strong close back above the resistance zone would invalidate the current bearish structure.
This could open a path toward reclaiming higher levels.
⚠️ Notes
Market remains vulnerable while below resistance, so watch for rejection signals or continuation patterns

