
The price of Bitcoin hovers around $105,300, down about 0.8% in the last 24 hours and about 5% this month. However, this week seems surprisingly stable. After a brief drop near $100,000, Bitcoin managed to recover — even with selling pressure rising sharply.
This divergence between increasing selling pressure and relatively stable prices indicates that something deeper is happening beneath the surface.
The data shows a selling pressure increase of over 1,300%
Chain data from spent outputs by age bands — which track how old coins transferred to exchanges are — reveals a sharp increase in BTC selling.
Short-term holders (wallets from one day to a week) raised their transfers to exchanges from 470 BTC on November 8th to 6,695 BTC on November 10th, recording an increase of over 1,300%.
At the same time, medium-term holders (wallets from six months to a year) increased their flows to exchanges from 268 BTC to 1,125 BTC. This represents an increase of nearly 300% in selling pressure. This surge shows that short- and medium-term investors are taking their profits, which is usually a sign of waning confidence or profit-taking at resistance areas.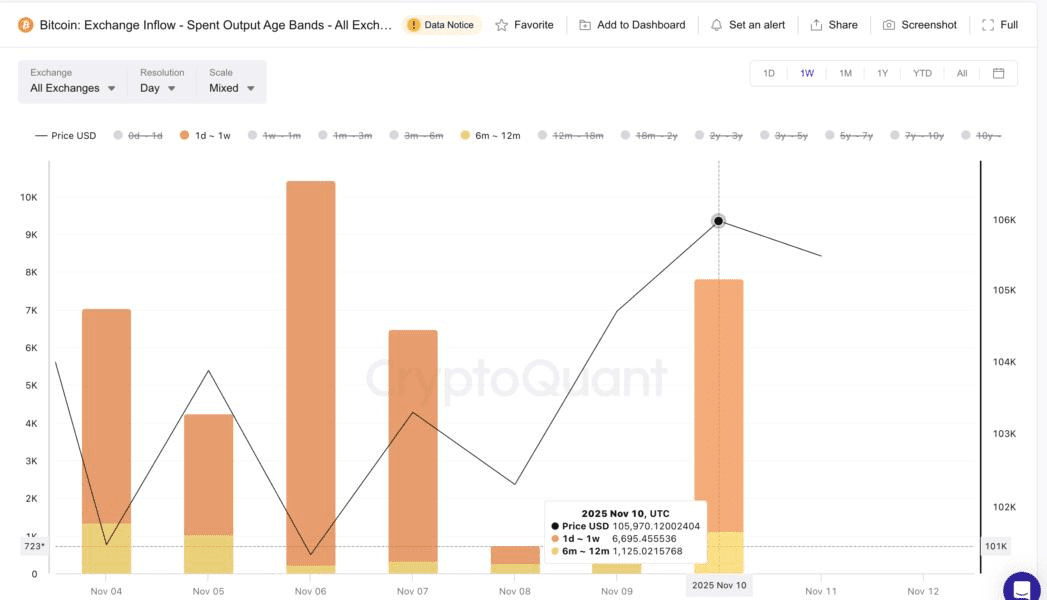
Want more insights on cryptocurrencies? Sign up for the daily crypto newsletter from editor Harsh Notaria here.
Typically, this influx to exchanges pressures prices downward. But this time, the market managed to hold steady — hinting at new demand coming in to match sell orders.
A bullish crossover signal looms indicating that the recovery may gain strength
A short-term technical signal supports this resilience. The exponential moving average (EMA), which allows price data to determine trend direction faster than a simple moving average, is now showing a new bullish crossover. The 20-period EMA is approaching the 50-period average, and when the shorter average crosses above the longer one, it often indicates momentum strengthening.
The last time this pattern appeared — around October 25th — Bitcoin rose over 5% within days.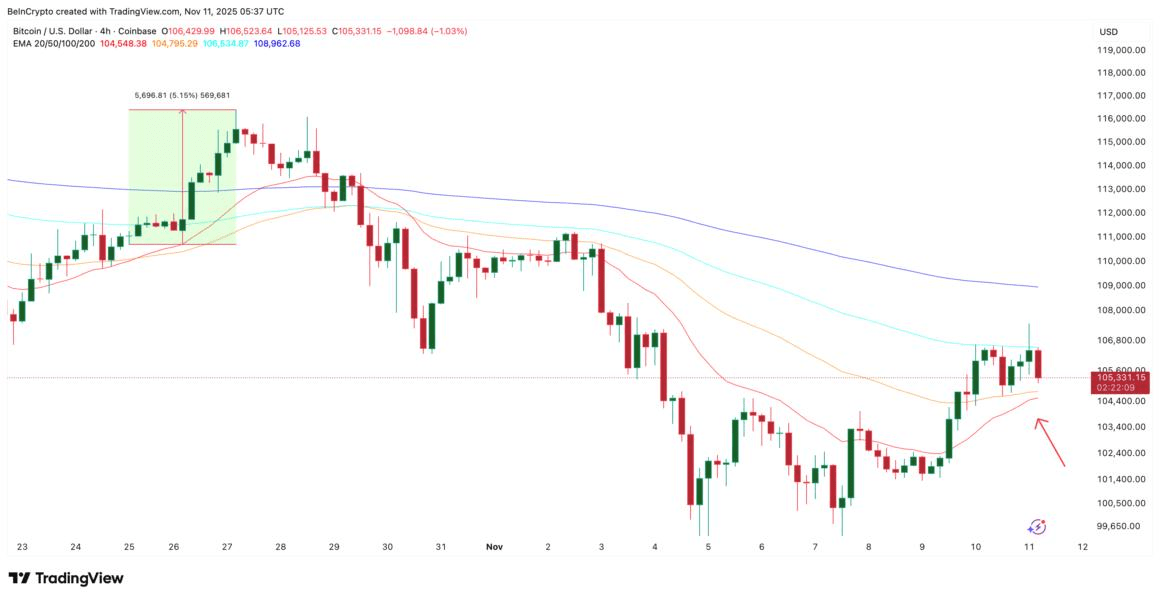
This suggests that despite the large selling, the underlying momentum may be on its way to recovery again. Traders are closely watching to see if this crossover will complete, as it would confirm that buying pressure is increasing beneath the surface.
Large holders are stepping in as key Bitcoin price levels determine the next move
Reinforcing the recovery thesis, whale wallet data indicates an increase in accumulation. The number of entities holding over 1,000 btc rose from 1,362 to 1,388 between November 6th and 10th, a rise of about 1.9%.
This means at the current price adding over 26,000 btc (around $2.7 billion) to large wallets — enough to absorb a significant share of short-term selling.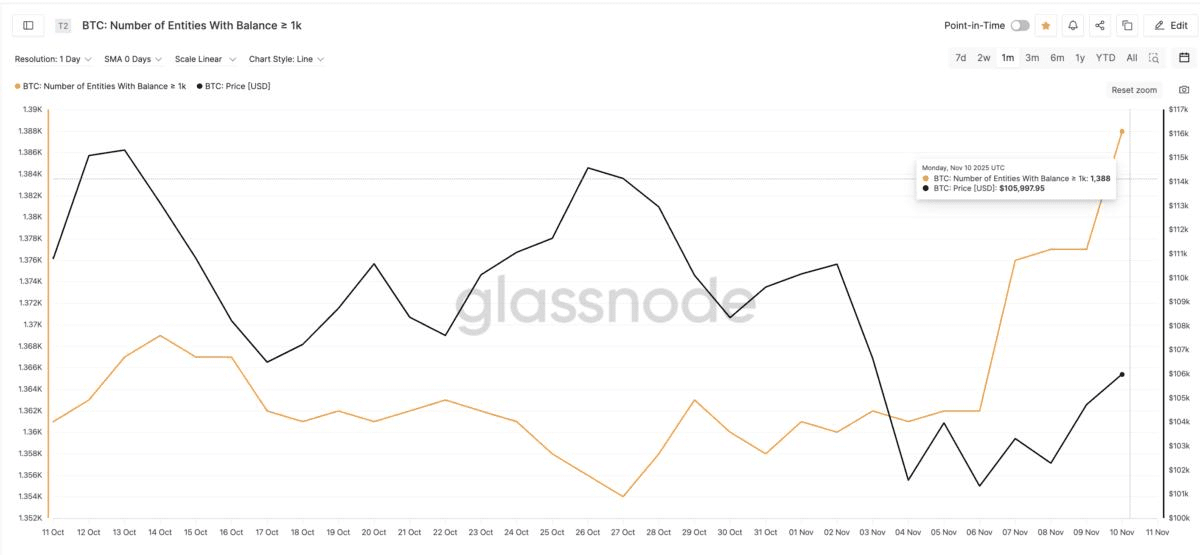
Continued accumulation could support Bitcoin's recovery and help test key resistance levels. The first test is at $105,500 — an area that has rejected moves since November 9th.
A clean daily close above this price could open the door to $109,700, which has capped Bitcoin's highs since October 31st. Following that, targets include $112,600 and $116,400. However, this type of price movement for Bitcoin requires sustained whale interest and alleviation of class-based selling.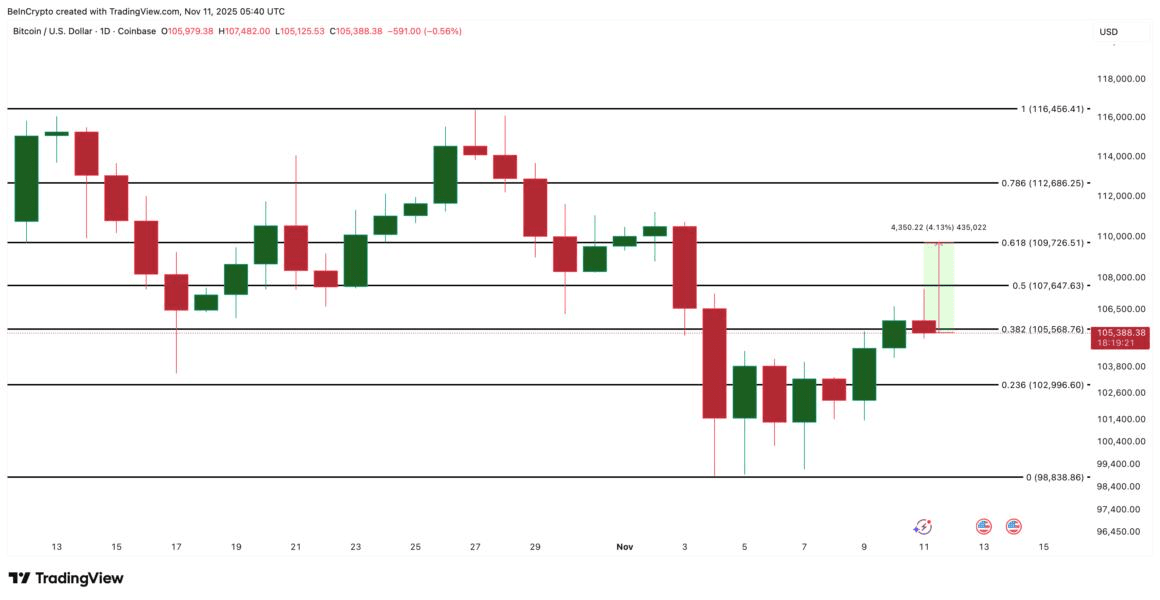
However, a daily close below $102,900 could weaken the structure and reveal $98,800, negating the short-term bullish setup.
📲 Stay updated with #CryptoEmad to get instant analyses and hot moves in the cryptocurrency market!

