Bitcoin price has started a rebound wave, trading price has surpassed $114,000. BTC trading price has surpassed $114,000 and is facing resistance around $115,000......

Bitcoin price has started a recovery wave, trading price has surpassed $114,000. BTC trading price has surpassed $114,000 and is facing resistance around $115,000.
Bitcoin has started a new round of recovery above the $113,500 region.
Trading price is above $114,000 and the 100-hour simple moving average.
On the hourly chart of BTC/USD, it has broken through a key bearish trend line, with resistance at $112,200 (data from Kraken).
If it breaks through the $115,000 area, this currency pair may continue to rise.
Bitcoin price rises
Bitcoin price successfully maintains above the $110,500 area and begins a wave of recovery. BTC stabilizes above the $112,500 resistance area, beginning the current trend.
Bulls successfully pushed the price above $113,500 and $114,000. In addition, the BTC/USD currency pair on the hourly chart broke through a key bearish trend line (resistance at $112,200). Bulls even broke through the $114,000 level.
The peak formed at $114,771, and the current price is consolidating its upward momentum, breaking through the 23.6% Fibonacci retracement level from the low of $108,677 to the high of $114,771. Bitcoin is currently trading above $114,000, above the 100-hour simple moving average.
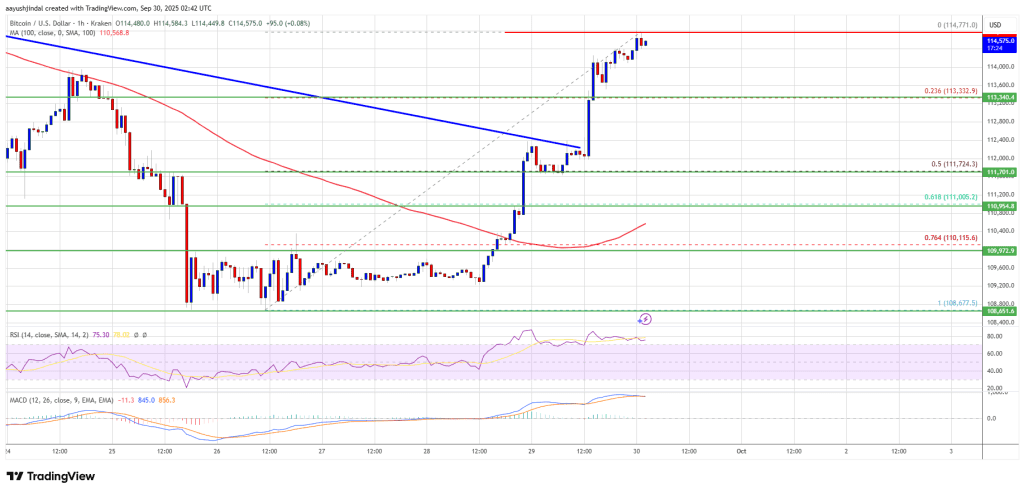
The direct resistance level in the upward direction is near $114,750. The first key resistance level is around $115,000. The next resistance level might be $115,500. If the closing price breaks through the $115,500 resistance level, it could further drive up the price. In this case, the price may rise and test the resistance level of $116,500. If it continues to rise, the price may drop towards $117,500. The next resistance level for bulls may be $118,000.
Is BTC falling again?
If Bitcoin fails to break through the $115,000 resistance level, it may trigger a new round of declines. The current support level is near $113,500. The first major support level is around $112,500.
Currently, the next support level is near $111,750. If the price falls further, it may short-term drop towards the support level of $111,200. The major support level is at $110,500; if this support level is broken, BTC may struggle to rebound in the short term.
Technical Indicators:
Hourly MACD – The MACD is currently accelerating in the bullish zone.
Hourly RSI (Relative Strength Index) - The RSI for BTC/USD is now above the 50 level.
Major support level - $113,500, followed by $112,500.
Major resistance levels - $114,750 and $115,000.
I am (Jun Ge Crypto), with 7 years of deep involvement in the crypto space, mastering short-term strategies and having a systematic approach to mid-long term layouts. Accurately capturing optimal trading opportunities, I provide you with timely information to empower your investment decisions. Choose the right direction and find the right rhythm; here you will find the professional perspective you need.$BTC