
The Cryptonomist
17.9k Posts

The Cryptonomist
 Square Verified+
Report
Block User
0 Following
38.0K+ Followers
22.5K+ Liked
1 Badges
Posts

Article
AIBC World 2026 countdown begins ahead of Rome’s frontier technology summitThe countdown to AIBC World 2026 has begun, alongside anticipation building ahead of one of Europe’s most significant gatherings dedicated to frontier technology this November. Rome will become the meeting point for leaders across AI, blockchain, fintech, gaming and digital innovation as AIBC World brings together the companies, investors and decision-makers shaping the next stage of the digital economy.
Under the theme of connecting frontier technology with real-world applications and digital scalability, AIBC World 2026 will unite AIBC, SiGMA, FX.World and AGS for a major cross-industry gathering focused on collaboration, innovation and business opportunities.
The event is set to welcome 1,000 exhibitors, 300 speakers and 30,000 delegates, creating a global platform where technology leaders, entrepreneurs and investors can connect, exchange ideas and explore new opportunities across emerging sectors.
AIBC Hall: a dedicated hub for blockchain and AI innovation
One of the major highlights of AIBC World 2026 is the introduction of the new AIBC Hall at Fiera Roma.
Located in Hall 7, the dedicated space will bring together blockchain and AI service provider (PSP) companies in a single, concentrated environment. Recognised as one of Europe’s largest dedicated blockchain expo spaces, the AIBC Hall will provide attendees with direct access to the infrastructure providers, exchanges, custody solutions driving the evolution of the digital economy.
Beyond the exhibition floor, the AIBC Hall will also feature a dedicated AIBC Stage, hosting expert-led panels and discussions covering the latest developments, challenges and opportunities across blockchain, AI and emerging technologies.
By combining exhibition, thought leadership, and industry connections in one space, AIBC Hall will create a dedicated environment for companies, innovators, and decision-makers to exchange ideas, build partnerships, and explore the technologies of digital industries.
A global platform for innovation, business and collaboration
Hosted at Fiera Roma, one of Europe’s largest exhibition venues, AIBC World 2026 will provide the scale and facilities required to welcome thousands of international attendees.
Across the exhibition floor and conference stages, visitors can expect perspectives on the latest developments across blockchain, artificial intelligence, digital assets and emerging technologies. The event will bring together established industry players, innovative startups, and technology pioneers to discuss the trends shaping the global digital landscape.
Confirmed exhibitors include leading names such as Blockchain.com, Transak, Gate, CertiK, BitGo, Fireblocks, Bybit, BIT.COM, Chainalysis, TradingView and Alchemy Pay.
The conference programme will feature influential founders, investors, policymakers and technology executives, including Tim Draper, Founder of Draper Associates; Reeve Collins, Chairman and Co-Founder of STBL & WeFi; Felix Fan, CEO of Trust Wallet; Arthur Breitman, Co-Founder of Tezos; and Brando Benifei, Member of the European Parliament.
Spotlighting emerging technology startups
AIBC World 2026 will continue to support the next generation of innovators through the AIBC Startup Pitch competition.
Open to startups working across crypto, blockchain, Web3 and artificial intelligence, the competition provides selected founders with the opportunity to present their solutions to investors, accelerators and industry leaders. Six finalists will advance to the live on-stage competition, showcasing high-potential projects from across the global emerging technology ecosystem.
Networking opportunities beyond the exhibition floor
Beyond the exhibition and conference programme, AIBC World 2026 will offer exclusive opportunities for attendees to connect with global technology leaders, investors and innovators.
From the iGathering Networking Cocktail at Lanterna di Fuksas and the SiGMA Nexus Elite Golf Tour to the AIBC & FX Awards, the event will bring together the community through a series of premium experiences. Held in the historic setting of Rome, the AIBC & FX Awards will celebrate the leading performers across AI, crypto, blockchain, fintech and emerging technology, with winners announced during an exclusive ceremony featuring recognition, connection and a charitable art auction.
Join AIBC World 2026 in Rome
As AI, blockchain and digital finance continue to reshape industries worldwide, AIBC World 2026 arrives at a defining time for the technology ecosystem.
With a dedicated exhibition hall, a strong international speaker lineup, leading exhibitors and a programme designed around innovation and collaboration, the event is set to become a key meeting point for those building, investing in and shaping the future of frontier technology.
As Rome prepares to welcome the global technology community this November, now is the time to secure your place at AIBC World 2026 and join the conversations driving the industry forward.
AIBC World 2026 countdown begins ahead of Rome’s frontier technology summit
The countdown to AIBC World 2026 has begun, alongside anticipation building ahead of one of Europe’s most significant gatherings dedicated to frontier technology this November. Rome will become the meeting point for leaders across AI, blockchain, fintech, gaming and digital innovation as AIBC World brings together the companies, investors and decision-makers shaping the next stage of the digital economy.
Under the theme of connecting frontier technology with real-world applications and digital scalability, AIBC World 2026 will unite AIBC, SiGMA, FX.World and AGS for a major cross-industry gathering focused on collaboration, innovation and business opportunities.
The event is set to welcome 1,000 exhibitors, 300 speakers and 30,000 delegates, creating a global platform where technology leaders, entrepreneurs and investors can connect, exchange ideas and explore new opportunities across emerging sectors.
AIBC Hall: a dedicated hub for blockchain and AI innovation
One of the major highlights of AIBC World 2026 is the introduction of the new AIBC Hall at Fiera Roma.
Located in Hall 7, the dedicated space will bring together blockchain and AI service provider (PSP) companies in a single, concentrated environment. Recognised as one of Europe’s largest dedicated blockchain expo spaces, the AIBC Hall will provide attendees with direct access to the infrastructure providers, exchanges, custody solutions driving the evolution of the digital economy.
Beyond the exhibition floor, the AIBC Hall will also feature a dedicated AIBC Stage, hosting expert-led panels and discussions covering the latest developments, challenges and opportunities across blockchain, AI and emerging technologies.
By combining exhibition, thought leadership, and industry connections in one space, AIBC Hall will create a dedicated environment for companies, innovators, and decision-makers to exchange ideas, build partnerships, and explore the technologies of digital industries.
A global platform for innovation, business and collaboration
Hosted at Fiera Roma, one of Europe’s largest exhibition venues, AIBC World 2026 will provide the scale and facilities required to welcome thousands of international attendees.
Across the exhibition floor and conference stages, visitors can expect perspectives on the latest developments across blockchain, artificial intelligence, digital assets and emerging technologies. The event will bring together established industry players, innovative startups, and technology pioneers to discuss the trends shaping the global digital landscape.
Confirmed exhibitors include leading names such as Blockchain.com, Transak, Gate, CertiK, BitGo, Fireblocks, Bybit, BIT.COM, Chainalysis, TradingView and Alchemy Pay.
The conference programme will feature influential founders, investors, policymakers and technology executives, including Tim Draper, Founder of Draper Associates; Reeve Collins, Chairman and Co-Founder of STBL & WeFi; Felix Fan, CEO of Trust Wallet; Arthur Breitman, Co-Founder of Tezos; and Brando Benifei, Member of the European Parliament.
Spotlighting emerging technology startups
AIBC World 2026 will continue to support the next generation of innovators through the AIBC Startup Pitch competition.
Open to startups working across crypto, blockchain, Web3 and artificial intelligence, the competition provides selected founders with the opportunity to present their solutions to investors, accelerators and industry leaders. Six finalists will advance to the live on-stage competition, showcasing high-potential projects from across the global emerging technology ecosystem.
Networking opportunities beyond the exhibition floor
Beyond the exhibition and conference programme, AIBC World 2026 will offer exclusive opportunities for attendees to connect with global technology leaders, investors and innovators.
From the iGathering Networking Cocktail at Lanterna di Fuksas and the SiGMA Nexus Elite Golf Tour to the AIBC & FX Awards, the event will bring together the community through a series of premium experiences. Held in the historic setting of Rome, the AIBC & FX Awards will celebrate the leading performers across AI, crypto, blockchain, fintech and emerging technology, with winners announced during an exclusive ceremony featuring recognition, connection and a charitable art auction.
Join AIBC World 2026 in Rome
As AI, blockchain and digital finance continue to reshape industries worldwide, AIBC World 2026 arrives at a defining time for the technology ecosystem.
With a dedicated exhibition hall, a strong international speaker lineup, leading exhibitors and a programme designed around innovation and collaboration, the event is set to become a key meeting point for those building, investing in and shaping the future of frontier technology.
As Rome prepares to welcome the global technology community this November, now is the time to secure your place at AIBC World 2026 and join the conversations driving the industry forward.
Under the theme of connecting frontier technology with real-world applications and digital scalability, AIBC World 2026 will unite AIBC, SiGMA, FX.World and AGS for a major cross-industry gathering focused on collaboration, innovation and business opportunities.
The event is set to welcome 1,000 exhibitors, 300 speakers and 30,000 delegates, creating a global platform where technology leaders, entrepreneurs and investors can connect, exchange ideas and explore new opportunities across emerging sectors.
AIBC Hall: a dedicated hub for blockchain and AI innovation
One of the major highlights of AIBC World 2026 is the introduction of the new AIBC Hall at Fiera Roma.
Located in Hall 7, the dedicated space will bring together blockchain and AI service provider (PSP) companies in a single, concentrated environment. Recognised as one of Europe’s largest dedicated blockchain expo spaces, the AIBC Hall will provide attendees with direct access to the infrastructure providers, exchanges, custody solutions driving the evolution of the digital economy.
Beyond the exhibition floor, the AIBC Hall will also feature a dedicated AIBC Stage, hosting expert-led panels and discussions covering the latest developments, challenges and opportunities across blockchain, AI and emerging technologies.
By combining exhibition, thought leadership, and industry connections in one space, AIBC Hall will create a dedicated environment for companies, innovators, and decision-makers to exchange ideas, build partnerships, and explore the technologies of digital industries.
A global platform for innovation, business and collaboration
Hosted at Fiera Roma, one of Europe’s largest exhibition venues, AIBC World 2026 will provide the scale and facilities required to welcome thousands of international attendees.
Across the exhibition floor and conference stages, visitors can expect perspectives on the latest developments across blockchain, artificial intelligence, digital assets and emerging technologies. The event will bring together established industry players, innovative startups, and technology pioneers to discuss the trends shaping the global digital landscape.
Confirmed exhibitors include leading names such as Blockchain.com, Transak, Gate, CertiK, BitGo, Fireblocks, Bybit, BIT.COM, Chainalysis, TradingView and Alchemy Pay.
The conference programme will feature influential founders, investors, policymakers and technology executives, including Tim Draper, Founder of Draper Associates; Reeve Collins, Chairman and Co-Founder of STBL & WeFi; Felix Fan, CEO of Trust Wallet; Arthur Breitman, Co-Founder of Tezos; and Brando Benifei, Member of the European Parliament.
Spotlighting emerging technology startups
AIBC World 2026 will continue to support the next generation of innovators through the AIBC Startup Pitch competition.
Open to startups working across crypto, blockchain, Web3 and artificial intelligence, the competition provides selected founders with the opportunity to present their solutions to investors, accelerators and industry leaders. Six finalists will advance to the live on-stage competition, showcasing high-potential projects from across the global emerging technology ecosystem.
Networking opportunities beyond the exhibition floor
Beyond the exhibition and conference programme, AIBC World 2026 will offer exclusive opportunities for attendees to connect with global technology leaders, investors and innovators.
From the iGathering Networking Cocktail at Lanterna di Fuksas and the SiGMA Nexus Elite Golf Tour to the AIBC & FX Awards, the event will bring together the community through a series of premium experiences. Held in the historic setting of Rome, the AIBC & FX Awards will celebrate the leading performers across AI, crypto, blockchain, fintech and emerging technology, with winners announced during an exclusive ceremony featuring recognition, connection and a charitable art auction.
Join AIBC World 2026 in Rome
As AI, blockchain and digital finance continue to reshape industries worldwide, AIBC World 2026 arrives at a defining time for the technology ecosystem.
With a dedicated exhibition hall, a strong international speaker lineup, leading exhibitors and a programme designed around innovation and collaboration, the event is set to become a key meeting point for those building, investing in and shaping the future of frontier technology.
As Rome prepares to welcome the global technology community this November, now is the time to secure your place at AIBC World 2026 and join the conversations driving the industry forward.
65

Article
Europe’s Premier FX, Crypto & Fintech Event – Wiki Finance Expo Cyprus 2026 is Coming to Limassol...Limassol, Cyprus – Mark your calendars for WIKIEXPO CYPRUS 2026, taking place on November 6, 2026 at the prestigious Parklane, a Luxury Collection Resort & Spa. As one of Europe’s most influential gatherings for the foreign exchange and fintech services industry, the event is set to welcome over 5,000 professionals, 50+ distinguished speakers, and 50+ exhibitors from more than 30 countries.
This year’s expo places a strategic focus on the core pillars that drive today’s financial markets, with dedicated tracks on:
Foreign Exchange & Liquidity Solutions – Institutional FX, prime brokerage, liquidity aggregation, and risk management
Regulatory & Compliance Frameworks – Navigating MiCA, CySEC regulations, AML/KYC, and cross-border licensing
Next-Generation Payments – Cross-border remittance, digital wallets, instant settlement, and merchant services
Platform Building & Brokerage Technology – Trading platforms (MT4/5, cTrader, proprietary), white-label solutions, CRM, and infrastructure providers
Fintech Service Providers – B2B technology vendors, data analytics, AI-driven trading tools, and compliance automation
Crypto & DeFi – On-chain liquidity, tokenized assets, smart contract-based settlement, and the convergence of crypto with traditional FX
AI in Finance – AI-powered trading algorithms, predictive analytics, fraud detection, and regulatory technology (RegTech)
Set in the heart of Cyprus – a global hub for forex brokers, payment processors, and regulatory technology firms – this expo offers an unrivalled platform for service providers, brokers, IBs, liquidity providers, payment gateways, and platform vendors to connect, showcase innovations, and forge cross-border partnerships. Backed by CySEC’s stringent oversight and EU-wide passporting privileges, this jurisdiction empowers firms to scale operations across the European Economic Area, all while staying ahead of the crypto and AI waves reshaping the industry.
Attendees will gain actionable insights through keynote addresses, panel debates, fireside chats, and dedicated networking sessions, all designed to address the real-world challenges and opportunities facing the FX, fintech, and digital asset ecosystem.
“Cyprus has long been recognized as a gateway between Europe, Asia, and Africa, with a robust regulatory environment and a thriving community of financial technology providers,” said Loki So, COO of WikiEXPO. “Our Cyprus edition is uniquely tailored to the FX, liquidity, payments, and platform-building sectors – but we also recognize that crypto and AI are no longer optional. We aim to bring together the entire value chain of service providers – from traditional brokers to cutting-edge DeFi protocols and AI-driven analytics firms – under one roof to drive responsible innovation and sustainable growth in this dynamic region.”
How to Participate:
The Only Official Free Registration Link:
https://www.wikiexpo.com/Cyprus/2026/en/?c=7iil3INU
Sponsorship & Exhibiting Opportunities:
Secure a prime booth or exclusive sponsorship package – ideal for liquidity providers, trading platform vendors, payment solution companies, regulatory tech firms, Web3 infrastructure projects, and AI fintech startups.
Contact Name: Loki So
Email Address: loki@wikiexpo.com
Telegram: https://t.me/Loki_wikiexpo_coo
LinkedIn ID: https://www.linkedin.com/in/loki-so-33826318a/
About WikiEXPO
WikiEXPO is a global hub for financial innovation, uniting visionaries and leaders in fintech, forex, and crypto industries. With a worldwide community of over two million followers, our iconic summits are held in global capitals including Dubai, Hong Kong, Cyprus, Bangkok, Singapore, Sydney, South Africa, and beyond. From cutting-edge startups to industry giants, we connect the brightest minds. After six years of rapid development, WikiEXPO has become one of the world’s largest and most influential event platforms in the forex, fintech, and digital asset space.
Past Speakers at WikiEXPO (selected):
Dominic Williams – Founder & Chief Scientist, DFINITY Foundation
Evan Auyang Chi-chun – Group President, Animoca Brands
Justin Sun – Founder, TRON; Member, HTX Global Advisory Board
Reeve Collins – Co-Founder, Tether
Cynthia Wu – Founding Partner and CCO, BIT
Livio Weng – CEO & Executive Director, Bitfire
Kevin Lee – CCO, Gate
Mario Nawfal – CEO, IBC Group
Yiannos Ashiotis – Board Chairman – Revolut Digital Assets Europe
John Riggins – Partner, BTC Inc
Loretta Joseph – Policy Consultant, The Commonwealth; Chairman, ADFSAC
Vít Jedlička, President, Free Republic of Liberland
Bugra Celik – Director, Digital Assets | Global Private Banking & Wealth, HSBC
Hassan Ahmed – Country Director, Coinbase Singapore
We look forward to welcoming you to Limassol this November – where the FX, fintech, and crypto communities converge to shape the future of finance!
Europe’s Premier FX, Crypto & Fintech Event – Wiki Finance Expo Cyprus 2026 is Coming to Limassol...
Limassol, Cyprus – Mark your calendars for WIKIEXPO CYPRUS 2026, taking place on November 6, 2026 at the prestigious Parklane, a Luxury Collection Resort & Spa. As one of Europe’s most influential gatherings for the foreign exchange and fintech services industry, the event is set to welcome over 5,000 professionals, 50+ distinguished speakers, and 50+ exhibitors from more than 30 countries.
This year’s expo places a strategic focus on the core pillars that drive today’s financial markets, with dedicated tracks on:
Foreign Exchange & Liquidity Solutions – Institutional FX, prime brokerage, liquidity aggregation, and risk management
Regulatory & Compliance Frameworks – Navigating MiCA, CySEC regulations, AML/KYC, and cross-border licensing
Next-Generation Payments – Cross-border remittance, digital wallets, instant settlement, and merchant services
Platform Building & Brokerage Technology – Trading platforms (MT4/5, cTrader, proprietary), white-label solutions, CRM, and infrastructure providers
Fintech Service Providers – B2B technology vendors, data analytics, AI-driven trading tools, and compliance automation
Crypto & DeFi – On-chain liquidity, tokenized assets, smart contract-based settlement, and the convergence of crypto with traditional FX
AI in Finance – AI-powered trading algorithms, predictive analytics, fraud detection, and regulatory technology (RegTech)
Set in the heart of Cyprus – a global hub for forex brokers, payment processors, and regulatory technology firms – this expo offers an unrivalled platform for service providers, brokers, IBs, liquidity providers, payment gateways, and platform vendors to connect, showcase innovations, and forge cross-border partnerships. Backed by CySEC’s stringent oversight and EU-wide passporting privileges, this jurisdiction empowers firms to scale operations across the European Economic Area, all while staying ahead of the crypto and AI waves reshaping the industry.
Attendees will gain actionable insights through keynote addresses, panel debates, fireside chats, and dedicated networking sessions, all designed to address the real-world challenges and opportunities facing the FX, fintech, and digital asset ecosystem.
“Cyprus has long been recognized as a gateway between Europe, Asia, and Africa, with a robust regulatory environment and a thriving community of financial technology providers,” said Loki So, COO of WikiEXPO. “Our Cyprus edition is uniquely tailored to the FX, liquidity, payments, and platform-building sectors – but we also recognize that crypto and AI are no longer optional. We aim to bring together the entire value chain of service providers – from traditional brokers to cutting-edge DeFi protocols and AI-driven analytics firms – under one roof to drive responsible innovation and sustainable growth in this dynamic region.”
How to Participate:
The Only Official Free Registration Link:
https://www.wikiexpo.com/Cyprus/2026/en/?c=7iil3INU
Sponsorship & Exhibiting Opportunities:
Secure a prime booth or exclusive sponsorship package – ideal for liquidity providers, trading platform vendors, payment solution companies, regulatory tech firms, Web3 infrastructure projects, and AI fintech startups.
Contact Name: Loki So
Email Address: loki@wikiexpo.com
Telegram: https://t.me/Loki_wikiexpo_coo
LinkedIn ID: https://www.linkedin.com/in/loki-so-33826318a/
About WikiEXPO
WikiEXPO is a global hub for financial innovation, uniting visionaries and leaders in fintech, forex, and crypto industries. With a worldwide community of over two million followers, our iconic summits are held in global capitals including Dubai, Hong Kong, Cyprus, Bangkok, Singapore, Sydney, South Africa, and beyond. From cutting-edge startups to industry giants, we connect the brightest minds. After six years of rapid development, WikiEXPO has become one of the world’s largest and most influential event platforms in the forex, fintech, and digital asset space.
Past Speakers at WikiEXPO (selected):
Dominic Williams – Founder & Chief Scientist, DFINITY Foundation
Evan Auyang Chi-chun – Group President, Animoca Brands
Justin Sun – Founder, TRON; Member, HTX Global Advisory Board
Reeve Collins – Co-Founder, Tether
Cynthia Wu – Founding Partner and CCO, BIT
Livio Weng – CEO & Executive Director, Bitfire
Kevin Lee – CCO, Gate
Mario Nawfal – CEO, IBC Group
Yiannos Ashiotis – Board Chairman – Revolut Digital Assets Europe
John Riggins – Partner, BTC Inc
Loretta Joseph – Policy Consultant, The Commonwealth; Chairman, ADFSAC
Vít Jedlička, President, Free Republic of Liberland
Bugra Celik – Director, Digital Assets | Global Private Banking & Wealth, HSBC
Hassan Ahmed – Country Director, Coinbase Singapore
We look forward to welcoming you to Limassol this November – where the FX, fintech, and crypto communities converge to shape the future of finance!
This year’s expo places a strategic focus on the core pillars that drive today’s financial markets, with dedicated tracks on:
Foreign Exchange & Liquidity Solutions – Institutional FX, prime brokerage, liquidity aggregation, and risk management
Regulatory & Compliance Frameworks – Navigating MiCA, CySEC regulations, AML/KYC, and cross-border licensing
Next-Generation Payments – Cross-border remittance, digital wallets, instant settlement, and merchant services
Platform Building & Brokerage Technology – Trading platforms (MT4/5, cTrader, proprietary), white-label solutions, CRM, and infrastructure providers
Fintech Service Providers – B2B technology vendors, data analytics, AI-driven trading tools, and compliance automation
Crypto & DeFi – On-chain liquidity, tokenized assets, smart contract-based settlement, and the convergence of crypto with traditional FX
AI in Finance – AI-powered trading algorithms, predictive analytics, fraud detection, and regulatory technology (RegTech)
Set in the heart of Cyprus – a global hub for forex brokers, payment processors, and regulatory technology firms – this expo offers an unrivalled platform for service providers, brokers, IBs, liquidity providers, payment gateways, and platform vendors to connect, showcase innovations, and forge cross-border partnerships. Backed by CySEC’s stringent oversight and EU-wide passporting privileges, this jurisdiction empowers firms to scale operations across the European Economic Area, all while staying ahead of the crypto and AI waves reshaping the industry.
Attendees will gain actionable insights through keynote addresses, panel debates, fireside chats, and dedicated networking sessions, all designed to address the real-world challenges and opportunities facing the FX, fintech, and digital asset ecosystem.
“Cyprus has long been recognized as a gateway between Europe, Asia, and Africa, with a robust regulatory environment and a thriving community of financial technology providers,” said Loki So, COO of WikiEXPO. “Our Cyprus edition is uniquely tailored to the FX, liquidity, payments, and platform-building sectors – but we also recognize that crypto and AI are no longer optional. We aim to bring together the entire value chain of service providers – from traditional brokers to cutting-edge DeFi protocols and AI-driven analytics firms – under one roof to drive responsible innovation and sustainable growth in this dynamic region.”
How to Participate:
The Only Official Free Registration Link:
https://www.wikiexpo.com/Cyprus/2026/en/?c=7iil3INU
Sponsorship & Exhibiting Opportunities:
Secure a prime booth or exclusive sponsorship package – ideal for liquidity providers, trading platform vendors, payment solution companies, regulatory tech firms, Web3 infrastructure projects, and AI fintech startups.
Contact Name: Loki So
Email Address: loki@wikiexpo.com
Telegram: https://t.me/Loki_wikiexpo_coo
LinkedIn ID: https://www.linkedin.com/in/loki-so-33826318a/
About WikiEXPO
WikiEXPO is a global hub for financial innovation, uniting visionaries and leaders in fintech, forex, and crypto industries. With a worldwide community of over two million followers, our iconic summits are held in global capitals including Dubai, Hong Kong, Cyprus, Bangkok, Singapore, Sydney, South Africa, and beyond. From cutting-edge startups to industry giants, we connect the brightest minds. After six years of rapid development, WikiEXPO has become one of the world’s largest and most influential event platforms in the forex, fintech, and digital asset space.
Past Speakers at WikiEXPO (selected):
Dominic Williams – Founder & Chief Scientist, DFINITY Foundation
Evan Auyang Chi-chun – Group President, Animoca Brands
Justin Sun – Founder, TRON; Member, HTX Global Advisory Board
Reeve Collins – Co-Founder, Tether
Cynthia Wu – Founding Partner and CCO, BIT
Livio Weng – CEO & Executive Director, Bitfire
Kevin Lee – CCO, Gate
Mario Nawfal – CEO, IBC Group
Yiannos Ashiotis – Board Chairman – Revolut Digital Assets Europe
John Riggins – Partner, BTC Inc
Loretta Joseph – Policy Consultant, The Commonwealth; Chairman, ADFSAC
Vít Jedlička, President, Free Republic of Liberland
Bugra Celik – Director, Digital Assets | Global Private Banking & Wealth, HSBC
Hassan Ahmed – Country Director, Coinbase Singapore
We look forward to welcoming you to Limassol this November – where the FX, fintech, and crypto communities converge to shape the future of finance!
4
Article
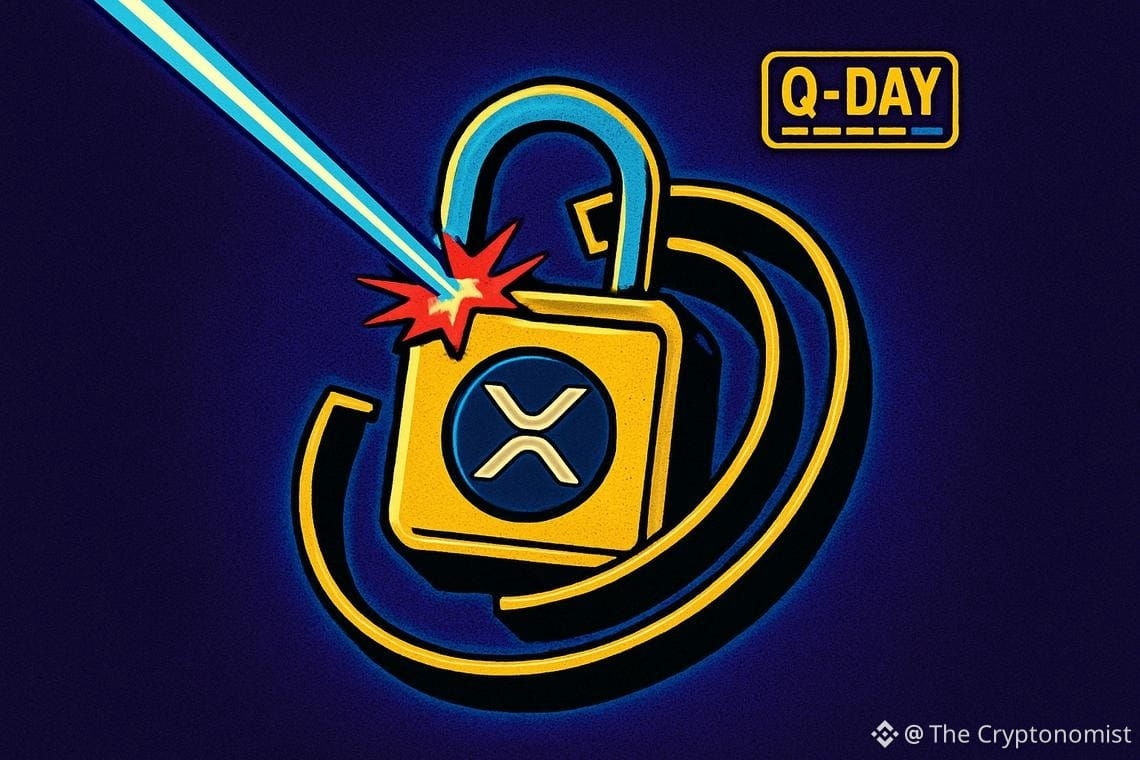
Ripple XRP quantum security plan races to beat a 9-minute hacking threat by 2028Ripple isn’t waiting for a crisis to force its hand. Engineers at the payments-focused blockchain firm are moving now to strengthen Ripple XRP quantum security years before quantum computers are expected to pose any real danger to blockchain networks, rolling out a four-stage roadmap designed to protect the XRP Ledger long before the day researchers call “Q-Day” ever arrives.
Key takeaways
A four-stage plan has been presented by Ripple to ready the XRP Ledger against quantum computers capable of potentially revealing private keys.
The strategy includes assessing vulnerabilities, testing quantum-resistant cryptography, running old and new security systems in parallel, and keeping an emergency response ready.
A separate report from Crypto Briefing ties the effort to a broader roadmap targeting full quantum readiness by 2028, with testing of NIST-standard algorithms like ML-DSA and Dilithium already underway alongside Project Eleven.
Google’s Quantum AI team estimated in March 2026 that just 500,000 physical qubits could be enough to derive a private key from an exposed public key in roughly nine minutes.
An independent audit cited by Crypto Briefing found only 0.03% of XRP’s total supply sits in dormant accounts with exposed public keys, a much smaller exposure than Bitcoin’s older P2PK addresses.
Ripple’s Four-Stage Plan to Quantum-Proof the XRP Ledger
Ripple’s response to the quantum question is built as a long-term infrastructure project rather than a rushed patch job. “The goal is not to wait until quantum computing becomes an immediate threat,” Ayo Akinyele, Ripple’s senior director of engineering, told CoinDesk. “It is to make sure critical financial infrastructure can evolve well before that point without disrupting the systems, assets and users that depend on it.”
Assessing vulnerabilities and testing new cryptography
The plan begins with a network-wide audit to identify which parts of the XRP Ledger would be exposed if current cryptography failed. From there, Ripple moves into testing alternative cryptographic methods against the actual workload the ledger handles today, rather than in isolated lab conditions. According to Crypto Briefing, that testing phase is already underway, with Ripple evaluating NIST-standard post-quantum algorithms, specifically ML-DSA and Dilithium, in partnership with Project Eleven, a firm focused on quantum security research and benchmarking. The collaboration is meant to confirm that adding quantum resistance doesn’t slow the network down or degrade the experience for everyday users.
Parallel operation and emergency readiness
Later stages call for running today’s security alongside quantum-resistant alternatives at the same time, a dual-track approach meant to smooth the eventual handover rather than force it in one disruptive leap. Ripple has also built in an emergency route in case quantum computing advances faster than expected. Crypto Briefing describes this as “Phase 1: Q-Day readiness,” an emergency contingency designed to trigger rapid migration of accounts to quantum-safe alternatives if a credible threat emerges before the full upgrade is finished. Testnet deployments were expected throughout mid-2026, with Ripple aiming for full quantum readiness by 2028.
Why Quantum Computing Threatens Blockchain Security
The danger is mathematical, not theoretical folklore. A sufficiently powerful quantum computer could eventually work backwards from publicly available information to calculate the private keys that control digital assets, breaking protections that both blockchains and traditional banks currently rely on.
That threat gained sharper definition in March 2026, when Google’s Quantum AI team estimated that around 500,000 physical qubits could be enough to break elliptic curve cryptography, the mathematical backbone protecting private keys across nearly every blockchain. At that scale, a quantum machine could reportedly derive a private key from an exposed public key in about nine minutes. Previous estimates had assumed millions of qubits would be required, and the sharply lower figure compressed the timeline the industry believed it had to work with.
AI is accelerating the pressure on cryptography
Quantum computing isn’t the only force squeezing the timeline. AI systems are increasingly used to hunt for flaws in cryptography, work that once took specialist researchers far longer to complete. That creates a second, tougher problem: any system built to resist quantum attacks must also hold up against faster, cheaper AI crypto attacks that don’t need a quantum computer at all. Akinyele said the two forces are technically distinct but are pushing the industry in the same direction. “AI is driving more automation and increasingly autonomous economic activity, while quantum computing is forcing the industry to think further ahead about how those systems are secured,” he said.
Migration Tools and the Validator Coordination Challenge
The XRP Ledger already has a built-in advantage for this kind of transition: it allows users to replace the keys controlling an account without changing the account itself. Ripple says that feature could make a future migration to quantum-resistant cryptography considerably smoother, since it avoids forcing users into entirely new addresses or wallets.
Coordinating an XRP Ledger upgrade across independent validators
Technical readiness is only part of the equation. Any wider change to the rules governing transactions still requires coordination among the network’s independent validators, a governance hurdle that applies to any major XRP Ledger upgrade. Akinyele was blunt about the scope of the task ahead. “That upgrade will go well beyond swapping out one cryptographic algorithm for another,” he said. “It will require more agile infrastructure, stronger key management, clearer upgrade paths and systems that can evolve without disrupting the financial activity they support.” Crypto Briefing notes that Ripple’s later-stage plans include a formal XRPL amendment to add native post-quantum support, the kind of network-level change that depends on validator consensus.
There’s a reassuring data point buried in the exposure math. An independent audit cited by Crypto Briefing found that only about 0.03% of XRP’s total supply sits in dormant accounts with exposed public keys, since active accounts that haven’t broadcast a transaction don’t reveal their public keys on-chain in the first place. Bitcoin’s exposure looks larger by comparison, given that coins sitting in older pay-to-public-key addresses, including those widely believed to belong to Satoshi Nakamoto, have public keys fully visible on the blockchain. That contrast matters because of a scenario researchers call “harvest now, decrypt later,” in which attackers collect encrypted data and signed transactions today and simply wait for a quantum computer strong enough to break them retroactively.
A Deliberate Transition, Not a Crisis Response
Ripple’s underlying philosophy is that the earlier this work starts, the more options the network has when the threat becomes real, rather than being forced into rushed decisions under pressure. “The objective is to make the eventual transition deliberate and orderly, rather than something the ecosystem has to undertake in response to a crisis,” Akinyele said.
AI-driven payments raise the stakes further
This isn’t happening in a vacuum. AI agents are already beginning to transact and pay for services without a person approving each action, a shift Akinyele linked directly to the urgency around securing payment rails. “For financial services specifically, we’re already starting to see this shift with agentic payments, where AI agents can transact and pay for services autonomously,” he said. “That creates new demands for always-on, internet-native payment infrastructure.” Ripple isn’t alone in facing this pressure: Bitcoin and Ethereum developers are separately working on ways to replace the digital signature schemes their networks use today, ahead of the point when quantum computers could break them. For Ripple, and for the broader blockchain industry watching closely, the real test won’t be whether new cryptography exists on paper — it will be whether it can be deployed at financial-network scale without disrupting the very systems it’s meant to protect.
FAQ
What is Ripple’s plan to protect the XRP Ledger against quantum computing?
Ripple has a four-stage plan involving assessing vulnerabilities, testing quantum-resistant cryptography, running old and new security in parallel, and maintaining an emergency response to prepare the XRP Ledger for quantum threats. Related reporting describes this as part of a broader roadmap targeting full quantum readiness by 2028, with NIST-standard algorithms like ML-DSA and Dilithium already being tested alongside Project Eleven.
Why is quantum computing a threat to blockchain security?
Quantum computers could break current cryptographic protections by deriving private keys from public keys, endangering wallets and digital assets. Google’s Quantum AI team estimated in March 2026 that around 500,000 physical qubits could allow a private key to be calculated from an exposed public key in roughly nine minutes.
How does the XRP Ledger facilitate migration to quantum-resistant security?
The XRP Ledger allows users to replace the keys controlling an account without changing the account itself, making a future migration to quantum-resistant cryptography easier. An independent audit found only about 0.03% of XRP’s supply sits in dormant accounts with exposed public keys, limiting the network’s current exposure.
How does AI impact Ripple’s approach to quantum security?
AI accelerates the discovery of cryptographic vulnerabilities, creating urgency for quantum-resistant upgrades, while also driving autonomous “agentic payments” that place new demands on always-on payment infrastructure.
Article produced with the assistance of artificial intelligence and reviewed by the editorial team.
Ripple XRP quantum security plan races to beat a 9-minute hacking threat by 2028
Ripple isn’t waiting for a crisis to force its hand. Engineers at the payments-focused blockchain firm are moving now to strengthen Ripple XRP quantum security years before quantum computers are expected to pose any real danger to blockchain networks, rolling out a four-stage roadmap designed to protect the XRP Ledger long before the day researchers call “Q-Day” ever arrives.
Key takeaways
A four-stage plan has been presented by Ripple to ready the XRP Ledger against quantum computers capable of potentially revealing private keys.
The strategy includes assessing vulnerabilities, testing quantum-resistant cryptography, running old and new security systems in parallel, and keeping an emergency response ready.
A separate report from Crypto Briefing ties the effort to a broader roadmap targeting full quantum readiness by 2028, with testing of NIST-standard algorithms like ML-DSA and Dilithium already underway alongside Project Eleven.
Google’s Quantum AI team estimated in March 2026 that just 500,000 physical qubits could be enough to derive a private key from an exposed public key in roughly nine minutes.
An independent audit cited by Crypto Briefing found only 0.03% of XRP’s total supply sits in dormant accounts with exposed public keys, a much smaller exposure than Bitcoin’s older P2PK addresses.
Ripple’s Four-Stage Plan to Quantum-Proof the XRP Ledger
Ripple’s response to the quantum question is built as a long-term infrastructure project rather than a rushed patch job. “The goal is not to wait until quantum computing becomes an immediate threat,” Ayo Akinyele, Ripple’s senior director of engineering, told CoinDesk. “It is to make sure critical financial infrastructure can evolve well before that point without disrupting the systems, assets and users that depend on it.”
Assessing vulnerabilities and testing new cryptography
The plan begins with a network-wide audit to identify which parts of the XRP Ledger would be exposed if current cryptography failed. From there, Ripple moves into testing alternative cryptographic methods against the actual workload the ledger handles today, rather than in isolated lab conditions. According to Crypto Briefing, that testing phase is already underway, with Ripple evaluating NIST-standard post-quantum algorithms, specifically ML-DSA and Dilithium, in partnership with Project Eleven, a firm focused on quantum security research and benchmarking. The collaboration is meant to confirm that adding quantum resistance doesn’t slow the network down or degrade the experience for everyday users.
Parallel operation and emergency readiness
Later stages call for running today’s security alongside quantum-resistant alternatives at the same time, a dual-track approach meant to smooth the eventual handover rather than force it in one disruptive leap. Ripple has also built in an emergency route in case quantum computing advances faster than expected. Crypto Briefing describes this as “Phase 1: Q-Day readiness,” an emergency contingency designed to trigger rapid migration of accounts to quantum-safe alternatives if a credible threat emerges before the full upgrade is finished. Testnet deployments were expected throughout mid-2026, with Ripple aiming for full quantum readiness by 2028.
Why Quantum Computing Threatens Blockchain Security
The danger is mathematical, not theoretical folklore. A sufficiently powerful quantum computer could eventually work backwards from publicly available information to calculate the private keys that control digital assets, breaking protections that both blockchains and traditional banks currently rely on.
That threat gained sharper definition in March 2026, when Google’s Quantum AI team estimated that around 500,000 physical qubits could be enough to break elliptic curve cryptography, the mathematical backbone protecting private keys across nearly every blockchain. At that scale, a quantum machine could reportedly derive a private key from an exposed public key in about nine minutes. Previous estimates had assumed millions of qubits would be required, and the sharply lower figure compressed the timeline the industry believed it had to work with.
AI is accelerating the pressure on cryptography
Quantum computing isn’t the only force squeezing the timeline. AI systems are increasingly used to hunt for flaws in cryptography, work that once took specialist researchers far longer to complete. That creates a second, tougher problem: any system built to resist quantum attacks must also hold up against faster, cheaper AI crypto attacks that don’t need a quantum computer at all. Akinyele said the two forces are technically distinct but are pushing the industry in the same direction. “AI is driving more automation and increasingly autonomous economic activity, while quantum computing is forcing the industry to think further ahead about how those systems are secured,” he said.
Migration Tools and the Validator Coordination Challenge
The XRP Ledger already has a built-in advantage for this kind of transition: it allows users to replace the keys controlling an account without changing the account itself. Ripple says that feature could make a future migration to quantum-resistant cryptography considerably smoother, since it avoids forcing users into entirely new addresses or wallets.
Coordinating an XRP Ledger upgrade across independent validators
Technical readiness is only part of the equation. Any wider change to the rules governing transactions still requires coordination among the network’s independent validators, a governance hurdle that applies to any major XRP Ledger upgrade. Akinyele was blunt about the scope of the task ahead. “That upgrade will go well beyond swapping out one cryptographic algorithm for another,” he said. “It will require more agile infrastructure, stronger key management, clearer upgrade paths and systems that can evolve without disrupting the financial activity they support.” Crypto Briefing notes that Ripple’s later-stage plans include a formal XRPL amendment to add native post-quantum support, the kind of network-level change that depends on validator consensus.
There’s a reassuring data point buried in the exposure math. An independent audit cited by Crypto Briefing found that only about 0.03% of XRP’s total supply sits in dormant accounts with exposed public keys, since active accounts that haven’t broadcast a transaction don’t reveal their public keys on-chain in the first place. Bitcoin’s exposure looks larger by comparison, given that coins sitting in older pay-to-public-key addresses, including those widely believed to belong to Satoshi Nakamoto, have public keys fully visible on the blockchain. That contrast matters because of a scenario researchers call “harvest now, decrypt later,” in which attackers collect encrypted data and signed transactions today and simply wait for a quantum computer strong enough to break them retroactively.
A Deliberate Transition, Not a Crisis Response
Ripple’s underlying philosophy is that the earlier this work starts, the more options the network has when the threat becomes real, rather than being forced into rushed decisions under pressure. “The objective is to make the eventual transition deliberate and orderly, rather than something the ecosystem has to undertake in response to a crisis,” Akinyele said.
AI-driven payments raise the stakes further
This isn’t happening in a vacuum. AI agents are already beginning to transact and pay for services without a person approving each action, a shift Akinyele linked directly to the urgency around securing payment rails. “For financial services specifically, we’re already starting to see this shift with agentic payments, where AI agents can transact and pay for services autonomously,” he said. “That creates new demands for always-on, internet-native payment infrastructure.” Ripple isn’t alone in facing this pressure: Bitcoin and Ethereum developers are separately working on ways to replace the digital signature schemes their networks use today, ahead of the point when quantum computers could break them. For Ripple, and for the broader blockchain industry watching closely, the real test won’t be whether new cryptography exists on paper — it will be whether it can be deployed at financial-network scale without disrupting the very systems it’s meant to protect.
FAQ
What is Ripple’s plan to protect the XRP Ledger against quantum computing?
Ripple has a four-stage plan involving assessing vulnerabilities, testing quantum-resistant cryptography, running old and new security in parallel, and maintaining an emergency response to prepare the XRP Ledger for quantum threats. Related reporting describes this as part of a broader roadmap targeting full quantum readiness by 2028, with NIST-standard algorithms like ML-DSA and Dilithium already being tested alongside Project Eleven.
Why is quantum computing a threat to blockchain security?
Quantum computers could break current cryptographic protections by deriving private keys from public keys, endangering wallets and digital assets. Google’s Quantum AI team estimated in March 2026 that around 500,000 physical qubits could allow a private key to be calculated from an exposed public key in roughly nine minutes.
How does the XRP Ledger facilitate migration to quantum-resistant security?
The XRP Ledger allows users to replace the keys controlling an account without changing the account itself, making a future migration to quantum-resistant cryptography easier. An independent audit found only about 0.03% of XRP’s supply sits in dormant accounts with exposed public keys, limiting the network’s current exposure.
How does AI impact Ripple’s approach to quantum security?
AI accelerates the discovery of cryptographic vulnerabilities, creating urgency for quantum-resistant upgrades, while also driving autonomous “agentic payments” that place new demands on always-on payment infrastructure.
Article produced with the assistance of artificial intelligence and reviewed by the editorial team.
Key takeaways
A four-stage plan has been presented by Ripple to ready the XRP Ledger against quantum computers capable of potentially revealing private keys.
The strategy includes assessing vulnerabilities, testing quantum-resistant cryptography, running old and new security systems in parallel, and keeping an emergency response ready.
A separate report from Crypto Briefing ties the effort to a broader roadmap targeting full quantum readiness by 2028, with testing of NIST-standard algorithms like ML-DSA and Dilithium already underway alongside Project Eleven.
Google’s Quantum AI team estimated in March 2026 that just 500,000 physical qubits could be enough to derive a private key from an exposed public key in roughly nine minutes.
An independent audit cited by Crypto Briefing found only 0.03% of XRP’s total supply sits in dormant accounts with exposed public keys, a much smaller exposure than Bitcoin’s older P2PK addresses.
Ripple’s Four-Stage Plan to Quantum-Proof the XRP Ledger
Ripple’s response to the quantum question is built as a long-term infrastructure project rather than a rushed patch job. “The goal is not to wait until quantum computing becomes an immediate threat,” Ayo Akinyele, Ripple’s senior director of engineering, told CoinDesk. “It is to make sure critical financial infrastructure can evolve well before that point without disrupting the systems, assets and users that depend on it.”
Assessing vulnerabilities and testing new cryptography
The plan begins with a network-wide audit to identify which parts of the XRP Ledger would be exposed if current cryptography failed. From there, Ripple moves into testing alternative cryptographic methods against the actual workload the ledger handles today, rather than in isolated lab conditions. According to Crypto Briefing, that testing phase is already underway, with Ripple evaluating NIST-standard post-quantum algorithms, specifically ML-DSA and Dilithium, in partnership with Project Eleven, a firm focused on quantum security research and benchmarking. The collaboration is meant to confirm that adding quantum resistance doesn’t slow the network down or degrade the experience for everyday users.
Parallel operation and emergency readiness
Later stages call for running today’s security alongside quantum-resistant alternatives at the same time, a dual-track approach meant to smooth the eventual handover rather than force it in one disruptive leap. Ripple has also built in an emergency route in case quantum computing advances faster than expected. Crypto Briefing describes this as “Phase 1: Q-Day readiness,” an emergency contingency designed to trigger rapid migration of accounts to quantum-safe alternatives if a credible threat emerges before the full upgrade is finished. Testnet deployments were expected throughout mid-2026, with Ripple aiming for full quantum readiness by 2028.
Why Quantum Computing Threatens Blockchain Security
The danger is mathematical, not theoretical folklore. A sufficiently powerful quantum computer could eventually work backwards from publicly available information to calculate the private keys that control digital assets, breaking protections that both blockchains and traditional banks currently rely on.
That threat gained sharper definition in March 2026, when Google’s Quantum AI team estimated that around 500,000 physical qubits could be enough to break elliptic curve cryptography, the mathematical backbone protecting private keys across nearly every blockchain. At that scale, a quantum machine could reportedly derive a private key from an exposed public key in about nine minutes. Previous estimates had assumed millions of qubits would be required, and the sharply lower figure compressed the timeline the industry believed it had to work with.
AI is accelerating the pressure on cryptography
Quantum computing isn’t the only force squeezing the timeline. AI systems are increasingly used to hunt for flaws in cryptography, work that once took specialist researchers far longer to complete. That creates a second, tougher problem: any system built to resist quantum attacks must also hold up against faster, cheaper AI crypto attacks that don’t need a quantum computer at all. Akinyele said the two forces are technically distinct but are pushing the industry in the same direction. “AI is driving more automation and increasingly autonomous economic activity, while quantum computing is forcing the industry to think further ahead about how those systems are secured,” he said.
Migration Tools and the Validator Coordination Challenge
The XRP Ledger already has a built-in advantage for this kind of transition: it allows users to replace the keys controlling an account without changing the account itself. Ripple says that feature could make a future migration to quantum-resistant cryptography considerably smoother, since it avoids forcing users into entirely new addresses or wallets.
Coordinating an XRP Ledger upgrade across independent validators
Technical readiness is only part of the equation. Any wider change to the rules governing transactions still requires coordination among the network’s independent validators, a governance hurdle that applies to any major XRP Ledger upgrade. Akinyele was blunt about the scope of the task ahead. “That upgrade will go well beyond swapping out one cryptographic algorithm for another,” he said. “It will require more agile infrastructure, stronger key management, clearer upgrade paths and systems that can evolve without disrupting the financial activity they support.” Crypto Briefing notes that Ripple’s later-stage plans include a formal XRPL amendment to add native post-quantum support, the kind of network-level change that depends on validator consensus.
There’s a reassuring data point buried in the exposure math. An independent audit cited by Crypto Briefing found that only about 0.03% of XRP’s total supply sits in dormant accounts with exposed public keys, since active accounts that haven’t broadcast a transaction don’t reveal their public keys on-chain in the first place. Bitcoin’s exposure looks larger by comparison, given that coins sitting in older pay-to-public-key addresses, including those widely believed to belong to Satoshi Nakamoto, have public keys fully visible on the blockchain. That contrast matters because of a scenario researchers call “harvest now, decrypt later,” in which attackers collect encrypted data and signed transactions today and simply wait for a quantum computer strong enough to break them retroactively.
A Deliberate Transition, Not a Crisis Response
Ripple’s underlying philosophy is that the earlier this work starts, the more options the network has when the threat becomes real, rather than being forced into rushed decisions under pressure. “The objective is to make the eventual transition deliberate and orderly, rather than something the ecosystem has to undertake in response to a crisis,” Akinyele said.
AI-driven payments raise the stakes further
This isn’t happening in a vacuum. AI agents are already beginning to transact and pay for services without a person approving each action, a shift Akinyele linked directly to the urgency around securing payment rails. “For financial services specifically, we’re already starting to see this shift with agentic payments, where AI agents can transact and pay for services autonomously,” he said. “That creates new demands for always-on, internet-native payment infrastructure.” Ripple isn’t alone in facing this pressure: Bitcoin and Ethereum developers are separately working on ways to replace the digital signature schemes their networks use today, ahead of the point when quantum computers could break them. For Ripple, and for the broader blockchain industry watching closely, the real test won’t be whether new cryptography exists on paper — it will be whether it can be deployed at financial-network scale without disrupting the very systems it’s meant to protect.
FAQ
What is Ripple’s plan to protect the XRP Ledger against quantum computing?
Ripple has a four-stage plan involving assessing vulnerabilities, testing quantum-resistant cryptography, running old and new security in parallel, and maintaining an emergency response to prepare the XRP Ledger for quantum threats. Related reporting describes this as part of a broader roadmap targeting full quantum readiness by 2028, with NIST-standard algorithms like ML-DSA and Dilithium already being tested alongside Project Eleven.
Why is quantum computing a threat to blockchain security?
Quantum computers could break current cryptographic protections by deriving private keys from public keys, endangering wallets and digital assets. Google’s Quantum AI team estimated in March 2026 that around 500,000 physical qubits could allow a private key to be calculated from an exposed public key in roughly nine minutes.
How does the XRP Ledger facilitate migration to quantum-resistant security?
The XRP Ledger allows users to replace the keys controlling an account without changing the account itself, making a future migration to quantum-resistant cryptography easier. An independent audit found only about 0.03% of XRP’s supply sits in dormant accounts with exposed public keys, limiting the network’s current exposure.
How does AI impact Ripple’s approach to quantum security?
AI accelerates the discovery of cryptographic vulnerabilities, creating urgency for quantum-resistant upgrades, while also driving autonomous “agentic payments” that place new demands on always-on payment infrastructure.
Article produced with the assistance of artificial intelligence and reviewed by the editorial team.
1
167
Article
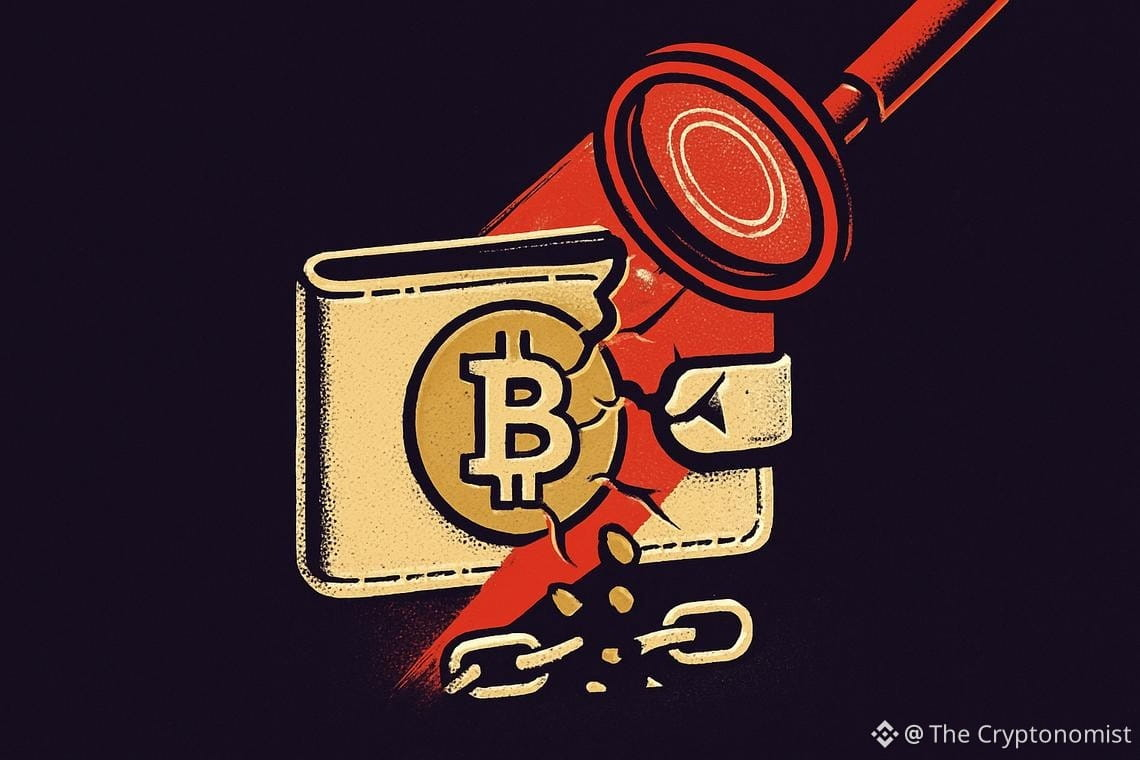
Bitcoin dormant wallets movement sends $40M after over 15 years of silenceSix Bitcoin wallets that had sat untouched since the early 2010s suddenly sprang to life this month, sending a fresh wave of attention toward the broader pattern of Bitcoin dormant wallets movement that has puzzled analysts for years. Between August 16 and August 26, the wallets moved a combined 553.59 BTC worth roughly $40 million, according to data tracked by Galaxy Research. One of them hadn’t budged in more than 15 years.
Key takeaways
Six wallets last active between 2011 and 2014 moved 553.59 BTC, worth about $40 million, between August 16 and August 26, 2026.
One address had remained completely still for more than 15 years before finally moving.
Dormant Bitcoin activity onchain fell in the second quarter of 2026 to its lowest point since the third quarter of 2022.
Five of the six wallets sent funds to addresses with no known exchange ties; the sixth sent 40 BTC to Boerse Stuttgart Digital, a German custody provider.
Two of the six wallets are tied to a New York lawsuit over 39,069 dormant Bitcoin addresses, while a separate Coldcard hardware wallet flaw pushed roughly 210,000 BTC out of long-term holder wallets in a single week in July.
Rare Movement from Long-Dormant Bitcoin Wallets
Old coins waking up after a decade or more is unusual enough that onchain researchers flag it almost every time it happens. The latest batch of six wallets, all last active between 2011 and 2014, is no exception — and the numbers behind it are striking.
The oldest of the group had not recorded a single transaction in over 15 years. Galaxy Research’s tracking shows the coins moved out in stages across a 10-day window, with the earliest transfer on August 16 involving just 8.54 BTC that had sat still since June 2011. That position, worth roughly $538,000 when it finally moved, had been bought for pennies on the dollar years earlier, translating into gains that ran into the hundreds of thousands of percent.
Later transfers followed a similar arc: coins bought for a handful of dollars each, now worth six or seven figures, moving out of wallets that had effectively been frozen in time since Bitcoin was still a niche experiment. The scale of the paper gains underscores just how long some of this old Bitcoin wallet activity has been dormant — and why any sign of life draws immediate scrutiny.
Trends in Dormant Bitcoin Movement
Despite the headline-grabbing nature of these six wallets, the broader trend actually points toward less dormant coin movement, not more. The second quarter of 2026 saw the amount of dormant Bitcoin moving onchain fall to its lowest level since the third quarter of 2022, according to Alex Thorn, head of firmwide research at Galaxy Digital.
That slowdown follows two unusually active years. Old Bitcoin moved heavily in 2024 and 2025, at a pace Galaxy compared to the 2017 bull run, when a wave of early holders sitting on enormous unrealized gains began cashing in or shifting their coins. Galaxy described that stretch as a “great distribution,” and the firm now expects 2026 to end with less than half as much dormant Bitcoin movement as the prior year.
Why this matters: a slowdown in dormant coin activity generally signals steadier hands among Bitcoin’s earliest holders, even as isolated cases — like this batch of six wallets — continue to generate outsized attention because of their age and scale.
Where the Bitcoin Actually Went
Movement doesn’t automatically mean selling. Bitcoin’s public blockchain can show that coins left one address and landed in another, but it typically cannot say whether the owner sold, switched wallets, moved funds to a custodian, or simply reorganized their own holdings.
That distinction matters here. Five of the six decade-old wallets sent their Bitcoin to addresses with no known exchange links, offering no onchain evidence that the coins were sold. The sixth wallet, however, sent 40 BTC directly to Boerse Stuttgart Digital, a German crypto custody and trading provider — a transfer that at least points toward a regulated destination, even if the sender’s intent remains unclear.
That single transfer stands out as the only one in the group tied to a named financial entity, making the overall picture more about quiet repositioning than mass liquidation.
Legal Disputes Influence Wallet Activity
Two of the six wallets carry labels connecting them to an active New York lawsuit, adding a legal dimension to what might otherwise look like a purely technical curiosity. A pseudonymous plaintiff known as Noah Doe is seeking control of Bitcoin held across 39,069 dormant addresses, arguing under the state’s lost-property laws that coins nobody claims ownership of can be treated as abandoned.
The plaintiffs reportedly sent small “dust” transactions to thousands of these addresses along with onchain legal notices, aiming to alert whoever controls the wallets about the claim. Any address that later moves funds effectively signals that someone is still watching — and, in legal terms, still in control.
This is one of the clearer explanations for why some old wallets are stirring: it isn’t necessarily quantum fear or market timing, but a direct legal prompt urging owners to prove they’re still there.
Security Concerns Prompt Long-Term Moves
Separately, a hardware wallet vulnerability has been pushing large volumes of Bitcoin out of long-dormant storage altogether. Following the revelation of a vulnerability in specific Coldcard hardware wallets during late July, approximately 210,000 BTC were transferred out of wallets that Glassnode categorizes as belonging to long-term holders within a single week.
The flaw made poorly generated wallet keys easier for attackers to guess, and it prompted a wave of users — not just Coldcard owners, but holders across different hardware setups — to shift their Bitcoin into freshly created wallets or regulated custody, even when their own coins were never directly exposed to the bug.
This episode is a useful reminder that not every burst of Bitcoin dormant wallets movement reflects market sentiment. Sometimes it’s simply about security hygiene, triggered by a single disclosed vulnerability rather than any broader shift in conviction.
Uncertain Motivations Behind the Movement
None of this fully explains why these specific six wallets moved when they did. Blockchain data can track where coins go, but it cannot reveal intent — and that gap has left plenty of room for speculation, including theories around quantum computing risk.
The concern centers on wallets whose public keys have already been exposed onchain, which could theoretically become vulnerable if quantum computers eventually grow powerful enough to break the cryptography protecting Bitcoin’s digital signatures. It’s a scenario that has made quantum risk an increasingly popular explanation whenever very old Bitcoin starts moving.
Thorn, however, has pushed back on that narrative. “We work with a lot of whales and none has mentioned quantum as a reason for selling,” he wrote in July, adding that he’s mostly heard quantum concerns raised by institutional investors as a reason to avoid buying Bitcoin altogether — not as a motive for moving coins already held.
Between legal pressure, hardware security scares, and plain old happenstance, the explanations for this kind of Bitcoin dormant wallets movement remain fragmented. What’s clear is that the coins are moving faster than the certainty around why.
FAQ
Why did the six long-dormant Bitcoin wallets move their coins after many years?
The exact intent is uncertain. The movements could be tied to selling, changing wallets, shifting to custody, or responding to legal notices, but blockchain data alone cannot confirm the motive behind each transfer.
What role does the New York lawsuit play in dormant Bitcoin wallet movements?
Two of the six wallets are linked to a lawsuit in which plaintiff Noah Doe is seeking control over 39,069 dormant Bitcoin addresses, arguing the coins should be treated as abandoned property under New York’s lost-property laws.
How did the Coldcard hardware wallet vulnerability affect Bitcoin movement in 2026?
A firmware flaw disclosed in July 2026 led to roughly 210,000 BTC moving out of long-term holder wallets within a single week, as users shifted coins to safer setups even when their own funds weren’t directly at risk.
Is quantum computing considered a reason for these dormant Bitcoin movements?
Quantum computing risk is a theorized explanation, but it remains disputed. Alex Thorn of Galaxy Digital has said none of the whales his firm works with have cited quantum risk as a reason for selling Bitcoin.
Article produced with the assistance of artificial intelligence and reviewed by the editorial team.
Bitcoin dormant wallets movement sends $40M after over 15 years of silence
Six Bitcoin wallets that had sat untouched since the early 2010s suddenly sprang to life this month, sending a fresh wave of attention toward the broader pattern of Bitcoin dormant wallets movement that has puzzled analysts for years. Between August 16 and August 26, the wallets moved a combined 553.59 BTC worth roughly $40 million, according to data tracked by Galaxy Research. One of them hadn’t budged in more than 15 years.
Key takeaways
Six wallets last active between 2011 and 2014 moved 553.59 BTC, worth about $40 million, between August 16 and August 26, 2026.
One address had remained completely still for more than 15 years before finally moving.
Dormant Bitcoin activity onchain fell in the second quarter of 2026 to its lowest point since the third quarter of 2022.
Five of the six wallets sent funds to addresses with no known exchange ties; the sixth sent 40 BTC to Boerse Stuttgart Digital, a German custody provider.
Two of the six wallets are tied to a New York lawsuit over 39,069 dormant Bitcoin addresses, while a separate Coldcard hardware wallet flaw pushed roughly 210,000 BTC out of long-term holder wallets in a single week in July.
Rare Movement from Long-Dormant Bitcoin Wallets
Old coins waking up after a decade or more is unusual enough that onchain researchers flag it almost every time it happens. The latest batch of six wallets, all last active between 2011 and 2014, is no exception — and the numbers behind it are striking.
The oldest of the group had not recorded a single transaction in over 15 years. Galaxy Research’s tracking shows the coins moved out in stages across a 10-day window, with the earliest transfer on August 16 involving just 8.54 BTC that had sat still since June 2011. That position, worth roughly $538,000 when it finally moved, had been bought for pennies on the dollar years earlier, translating into gains that ran into the hundreds of thousands of percent.
Later transfers followed a similar arc: coins bought for a handful of dollars each, now worth six or seven figures, moving out of wallets that had effectively been frozen in time since Bitcoin was still a niche experiment. The scale of the paper gains underscores just how long some of this old Bitcoin wallet activity has been dormant — and why any sign of life draws immediate scrutiny.
Trends in Dormant Bitcoin Movement
Despite the headline-grabbing nature of these six wallets, the broader trend actually points toward less dormant coin movement, not more. The second quarter of 2026 saw the amount of dormant Bitcoin moving onchain fall to its lowest level since the third quarter of 2022, according to Alex Thorn, head of firmwide research at Galaxy Digital.
That slowdown follows two unusually active years. Old Bitcoin moved heavily in 2024 and 2025, at a pace Galaxy compared to the 2017 bull run, when a wave of early holders sitting on enormous unrealized gains began cashing in or shifting their coins. Galaxy described that stretch as a “great distribution,” and the firm now expects 2026 to end with less than half as much dormant Bitcoin movement as the prior year.
Why this matters: a slowdown in dormant coin activity generally signals steadier hands among Bitcoin’s earliest holders, even as isolated cases — like this batch of six wallets — continue to generate outsized attention because of their age and scale.
Where the Bitcoin Actually Went
Movement doesn’t automatically mean selling. Bitcoin’s public blockchain can show that coins left one address and landed in another, but it typically cannot say whether the owner sold, switched wallets, moved funds to a custodian, or simply reorganized their own holdings.
That distinction matters here. Five of the six decade-old wallets sent their Bitcoin to addresses with no known exchange links, offering no onchain evidence that the coins were sold. The sixth wallet, however, sent 40 BTC directly to Boerse Stuttgart Digital, a German crypto custody and trading provider — a transfer that at least points toward a regulated destination, even if the sender’s intent remains unclear.
That single transfer stands out as the only one in the group tied to a named financial entity, making the overall picture more about quiet repositioning than mass liquidation.
Legal Disputes Influence Wallet Activity
Two of the six wallets carry labels connecting them to an active New York lawsuit, adding a legal dimension to what might otherwise look like a purely technical curiosity. A pseudonymous plaintiff known as Noah Doe is seeking control of Bitcoin held across 39,069 dormant addresses, arguing under the state’s lost-property laws that coins nobody claims ownership of can be treated as abandoned.
The plaintiffs reportedly sent small “dust” transactions to thousands of these addresses along with onchain legal notices, aiming to alert whoever controls the wallets about the claim. Any address that later moves funds effectively signals that someone is still watching — and, in legal terms, still in control.
This is one of the clearer explanations for why some old wallets are stirring: it isn’t necessarily quantum fear or market timing, but a direct legal prompt urging owners to prove they’re still there.
Security Concerns Prompt Long-Term Moves
Separately, a hardware wallet vulnerability has been pushing large volumes of Bitcoin out of long-dormant storage altogether. Following the revelation of a vulnerability in specific Coldcard hardware wallets during late July, approximately 210,000 BTC were transferred out of wallets that Glassnode categorizes as belonging to long-term holders within a single week.
The flaw made poorly generated wallet keys easier for attackers to guess, and it prompted a wave of users — not just Coldcard owners, but holders across different hardware setups — to shift their Bitcoin into freshly created wallets or regulated custody, even when their own coins were never directly exposed to the bug.
This episode is a useful reminder that not every burst of Bitcoin dormant wallets movement reflects market sentiment. Sometimes it’s simply about security hygiene, triggered by a single disclosed vulnerability rather than any broader shift in conviction.
Uncertain Motivations Behind the Movement
None of this fully explains why these specific six wallets moved when they did. Blockchain data can track where coins go, but it cannot reveal intent — and that gap has left plenty of room for speculation, including theories around quantum computing risk.
The concern centers on wallets whose public keys have already been exposed onchain, which could theoretically become vulnerable if quantum computers eventually grow powerful enough to break the cryptography protecting Bitcoin’s digital signatures. It’s a scenario that has made quantum risk an increasingly popular explanation whenever very old Bitcoin starts moving.
Thorn, however, has pushed back on that narrative. “We work with a lot of whales and none has mentioned quantum as a reason for selling,” he wrote in July, adding that he’s mostly heard quantum concerns raised by institutional investors as a reason to avoid buying Bitcoin altogether — not as a motive for moving coins already held.
Between legal pressure, hardware security scares, and plain old happenstance, the explanations for this kind of Bitcoin dormant wallets movement remain fragmented. What’s clear is that the coins are moving faster than the certainty around why.
FAQ
Why did the six long-dormant Bitcoin wallets move their coins after many years?
The exact intent is uncertain. The movements could be tied to selling, changing wallets, shifting to custody, or responding to legal notices, but blockchain data alone cannot confirm the motive behind each transfer.
What role does the New York lawsuit play in dormant Bitcoin wallet movements?
Two of the six wallets are linked to a lawsuit in which plaintiff Noah Doe is seeking control over 39,069 dormant Bitcoin addresses, arguing the coins should be treated as abandoned property under New York’s lost-property laws.
How did the Coldcard hardware wallet vulnerability affect Bitcoin movement in 2026?
A firmware flaw disclosed in July 2026 led to roughly 210,000 BTC moving out of long-term holder wallets within a single week, as users shifted coins to safer setups even when their own funds weren’t directly at risk.
Is quantum computing considered a reason for these dormant Bitcoin movements?
Quantum computing risk is a theorized explanation, but it remains disputed. Alex Thorn of Galaxy Digital has said none of the whales his firm works with have cited quantum risk as a reason for selling Bitcoin.
Article produced with the assistance of artificial intelligence and reviewed by the editorial team.
Key takeaways
Six wallets last active between 2011 and 2014 moved 553.59 BTC, worth about $40 million, between August 16 and August 26, 2026.
One address had remained completely still for more than 15 years before finally moving.
Dormant Bitcoin activity onchain fell in the second quarter of 2026 to its lowest point since the third quarter of 2022.
Five of the six wallets sent funds to addresses with no known exchange ties; the sixth sent 40 BTC to Boerse Stuttgart Digital, a German custody provider.
Two of the six wallets are tied to a New York lawsuit over 39,069 dormant Bitcoin addresses, while a separate Coldcard hardware wallet flaw pushed roughly 210,000 BTC out of long-term holder wallets in a single week in July.
Rare Movement from Long-Dormant Bitcoin Wallets
Old coins waking up after a decade or more is unusual enough that onchain researchers flag it almost every time it happens. The latest batch of six wallets, all last active between 2011 and 2014, is no exception — and the numbers behind it are striking.
The oldest of the group had not recorded a single transaction in over 15 years. Galaxy Research’s tracking shows the coins moved out in stages across a 10-day window, with the earliest transfer on August 16 involving just 8.54 BTC that had sat still since June 2011. That position, worth roughly $538,000 when it finally moved, had been bought for pennies on the dollar years earlier, translating into gains that ran into the hundreds of thousands of percent.
Later transfers followed a similar arc: coins bought for a handful of dollars each, now worth six or seven figures, moving out of wallets that had effectively been frozen in time since Bitcoin was still a niche experiment. The scale of the paper gains underscores just how long some of this old Bitcoin wallet activity has been dormant — and why any sign of life draws immediate scrutiny.
Trends in Dormant Bitcoin Movement
Despite the headline-grabbing nature of these six wallets, the broader trend actually points toward less dormant coin movement, not more. The second quarter of 2026 saw the amount of dormant Bitcoin moving onchain fall to its lowest level since the third quarter of 2022, according to Alex Thorn, head of firmwide research at Galaxy Digital.
That slowdown follows two unusually active years. Old Bitcoin moved heavily in 2024 and 2025, at a pace Galaxy compared to the 2017 bull run, when a wave of early holders sitting on enormous unrealized gains began cashing in or shifting their coins. Galaxy described that stretch as a “great distribution,” and the firm now expects 2026 to end with less than half as much dormant Bitcoin movement as the prior year.
Why this matters: a slowdown in dormant coin activity generally signals steadier hands among Bitcoin’s earliest holders, even as isolated cases — like this batch of six wallets — continue to generate outsized attention because of their age and scale.
Where the Bitcoin Actually Went
Movement doesn’t automatically mean selling. Bitcoin’s public blockchain can show that coins left one address and landed in another, but it typically cannot say whether the owner sold, switched wallets, moved funds to a custodian, or simply reorganized their own holdings.
That distinction matters here. Five of the six decade-old wallets sent their Bitcoin to addresses with no known exchange links, offering no onchain evidence that the coins were sold. The sixth wallet, however, sent 40 BTC directly to Boerse Stuttgart Digital, a German crypto custody and trading provider — a transfer that at least points toward a regulated destination, even if the sender’s intent remains unclear.
That single transfer stands out as the only one in the group tied to a named financial entity, making the overall picture more about quiet repositioning than mass liquidation.
Legal Disputes Influence Wallet Activity
Two of the six wallets carry labels connecting them to an active New York lawsuit, adding a legal dimension to what might otherwise look like a purely technical curiosity. A pseudonymous plaintiff known as Noah Doe is seeking control of Bitcoin held across 39,069 dormant addresses, arguing under the state’s lost-property laws that coins nobody claims ownership of can be treated as abandoned.
The plaintiffs reportedly sent small “dust” transactions to thousands of these addresses along with onchain legal notices, aiming to alert whoever controls the wallets about the claim. Any address that later moves funds effectively signals that someone is still watching — and, in legal terms, still in control.
This is one of the clearer explanations for why some old wallets are stirring: it isn’t necessarily quantum fear or market timing, but a direct legal prompt urging owners to prove they’re still there.
Security Concerns Prompt Long-Term Moves
Separately, a hardware wallet vulnerability has been pushing large volumes of Bitcoin out of long-dormant storage altogether. Following the revelation of a vulnerability in specific Coldcard hardware wallets during late July, approximately 210,000 BTC were transferred out of wallets that Glassnode categorizes as belonging to long-term holders within a single week.
The flaw made poorly generated wallet keys easier for attackers to guess, and it prompted a wave of users — not just Coldcard owners, but holders across different hardware setups — to shift their Bitcoin into freshly created wallets or regulated custody, even when their own coins were never directly exposed to the bug.
This episode is a useful reminder that not every burst of Bitcoin dormant wallets movement reflects market sentiment. Sometimes it’s simply about security hygiene, triggered by a single disclosed vulnerability rather than any broader shift in conviction.
Uncertain Motivations Behind the Movement
None of this fully explains why these specific six wallets moved when they did. Blockchain data can track where coins go, but it cannot reveal intent — and that gap has left plenty of room for speculation, including theories around quantum computing risk.
The concern centers on wallets whose public keys have already been exposed onchain, which could theoretically become vulnerable if quantum computers eventually grow powerful enough to break the cryptography protecting Bitcoin’s digital signatures. It’s a scenario that has made quantum risk an increasingly popular explanation whenever very old Bitcoin starts moving.
Thorn, however, has pushed back on that narrative. “We work with a lot of whales and none has mentioned quantum as a reason for selling,” he wrote in July, adding that he’s mostly heard quantum concerns raised by institutional investors as a reason to avoid buying Bitcoin altogether — not as a motive for moving coins already held.
Between legal pressure, hardware security scares, and plain old happenstance, the explanations for this kind of Bitcoin dormant wallets movement remain fragmented. What’s clear is that the coins are moving faster than the certainty around why.
FAQ
Why did the six long-dormant Bitcoin wallets move their coins after many years?
The exact intent is uncertain. The movements could be tied to selling, changing wallets, shifting to custody, or responding to legal notices, but blockchain data alone cannot confirm the motive behind each transfer.
What role does the New York lawsuit play in dormant Bitcoin wallet movements?
Two of the six wallets are linked to a lawsuit in which plaintiff Noah Doe is seeking control over 39,069 dormant Bitcoin addresses, arguing the coins should be treated as abandoned property under New York’s lost-property laws.
How did the Coldcard hardware wallet vulnerability affect Bitcoin movement in 2026?
A firmware flaw disclosed in July 2026 led to roughly 210,000 BTC moving out of long-term holder wallets within a single week, as users shifted coins to safer setups even when their own funds weren’t directly at risk.
Is quantum computing considered a reason for these dormant Bitcoin movements?
Quantum computing risk is a theorized explanation, but it remains disputed. Alex Thorn of Galaxy Digital has said none of the whales his firm works with have cited quantum risk as a reason for selling Bitcoin.
Article produced with the assistance of artificial intelligence and reviewed by the editorial team.
142

Article
Cardano Price Today: $0.24 Resistance Looms as Bulls and Bears SplitTrading around $0.21 on August 28, 2026, Cardano price today reflects a split between a quietly constructive daily chart and shorter timeframes that refuse to commit. ADA holds above its 20- and 50-day averages yet remains below the 200-day EMA at $0.24.
ADA/USDT — daily chart with candlesticks, EMA20/EMA50 and volume.
Key takeaways
ADA trades at $0.21 on August 28, 2026, above the 20- and 50-day averages but below the 200-day EMA at $0.24.
Total crypto market capitalization fell 2.36% in 24 hours, according to CoinGecko.
The Fear & Greed Index reads 73, signaling Greed even as broader market conditions weaken.
Cardano DEX activity is mixed: Splash Protocol grew across all periods while Minswap and SundaeSwap posted weekly and monthly declines.
Daily RSI sits at 58.55, while the 1-hour RSI at 44.25 shows short-term hesitation.
What the Daily Chart Shows
The daily chart leans cautiously constructive, but it does not confirm a full trend reversal. Cardano price today sits at $0.21 on the daily timeframe, above both the 20-EMA at $0.20 and the 50-EMA at $0.19, yet still beneath the 200-EMA at $0.24. Short-term averages are turning up, while the longer-term average still overhangs price as resistance.
The daily RSI at 58.55 supports that reading. It sits comfortably above the midline without flashing overbought, which tells you buyers have some control but have not pushed things to an extreme. MACD, however, is basically flat: line and signal both sit at 0.01 with a histogram of zero. That is a market where momentum has stalled right at the edge of a bullish cross, waiting for a catalyst rather than confirming one.
Bollinger Bands frame the range: the mid-band sits at $0.20, the upper band at $0.24, and the lower band at $0.16. Price is hugging the midline, and notably the upper band lines up almost exactly with the 200-EMA resistance. That confluence at $0.24 is the level that matters most if bulls want to make a real statement.
ATR14 at $0.02 suggests volatility is moderate rather than explosive right now, so a slow grind toward that level is more likely than a sudden spike. Pivot data reinforces the balance: the daily pivot point sits at $0.21, right where price is trading, with R1 at $0.22 and S1 at $0.20. That tight band shows the market has not picked a side yet.
How the 1-Hour and 15-Minute Charts Behave
The shorter timeframes show hesitation rather than trend. On the 1-hour chart, the EMA20, EMA50 and EMA200 have all converged around $0.21, meaning there is no clear trend on this timeframe, just compression. Meanwhile, RSI at 44.25 sits slightly below neutral, a mild sign of hesitation that runs counter to the daily’s more optimistic tone.
MACD is flat here too, offering no confirmation either way. This is the tension worth flagging: the daily chart leans mildly bullish, but the 1-hour chart tells you buyers have not stepped in with any urgency yet.
The 15-minute chart, used purely for execution context, shows RSI at 52.84, almost dead center neutral, with EMAs and Bollinger Bands all bunched near $0.21. There is no directional edge here either. Taken together, the multi-timeframe read shows a daily structure trying to build a base while shorter frames wait for a trigger.
What Cardano’s DEX Activity Reveals
Cardano’s on-chain DEX activity paints a mixed picture beneath the price stabilization. Minswap DEX posted an 18.34% jump in daily fees, but that is set against a 39.51% drop over seven days and a 45.34% decline over the past month.
SundaeSwap V2 shows a similar pattern: up 16.45% on the day, down 61.61% over the week, and down 69.92% over 30 days. Similarly, WingRiders fees fell 15.97% daily and are down roughly 30-40% across the week and month.
The one clear standout is Splash Protocol, which is up 6.41% daily, 13.83% over seven days, and 23.78% over 30 days. It is the only major Cardano DEX showing consistent growth across every window measured. Taken together, this points to a broader deceleration in Cardano network usage even as price attempts to stabilize. That gap is currently visible in the DeFi fee data.
Bullish and Bearish Scenarios
The bullish case depends on holding the $0.20 to $0.21 zone, while the bearish case leans on short-term weakness and capital rotation. For bulls, ADA must hold the cluster formed by the daily EMA20 and the S1 pivot. If that holds and daily RSI stays above 50, the next logical target sits near $0.24. That level marks the confluence of the upper Bollinger Band and the 200-EMA.
A daily close above that level would meaningfully shift the longer-term structure in bulls’ favor. Conversely, a daily close back below the 50-EMA at $0.19, or a decisive loss of the $0.20 pivot support, would suggest the bounce has run out of steam.
The bearish case leans on the fact that 1-hour RSI is still under 50 with MACD offering no real conviction. Add the broader backdrop: a 2.36% drop in total market cap, both classic signs of alt-coin capital flight. If ADA fails to reclaim momentum on shorter timeframes, a retest of the lower Bollinger Band and the $0.16 to $0.19 support zone becomes the more likely path.
By contrast, a clean break and hold above the $0.22 R1 pivot, followed by a reclaim of the $0.24 200-EMA, would take the bearish scenario off the table.
Final Read on Positioning
ADA currently presents unresolved signals rather than a clean trend. The daily chart offers a cautiously constructive read, while the hourly and 15-minute frames show hesitation. The wider market context adds caution, with Greed at 73 paired with a falling total market cap.
ATR readings suggest volatility is moderate rather than dramatic at the moment, so sudden oversized moves are not the base case. Still, that can shift quickly given how tightly price is coiled around its pivot. Anyone tracking this setup should weigh the daily structure against the shorter-term stall rather than picking one and ignoring the other.
Markets that sit this close to key averages and pivot levels tend to resolve with a burst of volatility once one side gives way. The question is simply which side blinks first, and neither the technical nor the on-chain data currently gives a definitive answer.
FAQ
What is Cardano’s price today?
As of August 28, 2026, ADA trades at $0.21.
Why does the daily chart look constructive?
ADA closed above the 20-EMA at $0.20 and the 50-EMA at $0.19, while daily RSI at 58.55 sits above the midline.
Which level matters most for bulls?
The confluence of the upper Bollinger Band and the 200-EMA around $0.24 is the key resistance.
What would invalidate the bullish case?
A daily close below the 50-EMA at $0.19 or a decisive loss of the $0.20 pivot support.
Disclaimer: This article is for informational purposes only and does not constitute financial advice, an investment recommendation, or a solicitation to buy or sell any financial instrument or cryptocurrency. The analysis provided is not indicative of future results. Investing in crypto assets and financial markets carries a high risk of capital loss. Always do your own research (DYOR) and consult a qualified financial advisor before making any decision.
Article produced with the assistance of artificial intelligence and reviewed by the editorial team.
Cardano Price Today: $0.24 Resistance Looms as Bulls and Bears Split
Trading around $0.21 on August 28, 2026, Cardano price today reflects a split between a quietly constructive daily chart and shorter timeframes that refuse to commit. ADA holds above its 20- and 50-day averages yet remains below the 200-day EMA at $0.24.
ADA/USDT — daily chart with candlesticks, EMA20/EMA50 and volume.
Key takeaways
ADA trades at $0.21 on August 28, 2026, above the 20- and 50-day averages but below the 200-day EMA at $0.24.
Total crypto market capitalization fell 2.36% in 24 hours, according to CoinGecko.
The Fear & Greed Index reads 73, signaling Greed even as broader market conditions weaken.
Cardano DEX activity is mixed: Splash Protocol grew across all periods while Minswap and SundaeSwap posted weekly and monthly declines.
Daily RSI sits at 58.55, while the 1-hour RSI at 44.25 shows short-term hesitation.
What the Daily Chart Shows
The daily chart leans cautiously constructive, but it does not confirm a full trend reversal. Cardano price today sits at $0.21 on the daily timeframe, above both the 20-EMA at $0.20 and the 50-EMA at $0.19, yet still beneath the 200-EMA at $0.24. Short-term averages are turning up, while the longer-term average still overhangs price as resistance.
The daily RSI at 58.55 supports that reading. It sits comfortably above the midline without flashing overbought, which tells you buyers have some control but have not pushed things to an extreme. MACD, however, is basically flat: line and signal both sit at 0.01 with a histogram of zero. That is a market where momentum has stalled right at the edge of a bullish cross, waiting for a catalyst rather than confirming one.
Bollinger Bands frame the range: the mid-band sits at $0.20, the upper band at $0.24, and the lower band at $0.16. Price is hugging the midline, and notably the upper band lines up almost exactly with the 200-EMA resistance. That confluence at $0.24 is the level that matters most if bulls want to make a real statement.
ATR14 at $0.02 suggests volatility is moderate rather than explosive right now, so a slow grind toward that level is more likely than a sudden spike. Pivot data reinforces the balance: the daily pivot point sits at $0.21, right where price is trading, with R1 at $0.22 and S1 at $0.20. That tight band shows the market has not picked a side yet.
How the 1-Hour and 15-Minute Charts Behave
The shorter timeframes show hesitation rather than trend. On the 1-hour chart, the EMA20, EMA50 and EMA200 have all converged around $0.21, meaning there is no clear trend on this timeframe, just compression. Meanwhile, RSI at 44.25 sits slightly below neutral, a mild sign of hesitation that runs counter to the daily’s more optimistic tone.
MACD is flat here too, offering no confirmation either way. This is the tension worth flagging: the daily chart leans mildly bullish, but the 1-hour chart tells you buyers have not stepped in with any urgency yet.
The 15-minute chart, used purely for execution context, shows RSI at 52.84, almost dead center neutral, with EMAs and Bollinger Bands all bunched near $0.21. There is no directional edge here either. Taken together, the multi-timeframe read shows a daily structure trying to build a base while shorter frames wait for a trigger.
What Cardano’s DEX Activity Reveals
Cardano’s on-chain DEX activity paints a mixed picture beneath the price stabilization. Minswap DEX posted an 18.34% jump in daily fees, but that is set against a 39.51% drop over seven days and a 45.34% decline over the past month.
SundaeSwap V2 shows a similar pattern: up 16.45% on the day, down 61.61% over the week, and down 69.92% over 30 days. Similarly, WingRiders fees fell 15.97% daily and are down roughly 30-40% across the week and month.
The one clear standout is Splash Protocol, which is up 6.41% daily, 13.83% over seven days, and 23.78% over 30 days. It is the only major Cardano DEX showing consistent growth across every window measured. Taken together, this points to a broader deceleration in Cardano network usage even as price attempts to stabilize. That gap is currently visible in the DeFi fee data.
Bullish and Bearish Scenarios
The bullish case depends on holding the $0.20 to $0.21 zone, while the bearish case leans on short-term weakness and capital rotation. For bulls, ADA must hold the cluster formed by the daily EMA20 and the S1 pivot. If that holds and daily RSI stays above 50, the next logical target sits near $0.24. That level marks the confluence of the upper Bollinger Band and the 200-EMA.
A daily close above that level would meaningfully shift the longer-term structure in bulls’ favor. Conversely, a daily close back below the 50-EMA at $0.19, or a decisive loss of the $0.20 pivot support, would suggest the bounce has run out of steam.
The bearish case leans on the fact that 1-hour RSI is still under 50 with MACD offering no real conviction. Add the broader backdrop: a 2.36% drop in total market cap, both classic signs of alt-coin capital flight. If ADA fails to reclaim momentum on shorter timeframes, a retest of the lower Bollinger Band and the $0.16 to $0.19 support zone becomes the more likely path.
By contrast, a clean break and hold above the $0.22 R1 pivot, followed by a reclaim of the $0.24 200-EMA, would take the bearish scenario off the table.
Final Read on Positioning
ADA currently presents unresolved signals rather than a clean trend. The daily chart offers a cautiously constructive read, while the hourly and 15-minute frames show hesitation. The wider market context adds caution, with Greed at 73 paired with a falling total market cap.
ATR readings suggest volatility is moderate rather than dramatic at the moment, so sudden oversized moves are not the base case. Still, that can shift quickly given how tightly price is coiled around its pivot. Anyone tracking this setup should weigh the daily structure against the shorter-term stall rather than picking one and ignoring the other.
Markets that sit this close to key averages and pivot levels tend to resolve with a burst of volatility once one side gives way. The question is simply which side blinks first, and neither the technical nor the on-chain data currently gives a definitive answer.
FAQ
What is Cardano’s price today?
As of August 28, 2026, ADA trades at $0.21.
Why does the daily chart look constructive?
ADA closed above the 20-EMA at $0.20 and the 50-EMA at $0.19, while daily RSI at 58.55 sits above the midline.
Which level matters most for bulls?
The confluence of the upper Bollinger Band and the 200-EMA around $0.24 is the key resistance.
What would invalidate the bullish case?
A daily close below the 50-EMA at $0.19 or a decisive loss of the $0.20 pivot support.
Disclaimer: This article is for informational purposes only and does not constitute financial advice, an investment recommendation, or a solicitation to buy or sell any financial instrument or cryptocurrency. The analysis provided is not indicative of future results. Investing in crypto assets and financial markets carries a high risk of capital loss. Always do your own research (DYOR) and consult a qualified financial advisor before making any decision.
Article produced with the assistance of artificial intelligence and reviewed by the editorial team.
ADA/USDT — daily chart with candlesticks, EMA20/EMA50 and volume.
Key takeaways
ADA trades at $0.21 on August 28, 2026, above the 20- and 50-day averages but below the 200-day EMA at $0.24.
Total crypto market capitalization fell 2.36% in 24 hours, according to CoinGecko.
The Fear & Greed Index reads 73, signaling Greed even as broader market conditions weaken.
Cardano DEX activity is mixed: Splash Protocol grew across all periods while Minswap and SundaeSwap posted weekly and monthly declines.
Daily RSI sits at 58.55, while the 1-hour RSI at 44.25 shows short-term hesitation.
What the Daily Chart Shows
The daily chart leans cautiously constructive, but it does not confirm a full trend reversal. Cardano price today sits at $0.21 on the daily timeframe, above both the 20-EMA at $0.20 and the 50-EMA at $0.19, yet still beneath the 200-EMA at $0.24. Short-term averages are turning up, while the longer-term average still overhangs price as resistance.
The daily RSI at 58.55 supports that reading. It sits comfortably above the midline without flashing overbought, which tells you buyers have some control but have not pushed things to an extreme. MACD, however, is basically flat: line and signal both sit at 0.01 with a histogram of zero. That is a market where momentum has stalled right at the edge of a bullish cross, waiting for a catalyst rather than confirming one.
Bollinger Bands frame the range: the mid-band sits at $0.20, the upper band at $0.24, and the lower band at $0.16. Price is hugging the midline, and notably the upper band lines up almost exactly with the 200-EMA resistance. That confluence at $0.24 is the level that matters most if bulls want to make a real statement.
ATR14 at $0.02 suggests volatility is moderate rather than explosive right now, so a slow grind toward that level is more likely than a sudden spike. Pivot data reinforces the balance: the daily pivot point sits at $0.21, right where price is trading, with R1 at $0.22 and S1 at $0.20. That tight band shows the market has not picked a side yet.
How the 1-Hour and 15-Minute Charts Behave
The shorter timeframes show hesitation rather than trend. On the 1-hour chart, the EMA20, EMA50 and EMA200 have all converged around $0.21, meaning there is no clear trend on this timeframe, just compression. Meanwhile, RSI at 44.25 sits slightly below neutral, a mild sign of hesitation that runs counter to the daily’s more optimistic tone.
MACD is flat here too, offering no confirmation either way. This is the tension worth flagging: the daily chart leans mildly bullish, but the 1-hour chart tells you buyers have not stepped in with any urgency yet.
The 15-minute chart, used purely for execution context, shows RSI at 52.84, almost dead center neutral, with EMAs and Bollinger Bands all bunched near $0.21. There is no directional edge here either. Taken together, the multi-timeframe read shows a daily structure trying to build a base while shorter frames wait for a trigger.
What Cardano’s DEX Activity Reveals
Cardano’s on-chain DEX activity paints a mixed picture beneath the price stabilization. Minswap DEX posted an 18.34% jump in daily fees, but that is set against a 39.51% drop over seven days and a 45.34% decline over the past month.
SundaeSwap V2 shows a similar pattern: up 16.45% on the day, down 61.61% over the week, and down 69.92% over 30 days. Similarly, WingRiders fees fell 15.97% daily and are down roughly 30-40% across the week and month.
The one clear standout is Splash Protocol, which is up 6.41% daily, 13.83% over seven days, and 23.78% over 30 days. It is the only major Cardano DEX showing consistent growth across every window measured. Taken together, this points to a broader deceleration in Cardano network usage even as price attempts to stabilize. That gap is currently visible in the DeFi fee data.
Bullish and Bearish Scenarios
The bullish case depends on holding the $0.20 to $0.21 zone, while the bearish case leans on short-term weakness and capital rotation. For bulls, ADA must hold the cluster formed by the daily EMA20 and the S1 pivot. If that holds and daily RSI stays above 50, the next logical target sits near $0.24. That level marks the confluence of the upper Bollinger Band and the 200-EMA.
A daily close above that level would meaningfully shift the longer-term structure in bulls’ favor. Conversely, a daily close back below the 50-EMA at $0.19, or a decisive loss of the $0.20 pivot support, would suggest the bounce has run out of steam.
The bearish case leans on the fact that 1-hour RSI is still under 50 with MACD offering no real conviction. Add the broader backdrop: a 2.36% drop in total market cap, both classic signs of alt-coin capital flight. If ADA fails to reclaim momentum on shorter timeframes, a retest of the lower Bollinger Band and the $0.16 to $0.19 support zone becomes the more likely path.
By contrast, a clean break and hold above the $0.22 R1 pivot, followed by a reclaim of the $0.24 200-EMA, would take the bearish scenario off the table.
Final Read on Positioning
ADA currently presents unresolved signals rather than a clean trend. The daily chart offers a cautiously constructive read, while the hourly and 15-minute frames show hesitation. The wider market context adds caution, with Greed at 73 paired with a falling total market cap.
ATR readings suggest volatility is moderate rather than dramatic at the moment, so sudden oversized moves are not the base case. Still, that can shift quickly given how tightly price is coiled around its pivot. Anyone tracking this setup should weigh the daily structure against the shorter-term stall rather than picking one and ignoring the other.
Markets that sit this close to key averages and pivot levels tend to resolve with a burst of volatility once one side gives way. The question is simply which side blinks first, and neither the technical nor the on-chain data currently gives a definitive answer.
FAQ
What is Cardano’s price today?
As of August 28, 2026, ADA trades at $0.21.
Why does the daily chart look constructive?
ADA closed above the 20-EMA at $0.20 and the 50-EMA at $0.19, while daily RSI at 58.55 sits above the midline.
Which level matters most for bulls?
The confluence of the upper Bollinger Band and the 200-EMA around $0.24 is the key resistance.
What would invalidate the bullish case?
A daily close below the 50-EMA at $0.19 or a decisive loss of the $0.20 pivot support.
Disclaimer: This article is for informational purposes only and does not constitute financial advice, an investment recommendation, or a solicitation to buy or sell any financial instrument or cryptocurrency. The analysis provided is not indicative of future results. Investing in crypto assets and financial markets carries a high risk of capital loss. Always do your own research (DYOR) and consult a qualified financial advisor before making any decision.
Article produced with the assistance of artificial intelligence and reviewed by the editorial team.
101

Article
Rubrik Stock Tumbles After-Hours Despite Raised Guidance and $1.66B ARRRubrik stock enters the session with a split personality. Technically, the chart is bullish across every timeframe. Yet shares reportedly tumbled after-hours following Thursday’s Q2 report despite a raised outlook. That contrast is the tension traders must weigh.
RBRK — daily chart with candlesticks, EMA20/EMA50 and volume.
Key takeaways
RBRK closed at 107.02 on the daily chart, above stacked bullish EMAs (EMA20 94.36, EMA50 85.68, EMA200 74.22).
Daily RSI14 sits at 67.63, while the 1H RSI14 is overbought at 73.99.
Q2 FY2027 subscription ARR reached $1.66B, with free cash flow of $66M and raised full-year guidance.
Rosenblatt raised its price target on Rubrik citing cyber resilience demand.
Despite the raised outlook, RBRK shares reportedly tumbled in after-hours trading.
Rubrik Stock Technical Picture: Daily Trend Still Points Higher
The daily chart shows Rubrik stock in a firm uptrend. RBRK closed at 107.02, up sharply from an open of 101.99. Price sits well above the EMA20 (94.36), EMA50 (85.68), and EMA200 (74.22). That stacked EMA alignment is a textbook bullish structure. It confirms the broader trend has been intact for some time, not just a one-day spike.
Momentum Check
Daily RSI14 reads 67.63. That is strong momentum, but not yet overbought. There is still room before the indicator flags exhaustion. However, the daily MACD tells a slightly different story. The MACD line sits at 5.38 versus a signal of 5.39, producing a histogram of -0.01. That is essentially flat, hinting at a subtle stall in momentum even as price keeps pushing higher. It is not a reversal signal on its own. Still, it is worth watching closely over the next sessions.
Volatility and Key Levels
Meanwhile, the daily Bollinger Bands frame the move well. With the mid-band at 93.96 and the upper band at 112.86, price at 107.02 is running hot but has not tagged the ceiling. That leaves room for further upside before volatility bands become a constraint. Daily ATR14 stands at 6.04, an elevated reading that confirms large single-session swings are possible. Key daily levels are the pivot at 105.48, resistance at 109.45, and support at 103.04.
Rubrik Stock 1H Chart: Confirms the Trend, But Flags Overheating
The 1-hour chart confirms the daily bullish bias. Meanwhile, its RSI signals that the move is overstretched. EMA20 (101.08), EMA50 (99.15), and EMA200 (91.59) are stacked bullishly, and the regime reads bullish. MACD on this timeframe is more convincing than on the daily. The MACD line at 2.58 sits well above the signal at 1.26, with a healthy positive histogram of 1.32. That is a cleaner bullish momentum signal.
At the same time, RSI14 on the 1H sits at 73.99. That is firmly overbought. It does not invalidate the trend, but it raises the odds of a short-term pause or pullback before the next leg higher. In other words, the 1H confirms the daily uptrend structurally while warning that the move may be stretched. Price at 107.10 is also pressing toward the 1H Bollinger upper band at 110.17, reinforcing a sense of a market running ahead of itself.
15-Minute View: Short-Term Cooling Near Resistance
The 15-minute chart shows the first signs of cooling. The immediate push is losing steam near resistance. RSI14 has eased to 68.67 from the more extreme 1H reading. Meanwhile, the MACD has flipped negative, with the line at 1.65 below the signal at 1.96 for a histogram of -0.30. That is a short-term bearish crossover. It appears right at the 15m pivot resistance of 107.67 and the Bollinger upper band of 107.86.
This does not contradict the larger bullish case. Instead, it simply reflects normal digestion after a sharp advance. The EMA structure on the 15m chart (EMA20 105.73, EMA50 102.44, EMA200 99.36) remains bullish. Therefore, this looks more like consolidation than a trend change. Traders using this timeframe for execution should treat it as a timing tool, not a directional signal.
Rubrik Stock News Conflict: Strong Guidance, Weak Reaction
The fundamental picture is constructive. Yet the after-hours reaction reportedly turned negative. Rubrik’s Q2 FY2027 results showed subscription ARR at $1.66B and free cash flow of $66M. The company also raised its full-year outlook to $1.88B-$1.885B in subscription ARR and $323M-$333M in free cash flow. On paper, that is a constructive set of numbers. Notably, Rosenblatt also raised its price target on Rubrik citing cyber resilience demand.
However, reporting indicates RBRK shares tumbled in after-hours trading despite those strong results and guidance. That is a classic sell-the-news pattern. It matters because the technical readings above are based on the regular session close, before that after-hours move played out. Therefore, there is a real risk that the next cash session opens under pressure. That would test whether the daily uptrend can absorb a fundamentally driven gap.
Bullish Scenario
The bullish case holds if RBRK defends its daily EMA20 and reclaims the first resistance. The stock needs to defend the EMA20 at 94.36 and keep price above the daily pivot at 105.48. A recovery through the daily R1 at 109.45 would open the path toward the upper Bollinger Band near 112.86. Continued strength in subscription ARR guidance and further analyst target increases, such as Rosenblatt’s move, would support that continuation. That would also help absorb any near-term after-hours weakness.
Bearish Scenario
The bearish case activates if after-hours selling breaks the first support level. On the other hand, if that selling pressure carries into the regular session, a break below the daily S1 at 103.04 would be the first warning sign. A daily MACD histogram that turns decisively negative, building on the current -0.01 reading, would confirm a genuine momentum shift rather than a pause. In that case, the EMA20 at 94.36 becomes the next meaningful test. A break there would put the broader uptrend in question.
Closing Take
Overall, Rubrik stock remains technically bullish, but the post-earnings reaction adds near-term risk. The trend structure, EMA alignment, and hourly MACD all point the same direction across the daily, 1H, and 15m timeframes. Meanwhile, an overbought 1H RSI near 74 and a stalling daily MACD histogram suggest the move is due for some digestion. The bigger uncertainty comes from outside the chart: a reported after-hours drop despite raised guidance and a bullish analyst target increase. That disconnect, combined with an elevated daily ATR of 6.04, argues for caution around position sizing. It also calls for close attention to how price behaves around the daily pivot and support levels.
FAQ
Why did Rubrik stock fall after-hours despite strong Q2 results?
Reporting indicates RBRK shares tumbled in after-hours trading even after the company reported Q2 FY2027 subscription ARR of $1.66B and raised its full-year outlook. That pattern resembles a classic sell-the-news reaction, where strong guidance was already reflected in price.
What are the key levels to watch for Rubrik stock?
On the daily chart, the pivot is 105.48, with resistance at 109.45 and support at 103.04. Below that, the daily EMA20 at 94.36 is the next meaningful test. The upper Bollinger Band near 112.86 marks a further upside reference.
Is the bullish trend in Rubrik stock still intact?
Yes. RBRK closed at 107.02, above the stacked daily EMAs (EMA20 94.36, EMA50 85.68, EMA200 74.22). The 1H and 15m EMA structures also remain bullish. However, the 1H RSI at 73.99 and a flat daily MACD histogram signal a possible short-term pause.
Disclaimer: This article is for informational purposes only and does not constitute financial advice, an investment recommendation, or a solicitation to buy or sell any financial instrument or cryptocurrency. The analysis provided is not indicative of future results. Investing in crypto assets and financial markets carries a high risk of capital loss. Always do your own research (DYOR) and consult a qualified financial advisor before making any decision.
Article produced with the assistance of artificial intelligence and reviewed by the editorial team.
Rubrik Stock Tumbles After-Hours Despite Raised Guidance and $1.66B ARR
Rubrik stock enters the session with a split personality. Technically, the chart is bullish across every timeframe. Yet shares reportedly tumbled after-hours following Thursday’s Q2 report despite a raised outlook. That contrast is the tension traders must weigh.
RBRK — daily chart with candlesticks, EMA20/EMA50 and volume.
Key takeaways
RBRK closed at 107.02 on the daily chart, above stacked bullish EMAs (EMA20 94.36, EMA50 85.68, EMA200 74.22).
Daily RSI14 sits at 67.63, while the 1H RSI14 is overbought at 73.99.
Q2 FY2027 subscription ARR reached $1.66B, with free cash flow of $66M and raised full-year guidance.
Rosenblatt raised its price target on Rubrik citing cyber resilience demand.
Despite the raised outlook, RBRK shares reportedly tumbled in after-hours trading.
Rubrik Stock Technical Picture: Daily Trend Still Points Higher
The daily chart shows Rubrik stock in a firm uptrend. RBRK closed at 107.02, up sharply from an open of 101.99. Price sits well above the EMA20 (94.36), EMA50 (85.68), and EMA200 (74.22). That stacked EMA alignment is a textbook bullish structure. It confirms the broader trend has been intact for some time, not just a one-day spike.
Momentum Check
Daily RSI14 reads 67.63. That is strong momentum, but not yet overbought. There is still room before the indicator flags exhaustion. However, the daily MACD tells a slightly different story. The MACD line sits at 5.38 versus a signal of 5.39, producing a histogram of -0.01. That is essentially flat, hinting at a subtle stall in momentum even as price keeps pushing higher. It is not a reversal signal on its own. Still, it is worth watching closely over the next sessions.
Volatility and Key Levels
Meanwhile, the daily Bollinger Bands frame the move well. With the mid-band at 93.96 and the upper band at 112.86, price at 107.02 is running hot but has not tagged the ceiling. That leaves room for further upside before volatility bands become a constraint. Daily ATR14 stands at 6.04, an elevated reading that confirms large single-session swings are possible. Key daily levels are the pivot at 105.48, resistance at 109.45, and support at 103.04.
Rubrik Stock 1H Chart: Confirms the Trend, But Flags Overheating
The 1-hour chart confirms the daily bullish bias. Meanwhile, its RSI signals that the move is overstretched. EMA20 (101.08), EMA50 (99.15), and EMA200 (91.59) are stacked bullishly, and the regime reads bullish. MACD on this timeframe is more convincing than on the daily. The MACD line at 2.58 sits well above the signal at 1.26, with a healthy positive histogram of 1.32. That is a cleaner bullish momentum signal.
At the same time, RSI14 on the 1H sits at 73.99. That is firmly overbought. It does not invalidate the trend, but it raises the odds of a short-term pause or pullback before the next leg higher. In other words, the 1H confirms the daily uptrend structurally while warning that the move may be stretched. Price at 107.10 is also pressing toward the 1H Bollinger upper band at 110.17, reinforcing a sense of a market running ahead of itself.
15-Minute View: Short-Term Cooling Near Resistance
The 15-minute chart shows the first signs of cooling. The immediate push is losing steam near resistance. RSI14 has eased to 68.67 from the more extreme 1H reading. Meanwhile, the MACD has flipped negative, with the line at 1.65 below the signal at 1.96 for a histogram of -0.30. That is a short-term bearish crossover. It appears right at the 15m pivot resistance of 107.67 and the Bollinger upper band of 107.86.
This does not contradict the larger bullish case. Instead, it simply reflects normal digestion after a sharp advance. The EMA structure on the 15m chart (EMA20 105.73, EMA50 102.44, EMA200 99.36) remains bullish. Therefore, this looks more like consolidation than a trend change. Traders using this timeframe for execution should treat it as a timing tool, not a directional signal.
Rubrik Stock News Conflict: Strong Guidance, Weak Reaction
The fundamental picture is constructive. Yet the after-hours reaction reportedly turned negative. Rubrik’s Q2 FY2027 results showed subscription ARR at $1.66B and free cash flow of $66M. The company also raised its full-year outlook to $1.88B-$1.885B in subscription ARR and $323M-$333M in free cash flow. On paper, that is a constructive set of numbers. Notably, Rosenblatt also raised its price target on Rubrik citing cyber resilience demand.
However, reporting indicates RBRK shares tumbled in after-hours trading despite those strong results and guidance. That is a classic sell-the-news pattern. It matters because the technical readings above are based on the regular session close, before that after-hours move played out. Therefore, there is a real risk that the next cash session opens under pressure. That would test whether the daily uptrend can absorb a fundamentally driven gap.
Bullish Scenario
The bullish case holds if RBRK defends its daily EMA20 and reclaims the first resistance. The stock needs to defend the EMA20 at 94.36 and keep price above the daily pivot at 105.48. A recovery through the daily R1 at 109.45 would open the path toward the upper Bollinger Band near 112.86. Continued strength in subscription ARR guidance and further analyst target increases, such as Rosenblatt’s move, would support that continuation. That would also help absorb any near-term after-hours weakness.
Bearish Scenario
The bearish case activates if after-hours selling breaks the first support level. On the other hand, if that selling pressure carries into the regular session, a break below the daily S1 at 103.04 would be the first warning sign. A daily MACD histogram that turns decisively negative, building on the current -0.01 reading, would confirm a genuine momentum shift rather than a pause. In that case, the EMA20 at 94.36 becomes the next meaningful test. A break there would put the broader uptrend in question.
Closing Take
Overall, Rubrik stock remains technically bullish, but the post-earnings reaction adds near-term risk. The trend structure, EMA alignment, and hourly MACD all point the same direction across the daily, 1H, and 15m timeframes. Meanwhile, an overbought 1H RSI near 74 and a stalling daily MACD histogram suggest the move is due for some digestion. The bigger uncertainty comes from outside the chart: a reported after-hours drop despite raised guidance and a bullish analyst target increase. That disconnect, combined with an elevated daily ATR of 6.04, argues for caution around position sizing. It also calls for close attention to how price behaves around the daily pivot and support levels.
FAQ
Why did Rubrik stock fall after-hours despite strong Q2 results?
Reporting indicates RBRK shares tumbled in after-hours trading even after the company reported Q2 FY2027 subscription ARR of $1.66B and raised its full-year outlook. That pattern resembles a classic sell-the-news reaction, where strong guidance was already reflected in price.
What are the key levels to watch for Rubrik stock?
On the daily chart, the pivot is 105.48, with resistance at 109.45 and support at 103.04. Below that, the daily EMA20 at 94.36 is the next meaningful test. The upper Bollinger Band near 112.86 marks a further upside reference.
Is the bullish trend in Rubrik stock still intact?
Yes. RBRK closed at 107.02, above the stacked daily EMAs (EMA20 94.36, EMA50 85.68, EMA200 74.22). The 1H and 15m EMA structures also remain bullish. However, the 1H RSI at 73.99 and a flat daily MACD histogram signal a possible short-term pause.
Disclaimer: This article is for informational purposes only and does not constitute financial advice, an investment recommendation, or a solicitation to buy or sell any financial instrument or cryptocurrency. The analysis provided is not indicative of future results. Investing in crypto assets and financial markets carries a high risk of capital loss. Always do your own research (DYOR) and consult a qualified financial advisor before making any decision.
Article produced with the assistance of artificial intelligence and reviewed by the editorial team.
RBRK — daily chart with candlesticks, EMA20/EMA50 and volume.
Key takeaways
RBRK closed at 107.02 on the daily chart, above stacked bullish EMAs (EMA20 94.36, EMA50 85.68, EMA200 74.22).
Daily RSI14 sits at 67.63, while the 1H RSI14 is overbought at 73.99.
Q2 FY2027 subscription ARR reached $1.66B, with free cash flow of $66M and raised full-year guidance.
Rosenblatt raised its price target on Rubrik citing cyber resilience demand.
Despite the raised outlook, RBRK shares reportedly tumbled in after-hours trading.
Rubrik Stock Technical Picture: Daily Trend Still Points Higher
The daily chart shows Rubrik stock in a firm uptrend. RBRK closed at 107.02, up sharply from an open of 101.99. Price sits well above the EMA20 (94.36), EMA50 (85.68), and EMA200 (74.22). That stacked EMA alignment is a textbook bullish structure. It confirms the broader trend has been intact for some time, not just a one-day spike.
Momentum Check
Daily RSI14 reads 67.63. That is strong momentum, but not yet overbought. There is still room before the indicator flags exhaustion. However, the daily MACD tells a slightly different story. The MACD line sits at 5.38 versus a signal of 5.39, producing a histogram of -0.01. That is essentially flat, hinting at a subtle stall in momentum even as price keeps pushing higher. It is not a reversal signal on its own. Still, it is worth watching closely over the next sessions.
Volatility and Key Levels
Meanwhile, the daily Bollinger Bands frame the move well. With the mid-band at 93.96 and the upper band at 112.86, price at 107.02 is running hot but has not tagged the ceiling. That leaves room for further upside before volatility bands become a constraint. Daily ATR14 stands at 6.04, an elevated reading that confirms large single-session swings are possible. Key daily levels are the pivot at 105.48, resistance at 109.45, and support at 103.04.
Rubrik Stock 1H Chart: Confirms the Trend, But Flags Overheating
The 1-hour chart confirms the daily bullish bias. Meanwhile, its RSI signals that the move is overstretched. EMA20 (101.08), EMA50 (99.15), and EMA200 (91.59) are stacked bullishly, and the regime reads bullish. MACD on this timeframe is more convincing than on the daily. The MACD line at 2.58 sits well above the signal at 1.26, with a healthy positive histogram of 1.32. That is a cleaner bullish momentum signal.
At the same time, RSI14 on the 1H sits at 73.99. That is firmly overbought. It does not invalidate the trend, but it raises the odds of a short-term pause or pullback before the next leg higher. In other words, the 1H confirms the daily uptrend structurally while warning that the move may be stretched. Price at 107.10 is also pressing toward the 1H Bollinger upper band at 110.17, reinforcing a sense of a market running ahead of itself.
15-Minute View: Short-Term Cooling Near Resistance
The 15-minute chart shows the first signs of cooling. The immediate push is losing steam near resistance. RSI14 has eased to 68.67 from the more extreme 1H reading. Meanwhile, the MACD has flipped negative, with the line at 1.65 below the signal at 1.96 for a histogram of -0.30. That is a short-term bearish crossover. It appears right at the 15m pivot resistance of 107.67 and the Bollinger upper band of 107.86.
This does not contradict the larger bullish case. Instead, it simply reflects normal digestion after a sharp advance. The EMA structure on the 15m chart (EMA20 105.73, EMA50 102.44, EMA200 99.36) remains bullish. Therefore, this looks more like consolidation than a trend change. Traders using this timeframe for execution should treat it as a timing tool, not a directional signal.
Rubrik Stock News Conflict: Strong Guidance, Weak Reaction
The fundamental picture is constructive. Yet the after-hours reaction reportedly turned negative. Rubrik’s Q2 FY2027 results showed subscription ARR at $1.66B and free cash flow of $66M. The company also raised its full-year outlook to $1.88B-$1.885B in subscription ARR and $323M-$333M in free cash flow. On paper, that is a constructive set of numbers. Notably, Rosenblatt also raised its price target on Rubrik citing cyber resilience demand.
However, reporting indicates RBRK shares tumbled in after-hours trading despite those strong results and guidance. That is a classic sell-the-news pattern. It matters because the technical readings above are based on the regular session close, before that after-hours move played out. Therefore, there is a real risk that the next cash session opens under pressure. That would test whether the daily uptrend can absorb a fundamentally driven gap.
Bullish Scenario
The bullish case holds if RBRK defends its daily EMA20 and reclaims the first resistance. The stock needs to defend the EMA20 at 94.36 and keep price above the daily pivot at 105.48. A recovery through the daily R1 at 109.45 would open the path toward the upper Bollinger Band near 112.86. Continued strength in subscription ARR guidance and further analyst target increases, such as Rosenblatt’s move, would support that continuation. That would also help absorb any near-term after-hours weakness.
Bearish Scenario
The bearish case activates if after-hours selling breaks the first support level. On the other hand, if that selling pressure carries into the regular session, a break below the daily S1 at 103.04 would be the first warning sign. A daily MACD histogram that turns decisively negative, building on the current -0.01 reading, would confirm a genuine momentum shift rather than a pause. In that case, the EMA20 at 94.36 becomes the next meaningful test. A break there would put the broader uptrend in question.
Closing Take
Overall, Rubrik stock remains technically bullish, but the post-earnings reaction adds near-term risk. The trend structure, EMA alignment, and hourly MACD all point the same direction across the daily, 1H, and 15m timeframes. Meanwhile, an overbought 1H RSI near 74 and a stalling daily MACD histogram suggest the move is due for some digestion. The bigger uncertainty comes from outside the chart: a reported after-hours drop despite raised guidance and a bullish analyst target increase. That disconnect, combined with an elevated daily ATR of 6.04, argues for caution around position sizing. It also calls for close attention to how price behaves around the daily pivot and support levels.
FAQ
Why did Rubrik stock fall after-hours despite strong Q2 results?
Reporting indicates RBRK shares tumbled in after-hours trading even after the company reported Q2 FY2027 subscription ARR of $1.66B and raised its full-year outlook. That pattern resembles a classic sell-the-news reaction, where strong guidance was already reflected in price.
What are the key levels to watch for Rubrik stock?
On the daily chart, the pivot is 105.48, with resistance at 109.45 and support at 103.04. Below that, the daily EMA20 at 94.36 is the next meaningful test. The upper Bollinger Band near 112.86 marks a further upside reference.
Is the bullish trend in Rubrik stock still intact?
Yes. RBRK closed at 107.02, above the stacked daily EMAs (EMA20 94.36, EMA50 85.68, EMA200 74.22). The 1H and 15m EMA structures also remain bullish. However, the 1H RSI at 73.99 and a flat daily MACD histogram signal a possible short-term pause.
Disclaimer: This article is for informational purposes only and does not constitute financial advice, an investment recommendation, or a solicitation to buy or sell any financial instrument or cryptocurrency. The analysis provided is not indicative of future results. Investing in crypto assets and financial markets carries a high risk of capital loss. Always do your own research (DYOR) and consult a qualified financial advisor before making any decision.
Article produced with the assistance of artificial intelligence and reviewed by the editorial team.
7

Article
OpenSea AI integration links live market data to Perplexity across 25+ chainsOpenSea has quietly moved from being a place to buy digital art into something closer to a data engine for artificial intelligence. The company announced this week that its live onchain market data is now feeding directly into Perplexity Computer, the AI agent platform built by Perplexity, marking a notable step in the OpenSea AI integration push that both companies say reflects where crypto markets are heading. The partnership, confirmed in an announcement shared with crypto.news on August 27, lets Perplexity’s AI pull real trading activity from OpenSea instead of relying on static price feeds or outdated snapshots.
Key takeaways
OpenSea has connected its marketplace data to Perplexity Computer, giving the AI agent access to live onchain activity across more than 25 blockchains.
Users can ask Perplexity about the most-traded tokens, trending collectibles, or NFT activity, and get answers with cited OpenSea data.
The move is part of OpenSea’s broader shift from an NFT marketplace toward a “trade everything” platform that includes tokens, mobile trading, and soon perpetual futures.
OpenSea delayed the launch of its native SEA token in March 2026, citing difficult market conditions, after originally introducing the plan in February 2025.
OpenSea acquired Rally Wallet in July 2025 to strengthen its mobile and token trading capabilities.
OpenSea Integrates Live Market Data With Perplexity Computer AI
The core of this news is simple: OpenSea’s onchain marketplace data is now available inside an AI system that people already use to research and act on information. This is not a cosmetic partnership — it changes how someone can ask an AI assistant about what’s actually happening on crypto markets right now, rather than getting a generic or delayed summary.
Real-Time Access Across 25+ Blockchains
With the connector switched on, Perplexity Computer can pull marketplace activity spanning tokens, NFTs, and collectibles across more than 25 chains supported by OpenSea. That means a user asking which assets are drawing the most trading volume, or which collectibles are gaining momentum, can get an answer grounded in what’s actually being bought and sold onchain — not a static price chart. This scope is central to the appeal of Perplexity Computer market data sourced from OpenSea: it spans an unusually wide slice of the onchain economy for a single connector.
Multi-Step AI Task Support With Cited Data Sources
Perplexity Computer is designed to complete multi-step tasks and back up its answers with cited sources. Folding OpenSea into that model means the platform can now treat onchain trading information the same way it treats other verified data — as something it can reference, quote, and build follow-up actions around. According to OpenSea, the connector is live now and available through Perplexity Computer’s Connectors page, so the feature isn’t a future promise; it’s already accessible to users today.
Why this matters: AI agents are increasingly becoming the interface through which people interact with financial and crypto information. If OpenSea’s data becomes a default reference point for AI-driven market questions, it strengthens the company’s position well beyond its own app — and sets a template other crypto platforms may look to copy.
OpenSea’s Strategic Expansion Beyond the NFT Marketplace
OpenSea’s deal with Perplexity is the latest sign that the company sees itself as far more than the NFT trading hub it was originally known for. Over the past year, OpenSea has stacked several moves that point toward a single ambition: building what it has publicly described as a “trade everything” platform.
Perpetual Futures Trading With Hyperliquid
Back in June, crypto.news reported that OpenSea was preparing to launch OpenSea perpetual futures trading using infrastructure from Hyperliquid. OpenSea’s Product Marketing Lead, Zack Brenner, confirmed on X that Hyperliquid would power the product after a user asked directly, though the company had not released a launch date, a full list of supported assets, or user terms at that time. The move would push OpenSea beyond spot tokens and NFTs into derivatives, a segment it has never operated in before.
OS2 and the Push Toward Combined Trading
OpenSea’s OS2 overhaul already merged fungible token and NFT trading into a single platform spanning multiple networks, cutting down on the need for users to jump between separate apps for different asset types. At the time OS2 launched, it supported 19 blockchains with cross-chain functionality and real-time liquidity aggregation — a number that has since grown past 25 with the data now feeding Perplexity. This progression illustrates how cross-chain NFT trading has evolved from a niche feature into a structural part of OpenSea’s product identity.
SEA Token Delay
OpenSea originally unveiled plans for its native SEA token in February 2025, with the OpenSea Foundation saying historical marketplace activity would factor into allocations and that U.S. users would be eligible. The token was meant to anchor utility, governance, and ecosystem incentives across the platform. But the company postponed the launch in March 2026, with CEO Devin Finzer pointing to challenging market conditions. OpenSea did not give a revised timeline when it announced the delay.
Rally Wallet Acquisition
Two months before the AI-powered mobile product announcement in September 2025, OpenSea acquired Rally Wallet, a mobile-first wallet built for NFTs and tokens, to strengthen its own mobile and token trading business. The acquisition arrived alongside an AI-powered mobile product and changes to OpenSea’s rewards program, all part of the same broader shift from a marketplace centered on NFTs toward one built around tokens, mobile access, and now AI-sourced data.
Leadership Perspectives on AI and Onchain Markets
Both companies frame this partnership as more than a data-sharing arrangement — they describe it as a natural fit between how crypto markets operate and how AI agents are meant to function. “Onchain markets are built for AI agents. Everything is open, live, and verifiable,” said OpenSea co-founder and CEO Devin Finzer. He added that people are already asking what’s moving onchain, and that surfacing OpenSea data inside Perplexity Computer means “those answers come straight from real marketplace activity, not from stale data or guesswork.”
Perplexity’s Head of Live Events Products, Jeff Grimes, echoed that framing from the AI side of the partnership. “Onchain markets move too quickly for static answers,” Grimes said, noting that OpenSea’s real-time, cross-chain data lets users ask what’s moving across tokens and collectibles and “get a current, cited answer grounded in actual market activity.” Together, the two statements point to a shared bet: that transparent, publicly verifiable blockchain data is uniquely suited to feed AI systems that are supposed to cite their sources rather than guess.
OpenSea has said it expects more integrations of this kind as AI agents take on a bigger role in how people discover and interact with crypto markets. For now, the Perplexity connector stands as the clearest example yet of OpenSea’s data reaching users who may never open the OpenSea app itself.
FAQ
What does the OpenSea-Perplexity Computer integration enable for users?
It allows Perplexity’s AI to access live market data from OpenSea across more than 25 blockchains, enabling dynamic queries on tokens, NFTs, and collectibles with cited sources.
How does OpenSea’s OS2 platform enhance trading?
OS2 combines fungible token and NFT trading across multiple networks, reducing the need for users to switch between different applications.
Why was the launch of the SEA token delayed?
OpenSea postponed the SEA token launch in March 2026 due to challenging market conditions, without providing a new launch date.
What is OpenSea’s vision for its platform’s future?
OpenSea aims to become a “trade everything” platform offering expansive trading services beyond NFTs, including perpetual futures and cross-chain asset trading.
Article produced with the assistance of artificial intelligence and reviewed by the editorial team.
OpenSea AI integration links live market data to Perplexity across 25+ chains
OpenSea has quietly moved from being a place to buy digital art into something closer to a data engine for artificial intelligence. The company announced this week that its live onchain market data is now feeding directly into Perplexity Computer, the AI agent platform built by Perplexity, marking a notable step in the OpenSea AI integration push that both companies say reflects where crypto markets are heading. The partnership, confirmed in an announcement shared with crypto.news on August 27, lets Perplexity’s AI pull real trading activity from OpenSea instead of relying on static price feeds or outdated snapshots.
Key takeaways
OpenSea has connected its marketplace data to Perplexity Computer, giving the AI agent access to live onchain activity across more than 25 blockchains.
Users can ask Perplexity about the most-traded tokens, trending collectibles, or NFT activity, and get answers with cited OpenSea data.
The move is part of OpenSea’s broader shift from an NFT marketplace toward a “trade everything” platform that includes tokens, mobile trading, and soon perpetual futures.
OpenSea delayed the launch of its native SEA token in March 2026, citing difficult market conditions, after originally introducing the plan in February 2025.
OpenSea acquired Rally Wallet in July 2025 to strengthen its mobile and token trading capabilities.
OpenSea Integrates Live Market Data With Perplexity Computer AI
The core of this news is simple: OpenSea’s onchain marketplace data is now available inside an AI system that people already use to research and act on information. This is not a cosmetic partnership — it changes how someone can ask an AI assistant about what’s actually happening on crypto markets right now, rather than getting a generic or delayed summary.
Real-Time Access Across 25+ Blockchains
With the connector switched on, Perplexity Computer can pull marketplace activity spanning tokens, NFTs, and collectibles across more than 25 chains supported by OpenSea. That means a user asking which assets are drawing the most trading volume, or which collectibles are gaining momentum, can get an answer grounded in what’s actually being bought and sold onchain — not a static price chart. This scope is central to the appeal of Perplexity Computer market data sourced from OpenSea: it spans an unusually wide slice of the onchain economy for a single connector.
Multi-Step AI Task Support With Cited Data Sources
Perplexity Computer is designed to complete multi-step tasks and back up its answers with cited sources. Folding OpenSea into that model means the platform can now treat onchain trading information the same way it treats other verified data — as something it can reference, quote, and build follow-up actions around. According to OpenSea, the connector is live now and available through Perplexity Computer’s Connectors page, so the feature isn’t a future promise; it’s already accessible to users today.
Why this matters: AI agents are increasingly becoming the interface through which people interact with financial and crypto information. If OpenSea’s data becomes a default reference point for AI-driven market questions, it strengthens the company’s position well beyond its own app — and sets a template other crypto platforms may look to copy.
OpenSea’s Strategic Expansion Beyond the NFT Marketplace
OpenSea’s deal with Perplexity is the latest sign that the company sees itself as far more than the NFT trading hub it was originally known for. Over the past year, OpenSea has stacked several moves that point toward a single ambition: building what it has publicly described as a “trade everything” platform.
Perpetual Futures Trading With Hyperliquid
Back in June, crypto.news reported that OpenSea was preparing to launch OpenSea perpetual futures trading using infrastructure from Hyperliquid. OpenSea’s Product Marketing Lead, Zack Brenner, confirmed on X that Hyperliquid would power the product after a user asked directly, though the company had not released a launch date, a full list of supported assets, or user terms at that time. The move would push OpenSea beyond spot tokens and NFTs into derivatives, a segment it has never operated in before.
OS2 and the Push Toward Combined Trading
OpenSea’s OS2 overhaul already merged fungible token and NFT trading into a single platform spanning multiple networks, cutting down on the need for users to jump between separate apps for different asset types. At the time OS2 launched, it supported 19 blockchains with cross-chain functionality and real-time liquidity aggregation — a number that has since grown past 25 with the data now feeding Perplexity. This progression illustrates how cross-chain NFT trading has evolved from a niche feature into a structural part of OpenSea’s product identity.
SEA Token Delay
OpenSea originally unveiled plans for its native SEA token in February 2025, with the OpenSea Foundation saying historical marketplace activity would factor into allocations and that U.S. users would be eligible. The token was meant to anchor utility, governance, and ecosystem incentives across the platform. But the company postponed the launch in March 2026, with CEO Devin Finzer pointing to challenging market conditions. OpenSea did not give a revised timeline when it announced the delay.
Rally Wallet Acquisition
Two months before the AI-powered mobile product announcement in September 2025, OpenSea acquired Rally Wallet, a mobile-first wallet built for NFTs and tokens, to strengthen its own mobile and token trading business. The acquisition arrived alongside an AI-powered mobile product and changes to OpenSea’s rewards program, all part of the same broader shift from a marketplace centered on NFTs toward one built around tokens, mobile access, and now AI-sourced data.
Leadership Perspectives on AI and Onchain Markets
Both companies frame this partnership as more than a data-sharing arrangement — they describe it as a natural fit between how crypto markets operate and how AI agents are meant to function. “Onchain markets are built for AI agents. Everything is open, live, and verifiable,” said OpenSea co-founder and CEO Devin Finzer. He added that people are already asking what’s moving onchain, and that surfacing OpenSea data inside Perplexity Computer means “those answers come straight from real marketplace activity, not from stale data or guesswork.”
Perplexity’s Head of Live Events Products, Jeff Grimes, echoed that framing from the AI side of the partnership. “Onchain markets move too quickly for static answers,” Grimes said, noting that OpenSea’s real-time, cross-chain data lets users ask what’s moving across tokens and collectibles and “get a current, cited answer grounded in actual market activity.” Together, the two statements point to a shared bet: that transparent, publicly verifiable blockchain data is uniquely suited to feed AI systems that are supposed to cite their sources rather than guess.
OpenSea has said it expects more integrations of this kind as AI agents take on a bigger role in how people discover and interact with crypto markets. For now, the Perplexity connector stands as the clearest example yet of OpenSea’s data reaching users who may never open the OpenSea app itself.
FAQ
What does the OpenSea-Perplexity Computer integration enable for users?
It allows Perplexity’s AI to access live market data from OpenSea across more than 25 blockchains, enabling dynamic queries on tokens, NFTs, and collectibles with cited sources.
How does OpenSea’s OS2 platform enhance trading?
OS2 combines fungible token and NFT trading across multiple networks, reducing the need for users to switch between different applications.
Why was the launch of the SEA token delayed?
OpenSea postponed the SEA token launch in March 2026 due to challenging market conditions, without providing a new launch date.
What is OpenSea’s vision for its platform’s future?
OpenSea aims to become a “trade everything” platform offering expansive trading services beyond NFTs, including perpetual futures and cross-chain asset trading.
Article produced with the assistance of artificial intelligence and reviewed by the editorial team.
Key takeaways
OpenSea has connected its marketplace data to Perplexity Computer, giving the AI agent access to live onchain activity across more than 25 blockchains.
Users can ask Perplexity about the most-traded tokens, trending collectibles, or NFT activity, and get answers with cited OpenSea data.
The move is part of OpenSea’s broader shift from an NFT marketplace toward a “trade everything” platform that includes tokens, mobile trading, and soon perpetual futures.
OpenSea delayed the launch of its native SEA token in March 2026, citing difficult market conditions, after originally introducing the plan in February 2025.
OpenSea acquired Rally Wallet in July 2025 to strengthen its mobile and token trading capabilities.
OpenSea Integrates Live Market Data With Perplexity Computer AI
The core of this news is simple: OpenSea’s onchain marketplace data is now available inside an AI system that people already use to research and act on information. This is not a cosmetic partnership — it changes how someone can ask an AI assistant about what’s actually happening on crypto markets right now, rather than getting a generic or delayed summary.
Real-Time Access Across 25+ Blockchains
With the connector switched on, Perplexity Computer can pull marketplace activity spanning tokens, NFTs, and collectibles across more than 25 chains supported by OpenSea. That means a user asking which assets are drawing the most trading volume, or which collectibles are gaining momentum, can get an answer grounded in what’s actually being bought and sold onchain — not a static price chart. This scope is central to the appeal of Perplexity Computer market data sourced from OpenSea: it spans an unusually wide slice of the onchain economy for a single connector.
Multi-Step AI Task Support With Cited Data Sources
Perplexity Computer is designed to complete multi-step tasks and back up its answers with cited sources. Folding OpenSea into that model means the platform can now treat onchain trading information the same way it treats other verified data — as something it can reference, quote, and build follow-up actions around. According to OpenSea, the connector is live now and available through Perplexity Computer’s Connectors page, so the feature isn’t a future promise; it’s already accessible to users today.
Why this matters: AI agents are increasingly becoming the interface through which people interact with financial and crypto information. If OpenSea’s data becomes a default reference point for AI-driven market questions, it strengthens the company’s position well beyond its own app — and sets a template other crypto platforms may look to copy.
OpenSea’s Strategic Expansion Beyond the NFT Marketplace
OpenSea’s deal with Perplexity is the latest sign that the company sees itself as far more than the NFT trading hub it was originally known for. Over the past year, OpenSea has stacked several moves that point toward a single ambition: building what it has publicly described as a “trade everything” platform.
Perpetual Futures Trading With Hyperliquid
Back in June, crypto.news reported that OpenSea was preparing to launch OpenSea perpetual futures trading using infrastructure from Hyperliquid. OpenSea’s Product Marketing Lead, Zack Brenner, confirmed on X that Hyperliquid would power the product after a user asked directly, though the company had not released a launch date, a full list of supported assets, or user terms at that time. The move would push OpenSea beyond spot tokens and NFTs into derivatives, a segment it has never operated in before.
OS2 and the Push Toward Combined Trading
OpenSea’s OS2 overhaul already merged fungible token and NFT trading into a single platform spanning multiple networks, cutting down on the need for users to jump between separate apps for different asset types. At the time OS2 launched, it supported 19 blockchains with cross-chain functionality and real-time liquidity aggregation — a number that has since grown past 25 with the data now feeding Perplexity. This progression illustrates how cross-chain NFT trading has evolved from a niche feature into a structural part of OpenSea’s product identity.
SEA Token Delay
OpenSea originally unveiled plans for its native SEA token in February 2025, with the OpenSea Foundation saying historical marketplace activity would factor into allocations and that U.S. users would be eligible. The token was meant to anchor utility, governance, and ecosystem incentives across the platform. But the company postponed the launch in March 2026, with CEO Devin Finzer pointing to challenging market conditions. OpenSea did not give a revised timeline when it announced the delay.
Rally Wallet Acquisition
Two months before the AI-powered mobile product announcement in September 2025, OpenSea acquired Rally Wallet, a mobile-first wallet built for NFTs and tokens, to strengthen its own mobile and token trading business. The acquisition arrived alongside an AI-powered mobile product and changes to OpenSea’s rewards program, all part of the same broader shift from a marketplace centered on NFTs toward one built around tokens, mobile access, and now AI-sourced data.
Leadership Perspectives on AI and Onchain Markets
Both companies frame this partnership as more than a data-sharing arrangement — they describe it as a natural fit between how crypto markets operate and how AI agents are meant to function. “Onchain markets are built for AI agents. Everything is open, live, and verifiable,” said OpenSea co-founder and CEO Devin Finzer. He added that people are already asking what’s moving onchain, and that surfacing OpenSea data inside Perplexity Computer means “those answers come straight from real marketplace activity, not from stale data or guesswork.”
Perplexity’s Head of Live Events Products, Jeff Grimes, echoed that framing from the AI side of the partnership. “Onchain markets move too quickly for static answers,” Grimes said, noting that OpenSea’s real-time, cross-chain data lets users ask what’s moving across tokens and collectibles and “get a current, cited answer grounded in actual market activity.” Together, the two statements point to a shared bet: that transparent, publicly verifiable blockchain data is uniquely suited to feed AI systems that are supposed to cite their sources rather than guess.
OpenSea has said it expects more integrations of this kind as AI agents take on a bigger role in how people discover and interact with crypto markets. For now, the Perplexity connector stands as the clearest example yet of OpenSea’s data reaching users who may never open the OpenSea app itself.
FAQ
What does the OpenSea-Perplexity Computer integration enable for users?
It allows Perplexity’s AI to access live market data from OpenSea across more than 25 blockchains, enabling dynamic queries on tokens, NFTs, and collectibles with cited sources.
How does OpenSea’s OS2 platform enhance trading?
OS2 combines fungible token and NFT trading across multiple networks, reducing the need for users to switch between different applications.
Why was the launch of the SEA token delayed?
OpenSea postponed the SEA token launch in March 2026 due to challenging market conditions, without providing a new launch date.
What is OpenSea’s vision for its platform’s future?
OpenSea aims to become a “trade everything” platform offering expansive trading services beyond NFTs, including perpetual futures and cross-chain asset trading.
Article produced with the assistance of artificial intelligence and reviewed by the editorial team.
86
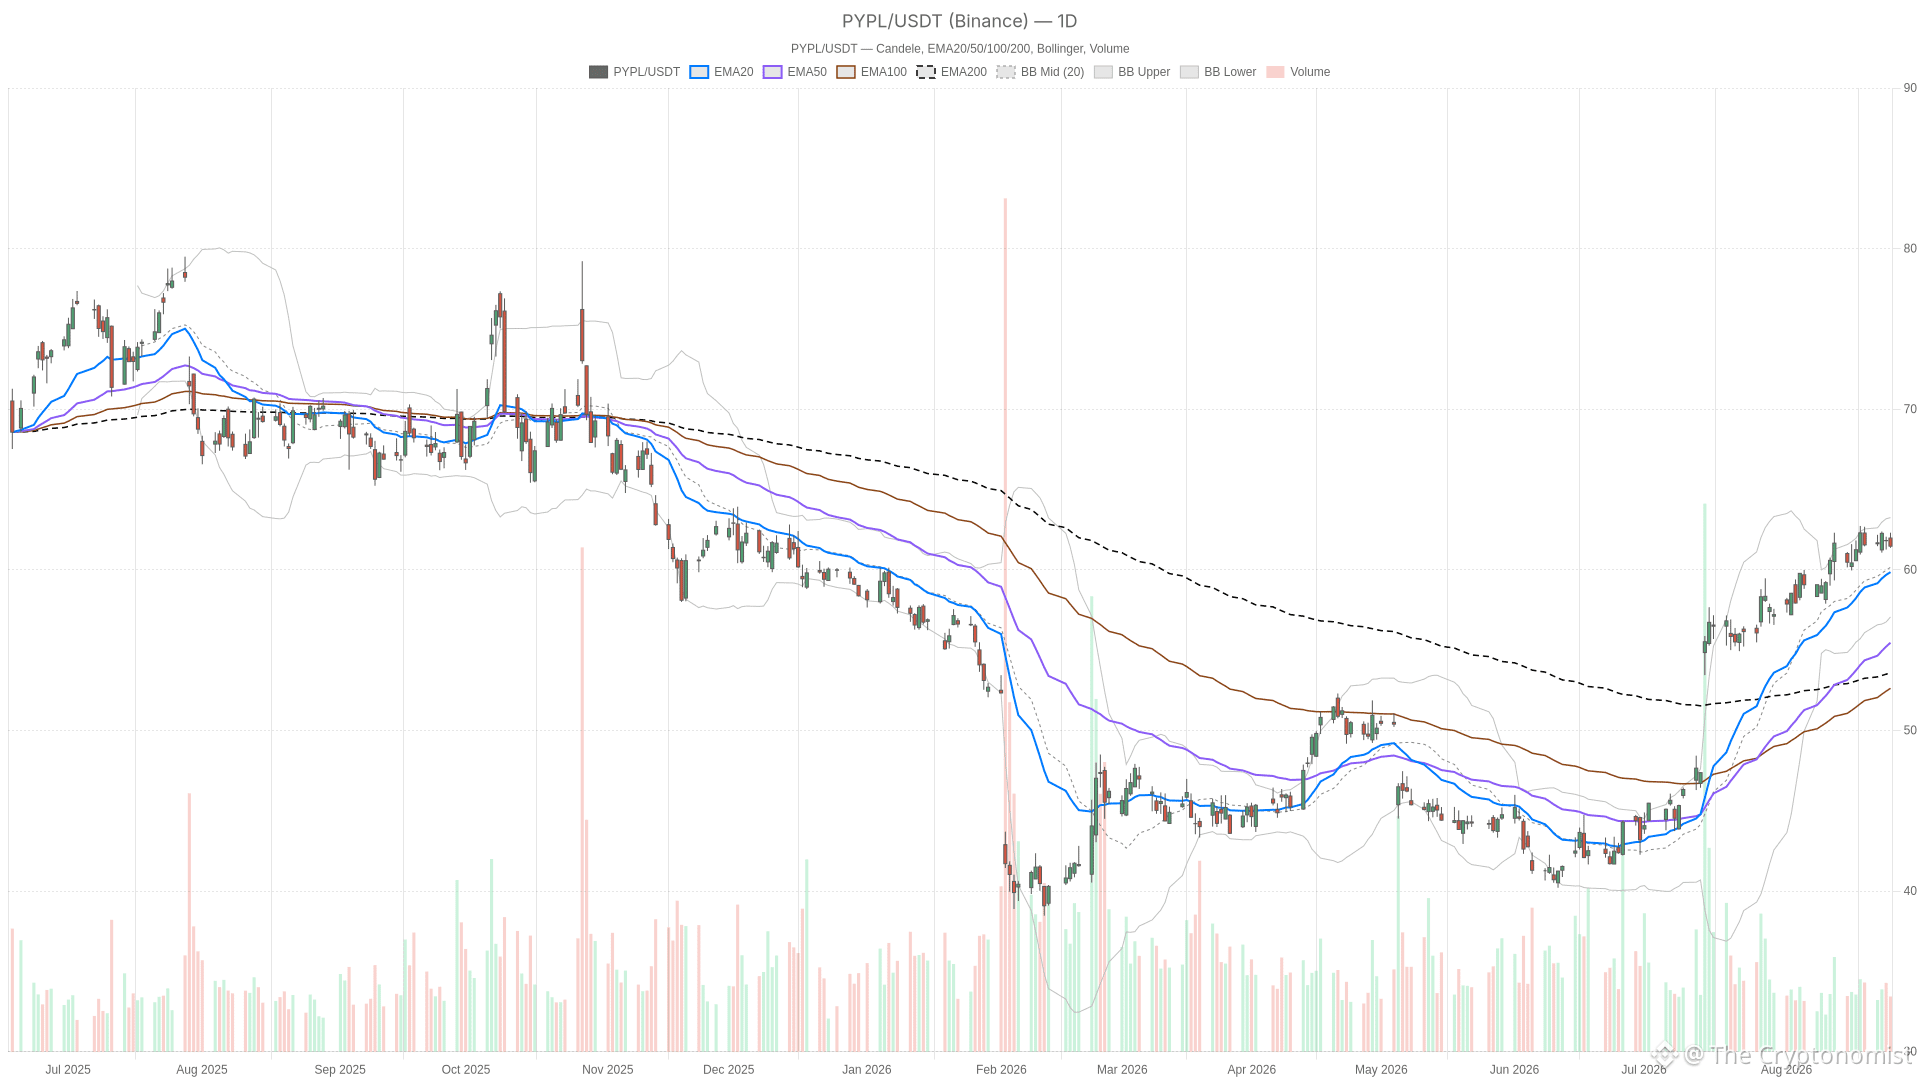
Article
PayPal Stock Stays Bullish After $50 Billion Stripe Buyout Falls ApartPayPal stock enters the new session at a technical crossroads. The daily chart still shows a well-established uptrend, but the last 24 hours have introduced fresh headline risk after Advent and Stripe abandoned their $50 billion pursuit of PayPal.
PYPL — daily chart with candlesticks, EMA20/EMA50 and volume.
Key takeaways
PYPL closed at 61.47 on the daily chart, below the session pivot of 61.72.
The daily trend remains bullish, with price above the EMA20 at 59.85, the EMA50 at 55.46, and the EMA200 at 53.58.
Daily RSI14 at 65.54 and a negative MACD histogram of -0.29 suggest momentum is cooling.
Intraday H1 and 15-minute signals lean neutral-to-soft, with price below their short-term EMAs.
Advent and Stripe have reportedly abandoned their $50 billion pursuit of PayPal, removing a takeover catalyst.
PayPal Stock Price Action and Trend Structure
PayPal stock remains in a durable bullish uptrend on the daily chart, even after settling below the session’s pivot point. On the daily timeframe, PYPL closed at 61.47 after trading between 61.37 and 62.31, below the pivot of 61.72.
Meanwhile, the broader trend is constructive. Price sits above the EMA20 at 59.85, the EMA50 at 55.46, and the EMA200 at 53.58. This stacked structure confirms a bullish regime that has been building over recent months.
The daily RSI14 reads 65.54, firm but not yet stretched into extreme overbought territory. However, the MACD tells a slightly different story. Its line sits at 2.17 against a signal line of 2.46, producing a negative histogram of -0.29. That divergence suggests momentum is decelerating even as the trend remains intact. In other words, the rally is not broken, but it is catching its breath.
Bollinger Bands show the mid-band at 60.16, with the upper band at 63.25 and the lower band at 57.06. Price recently pushed toward the upper region before pulling back toward the midline. That pattern is typical of a strong trend digesting recent gains rather than reversing outright. Daily ATR14 stands at 1.38, indicating moderate but not extreme volatility for now.
PayPal Stock Intraday Signals Turn Cautious
PayPal stock’s intraday picture is more cautious than the daily trend. The H1 regime reads neutral, with RSI14 at 41.72 and a MACD histogram of -0.07, both leaning toward the softer side.
Price at 61.45 is trading below the H1 EMA20 at 61.72 and the EMA50 at 61.52. However, it remains well above the EMA200 at 58.37. That mismatch between short-term weakness and long-term strength is the core tension in this setup.
At the same time, the 15-minute chart mirrors the same short-term hesitation. RSI14 sits at 40.51 and MACD is essentially flat at -0.10. Price at 61.45 trades below its EMA20 at 61.57 and EMA50 at 61.71, though below the EMA200 at 61.48.
Therefore, both intraday timeframes point toward consolidation rather than continuation, at least for now. The 15m pivot structure places price between support at 61.37 and the pivot point at 61.52. That tight range reflects indecision heading into the next session.
Bullish Scenario for PayPal Stock
The bullish scenario for PayPal stock rests on the daily trend holding firm. If price defends the EMA20 near 59.85 and reclaims the daily pivot at 61.72, a push toward resistance at 62.06 (R1) becomes plausible. A further move toward the upper Bollinger Band at 63.25 would follow.
Meanwhile, a recovery in the H1 MACD back above zero would also help. RSI stabilizing above 50 on both intraday timeframes would confirm that the pullback was a pause within a larger bullish structure. It would suggest the move is not the start of a deeper correction.
Bearish Risks for PayPal Stock
The bearish scenario for PayPal stock centers on a break below the daily EMA20 and the S1 support at 61.12. Should that level fail, the daily MACD histogram’s negative reading could deepen.
In that scenario, price could test the Bollinger mid-band at 60.16, and potentially extend toward the EMA50 at 55.46. The collapse of the Advent-Stripe buyout talks adds an extra layer of headline risk. It removes a catalyst that had been lifting shares independent of underlying fundamentals.
In contrast to the calm daily trend, this news-driven uncertainty could accelerate any short-term slide if intraday weakness persists.
Volatility, Positioning, and the Path Ahead for PayPal Stock
PayPal stock remains structurally bullish on the daily chart, but the hourly and 15-minute pictures show clear signs of short-term fatigue. This is a case of conflicting signals across timeframes rather than a unified breakdown.
Notably, the loss of takeover speculation combined with broader macro uncertainty around the Fed’s Jackson Hole commentary adds a layer of volatility. Traders should not ignore that risk. With daily ATR at 1.38 and intraday ranges compressing, the next few sessions should clarify the picture. The market will show whether this is a healthy pause within an uptrend or the early signs of a more meaningful pullback.
Overall, positioning around key levels like the daily pivot at 61.72 and support at 61.12 will likely determine which scenario plays out first.
FAQ
Is PayPal stock still in an uptrend?
Yes. On the daily chart, PYPL trades above the EMA20 at 59.85, the EMA50 at 55.46, and the EMA200 at 53.58, which confirms a durable bullish regime.
What support levels should traders watch on PYPL?
Key support sits at S1 at 61.12, followed by the daily EMA20 near 59.85 and the Bollinger mid-band at 60.16. A deeper pullback could extend toward the EMA50 at 55.46.
What resistance levels matter for PayPal stock?
The daily pivot at 61.72 is the first hurdle. Above that, resistance appears at R1 at 62.06 and the upper Bollinger Band at 63.25.
Why is short-term momentum cooling?
The daily MACD histogram is negative at -0.29, while H1 and 15-minute RSI readings sit below 50. The abandoned Advent-Stripe $50 billion buyout pursuit also removed a speculative catalyst.
Disclaimer: This article is for informational purposes only and does not constitute financial advice, an investment recommendation, or a solicitation to buy or sell any financial instrument or cryptocurrency. The analysis provided is not indicative of future results. Investing in crypto assets and financial markets carries a high risk of capital loss. Always do your own research (DYOR) and consult a qualified financial advisor before making any decision.
Article produced with the assistance of artificial intelligence and reviewed by the editorial team.
PayPal Stock Stays Bullish After $50 Billion Stripe Buyout Falls Apart
PayPal stock enters the new session at a technical crossroads. The daily chart still shows a well-established uptrend, but the last 24 hours have introduced fresh headline risk after Advent and Stripe abandoned their $50 billion pursuit of PayPal.
PYPL — daily chart with candlesticks, EMA20/EMA50 and volume.
Key takeaways
PYPL closed at 61.47 on the daily chart, below the session pivot of 61.72.
The daily trend remains bullish, with price above the EMA20 at 59.85, the EMA50 at 55.46, and the EMA200 at 53.58.
Daily RSI14 at 65.54 and a negative MACD histogram of -0.29 suggest momentum is cooling.
Intraday H1 and 15-minute signals lean neutral-to-soft, with price below their short-term EMAs.
Advent and Stripe have reportedly abandoned their $50 billion pursuit of PayPal, removing a takeover catalyst.
PayPal Stock Price Action and Trend Structure
PayPal stock remains in a durable bullish uptrend on the daily chart, even after settling below the session’s pivot point. On the daily timeframe, PYPL closed at 61.47 after trading between 61.37 and 62.31, below the pivot of 61.72.
Meanwhile, the broader trend is constructive. Price sits above the EMA20 at 59.85, the EMA50 at 55.46, and the EMA200 at 53.58. This stacked structure confirms a bullish regime that has been building over recent months.
The daily RSI14 reads 65.54, firm but not yet stretched into extreme overbought territory. However, the MACD tells a slightly different story. Its line sits at 2.17 against a signal line of 2.46, producing a negative histogram of -0.29. That divergence suggests momentum is decelerating even as the trend remains intact. In other words, the rally is not broken, but it is catching its breath.
Bollinger Bands show the mid-band at 60.16, with the upper band at 63.25 and the lower band at 57.06. Price recently pushed toward the upper region before pulling back toward the midline. That pattern is typical of a strong trend digesting recent gains rather than reversing outright. Daily ATR14 stands at 1.38, indicating moderate but not extreme volatility for now.
PayPal Stock Intraday Signals Turn Cautious
PayPal stock’s intraday picture is more cautious than the daily trend. The H1 regime reads neutral, with RSI14 at 41.72 and a MACD histogram of -0.07, both leaning toward the softer side.
Price at 61.45 is trading below the H1 EMA20 at 61.72 and the EMA50 at 61.52. However, it remains well above the EMA200 at 58.37. That mismatch between short-term weakness and long-term strength is the core tension in this setup.
At the same time, the 15-minute chart mirrors the same short-term hesitation. RSI14 sits at 40.51 and MACD is essentially flat at -0.10. Price at 61.45 trades below its EMA20 at 61.57 and EMA50 at 61.71, though below the EMA200 at 61.48.
Therefore, both intraday timeframes point toward consolidation rather than continuation, at least for now. The 15m pivot structure places price between support at 61.37 and the pivot point at 61.52. That tight range reflects indecision heading into the next session.
Bullish Scenario for PayPal Stock
The bullish scenario for PayPal stock rests on the daily trend holding firm. If price defends the EMA20 near 59.85 and reclaims the daily pivot at 61.72, a push toward resistance at 62.06 (R1) becomes plausible. A further move toward the upper Bollinger Band at 63.25 would follow.
Meanwhile, a recovery in the H1 MACD back above zero would also help. RSI stabilizing above 50 on both intraday timeframes would confirm that the pullback was a pause within a larger bullish structure. It would suggest the move is not the start of a deeper correction.
Bearish Risks for PayPal Stock
The bearish scenario for PayPal stock centers on a break below the daily EMA20 and the S1 support at 61.12. Should that level fail, the daily MACD histogram’s negative reading could deepen.
In that scenario, price could test the Bollinger mid-band at 60.16, and potentially extend toward the EMA50 at 55.46. The collapse of the Advent-Stripe buyout talks adds an extra layer of headline risk. It removes a catalyst that had been lifting shares independent of underlying fundamentals.
In contrast to the calm daily trend, this news-driven uncertainty could accelerate any short-term slide if intraday weakness persists.
Volatility, Positioning, and the Path Ahead for PayPal Stock
PayPal stock remains structurally bullish on the daily chart, but the hourly and 15-minute pictures show clear signs of short-term fatigue. This is a case of conflicting signals across timeframes rather than a unified breakdown.
Notably, the loss of takeover speculation combined with broader macro uncertainty around the Fed’s Jackson Hole commentary adds a layer of volatility. Traders should not ignore that risk. With daily ATR at 1.38 and intraday ranges compressing, the next few sessions should clarify the picture. The market will show whether this is a healthy pause within an uptrend or the early signs of a more meaningful pullback.
Overall, positioning around key levels like the daily pivot at 61.72 and support at 61.12 will likely determine which scenario plays out first.
FAQ
Is PayPal stock still in an uptrend?
Yes. On the daily chart, PYPL trades above the EMA20 at 59.85, the EMA50 at 55.46, and the EMA200 at 53.58, which confirms a durable bullish regime.
What support levels should traders watch on PYPL?
Key support sits at S1 at 61.12, followed by the daily EMA20 near 59.85 and the Bollinger mid-band at 60.16. A deeper pullback could extend toward the EMA50 at 55.46.
What resistance levels matter for PayPal stock?
The daily pivot at 61.72 is the first hurdle. Above that, resistance appears at R1 at 62.06 and the upper Bollinger Band at 63.25.
Why is short-term momentum cooling?
The daily MACD histogram is negative at -0.29, while H1 and 15-minute RSI readings sit below 50. The abandoned Advent-Stripe $50 billion buyout pursuit also removed a speculative catalyst.
Disclaimer: This article is for informational purposes only and does not constitute financial advice, an investment recommendation, or a solicitation to buy or sell any financial instrument or cryptocurrency. The analysis provided is not indicative of future results. Investing in crypto assets and financial markets carries a high risk of capital loss. Always do your own research (DYOR) and consult a qualified financial advisor before making any decision.
Article produced with the assistance of artificial intelligence and reviewed by the editorial team.
PYPL — daily chart with candlesticks, EMA20/EMA50 and volume.
Key takeaways
PYPL closed at 61.47 on the daily chart, below the session pivot of 61.72.
The daily trend remains bullish, with price above the EMA20 at 59.85, the EMA50 at 55.46, and the EMA200 at 53.58.
Daily RSI14 at 65.54 and a negative MACD histogram of -0.29 suggest momentum is cooling.
Intraday H1 and 15-minute signals lean neutral-to-soft, with price below their short-term EMAs.
Advent and Stripe have reportedly abandoned their $50 billion pursuit of PayPal, removing a takeover catalyst.
PayPal Stock Price Action and Trend Structure
PayPal stock remains in a durable bullish uptrend on the daily chart, even after settling below the session’s pivot point. On the daily timeframe, PYPL closed at 61.47 after trading between 61.37 and 62.31, below the pivot of 61.72.
Meanwhile, the broader trend is constructive. Price sits above the EMA20 at 59.85, the EMA50 at 55.46, and the EMA200 at 53.58. This stacked structure confirms a bullish regime that has been building over recent months.
The daily RSI14 reads 65.54, firm but not yet stretched into extreme overbought territory. However, the MACD tells a slightly different story. Its line sits at 2.17 against a signal line of 2.46, producing a negative histogram of -0.29. That divergence suggests momentum is decelerating even as the trend remains intact. In other words, the rally is not broken, but it is catching its breath.
Bollinger Bands show the mid-band at 60.16, with the upper band at 63.25 and the lower band at 57.06. Price recently pushed toward the upper region before pulling back toward the midline. That pattern is typical of a strong trend digesting recent gains rather than reversing outright. Daily ATR14 stands at 1.38, indicating moderate but not extreme volatility for now.
PayPal Stock Intraday Signals Turn Cautious
PayPal stock’s intraday picture is more cautious than the daily trend. The H1 regime reads neutral, with RSI14 at 41.72 and a MACD histogram of -0.07, both leaning toward the softer side.
Price at 61.45 is trading below the H1 EMA20 at 61.72 and the EMA50 at 61.52. However, it remains well above the EMA200 at 58.37. That mismatch between short-term weakness and long-term strength is the core tension in this setup.
At the same time, the 15-minute chart mirrors the same short-term hesitation. RSI14 sits at 40.51 and MACD is essentially flat at -0.10. Price at 61.45 trades below its EMA20 at 61.57 and EMA50 at 61.71, though below the EMA200 at 61.48.
Therefore, both intraday timeframes point toward consolidation rather than continuation, at least for now. The 15m pivot structure places price between support at 61.37 and the pivot point at 61.52. That tight range reflects indecision heading into the next session.
Bullish Scenario for PayPal Stock
The bullish scenario for PayPal stock rests on the daily trend holding firm. If price defends the EMA20 near 59.85 and reclaims the daily pivot at 61.72, a push toward resistance at 62.06 (R1) becomes plausible. A further move toward the upper Bollinger Band at 63.25 would follow.
Meanwhile, a recovery in the H1 MACD back above zero would also help. RSI stabilizing above 50 on both intraday timeframes would confirm that the pullback was a pause within a larger bullish structure. It would suggest the move is not the start of a deeper correction.
Bearish Risks for PayPal Stock
The bearish scenario for PayPal stock centers on a break below the daily EMA20 and the S1 support at 61.12. Should that level fail, the daily MACD histogram’s negative reading could deepen.
In that scenario, price could test the Bollinger mid-band at 60.16, and potentially extend toward the EMA50 at 55.46. The collapse of the Advent-Stripe buyout talks adds an extra layer of headline risk. It removes a catalyst that had been lifting shares independent of underlying fundamentals.
In contrast to the calm daily trend, this news-driven uncertainty could accelerate any short-term slide if intraday weakness persists.
Volatility, Positioning, and the Path Ahead for PayPal Stock
PayPal stock remains structurally bullish on the daily chart, but the hourly and 15-minute pictures show clear signs of short-term fatigue. This is a case of conflicting signals across timeframes rather than a unified breakdown.
Notably, the loss of takeover speculation combined with broader macro uncertainty around the Fed’s Jackson Hole commentary adds a layer of volatility. Traders should not ignore that risk. With daily ATR at 1.38 and intraday ranges compressing, the next few sessions should clarify the picture. The market will show whether this is a healthy pause within an uptrend or the early signs of a more meaningful pullback.
Overall, positioning around key levels like the daily pivot at 61.72 and support at 61.12 will likely determine which scenario plays out first.
FAQ
Is PayPal stock still in an uptrend?
Yes. On the daily chart, PYPL trades above the EMA20 at 59.85, the EMA50 at 55.46, and the EMA200 at 53.58, which confirms a durable bullish regime.
What support levels should traders watch on PYPL?
Key support sits at S1 at 61.12, followed by the daily EMA20 near 59.85 and the Bollinger mid-band at 60.16. A deeper pullback could extend toward the EMA50 at 55.46.
What resistance levels matter for PayPal stock?
The daily pivot at 61.72 is the first hurdle. Above that, resistance appears at R1 at 62.06 and the upper Bollinger Band at 63.25.
Why is short-term momentum cooling?
The daily MACD histogram is negative at -0.29, while H1 and 15-minute RSI readings sit below 50. The abandoned Advent-Stripe $50 billion buyout pursuit also removed a speculative catalyst.
Disclaimer: This article is for informational purposes only and does not constitute financial advice, an investment recommendation, or a solicitation to buy or sell any financial instrument or cryptocurrency. The analysis provided is not indicative of future results. Investing in crypto assets and financial markets carries a high risk of capital loss. Always do your own research (DYOR) and consult a qualified financial advisor before making any decision.
Article produced with the assistance of artificial intelligence and reviewed by the editorial team.
48
Article
Lucid Stock Sinks to $5.09, Trading Far Below Its $9.43 Long-Term AverageLucid stock remains trapped in a structural downtrend. Shares closed at $5.09 on August 27, below every major moving average, confirming sellers still control the broader trend. The slide has coincided with skeptical headlines questioning whether Lucid can keep funding its turnaround while rivals scale production faster.
LCID — daily chart with candlesticks, EMA20/EMA50 and volume.
Key takeaways
Lucid stock closed at $5.09 on August 27, below its 20-day, 50-day, and 200-day EMAs.
The daily timeframe is bearish, with RSI at 36.65 and a widening negative MACD histogram at -0.18.
Hourly momentum is pausing near the 5.05–5.15 zone even though the broader trend remains tilted lower.
Key downside support sits at $4.77, while a bullish shift would require reclaiming the $5.18 daily pivot.
News flow is split between a potential Q4 Gravity GT-S catalyst and concerns over ongoing cash burn.
Daily Trend: Bearish Bias Dominates LCID Stock Price Action
The daily chart confirms a bearish regime for Lucid stock, with price below every major trend anchor.
Trend Anchors and Momentum
On the daily timeframe, LCID trades beneath its 20-day EMA at 5.95 and its 50-day EMA at 6.27. It also sits far below the 200-day EMA at 9.43. That last gap is significant. It shows the stock has lost nearly half its value relative to its longer-term trend anchor. It also reinforces the bearish reading attached to this timeframe.
The daily RSI sits at 36.65. That is weak territory, but not yet technically oversold. It leaves room for further downside before exhaustion signals typically appear. Meanwhile, the MACD line at -0.41 remains well below its signal line at -0.23, with a histogram of -0.18. The gap between the two lines is still widening. Momentum is negative, and sellers are gaining strength on the daily chart.
Volatility and Pivot Levels
Bollinger Bands add another layer. The mid-band sits at 6.28, the upper band at 7.96, and the lower band at 4.59. With price at 5.09, Lucid stock trades much closer to the lower band than to the mid-line. That is a classic signature of a market riding the lower channel in a persistent downtrend. Notably, daily ATR14 stands at 0.43, indicating volatility remains elevated relative to the current price level.
Pivot levels reinforce the pressure. The daily pivot point sits at 5.18, with resistance at 5.51 (R1) and support at 4.77 (S1). Price closing below the pivot at 5.09 confirms sellers dictated the session. The next real test lies at that 4.77 support band.
1H Timeframe: Momentum Pauses, But Trend Is Not Reversed
On the hourly chart, momentum is pausing, but the trend has not reversed.
The hourly chart tells a more nuanced story. Price at 5.09 is hugging its 20-period EMA of 5.13. The 50-hour EMA at 5.39 and the 200-hour EMA at 6.12 still sit meaningfully above current levels. In other words, the short-term average has caught up with price. The broader hourly structure remains tilted lower.
RSI on the 1H chart reads 44.08, noticeably higher than the daily reading and firmly neutral. At the same time, MACD shows the line at -0.08 against a signal of -0.11, producing a small positive histogram of 0.03. That is a subtle but real divergence from the daily picture. Intraday momentum is flattening out, even flickering slightly positive, while the bigger trend below it remains bearish.
However, this is where the conflict between timeframes becomes explicit. The daily chart says sellers are firmly in control. The hourly chart suggests the selling pressure has paused, at least temporarily. Price is consolidating right around its own pivot point of 5.12. Hourly resistance at 5.15 (R1) and support at 5.05 (S1) are both extremely tight to current price. That underscores how narrow this consolidation has become.
Bollinger Bands on the hourly chart show the mid-band at 5.10, the upper band at 5.39, and the lower band at 4.80. Price sits almost exactly at the mid-line. That is another sign of indecision rather than directional conviction. Still, the hourly regime is labeled bearish. The momentum readings are clearly softer than the daily ones. This complicates any assumption that the drop is accelerating right now.
15-Minute Chart: Execution Context Only
The 15-minute chart offers execution context rather than a directional edge, with price coiling in a neutral range.
Zooming into the 15-minute chart, the picture is one of pure indecision rather than a tradable signal on its own. Price at 5.09 sits below the 20-period EMA (5.14), the 50-period EMA (5.12), and the 200-period EMA (5.41). RSI at 45.95 is neutral. MACD is essentially flat, with the line at 0.02 versus a signal of 0.04 and a histogram of -0.02.
The 15m Bollinger Bands show the mid-band at 5.18, the upper band at 5.34, and the lower band at 5.03. Price is hugging the lower half of the range, consistent with short-term hesitation. The regime here reads “neutral,” which fits. This timeframe is not offering a directional edge. It only shows how tightly the stock is coiling near the 5.06–5.13 pivot zone before its next move.
The News Backdrop Adds Fundamental Weight to the Bearish Case
The news backdrop adds fundamental weight to the bearish technical case, even though the narrative is not uniformly negative.
Technical weakness on LCID stock is not happening in a vacuum. Recent headlines describe Lucid’s stock collapsing again after its new CEO unveiled a sweeping list of fixes, partnerships, and promises. Wall Street punished the shares regardless. Separately, coverage noted Lucid sinking 6% despite unveiling what the company calls America’s most powerful three-row crossover. Investors reportedly read the fine print very differently than management intended.
At the same time, not every voice is bearish. One Seeking Alpha piece frames Lucid as an EV turnaround play with significant upside. It points to Q4 Gravity GT-S deliveries as a potential catalyst, even while acknowledging weak margins persist. On the other hand, a Motley Fool piece bluntly questions whether there is still a bull case left. It notes Lucid keeps burning cash while rivals scale production. This split in narrative mirrors the technical divergence between the daily downtrend and the hourly pause.
Bullish Scenario: What Would Need to Change
A genuine bullish reversal would require reclaiming the 5.18 daily pivot and then the 20-day EMA near 5.95.
For that reversal in Lucid stock, price would first need to hold above the 5.18 daily pivot and the 20-day EMA near 5.95. Meanwhile, a daily close back above the 5.51 R1 level would meaningfully weaken the current bearish regime. RSI pushing back above 50 and the MACD histogram flipping positive would reinforce that shift. On the fundamental side, positive delivery updates tied to the Gravity GT-S in the fourth quarter could give the turnaround thesis more credibility. Evidence that cash burn is stabilizing would help as well.
Bearish Scenario: What Would Confirm Further Downside
Further downside would likely be confirmed by a break below the 4.77 daily support and a test of the 4.59 lower band.
Conversely, the bearish case strengthens if price breaks below the daily S1 support at 4.77 and tests the lower Bollinger Band at 4.59. A daily RSI reading that fails to recover above 40 would confirm sellers are reasserting control after the hourly pause. A further widening of the MACD histogram would reinforce that reading. Continued negative headlines around cash burn and skepticism toward management’s turnaround promises would likely reinforce that move. That is especially true given how far price already sits from the 200-day EMA at 9.43.
Closing Take
The dominant lens remains bearish, even though intraday stabilization has reduced immediate downside velocity.
Overall, the daily trend in Lucid stock remains clearly bearish, and that has to be the dominant lens through which traders view this setup. However, the hourly stabilization around the 5.05–5.15 zone suggests the drop has lost some immediate downside velocity. It has not reversed, though. The 15-minute chart offers no directional edge. It only confirms that price is coiling near short-term pivots.
ATR readings are elevated on both daily and hourly timeframes. Volatility is likely to remain a defining feature of LCID stock price action in the sessions ahead. Positioning around key levels like 4.77 support and 5.51 resistance will matter more than ever. The market is still digesting conflicting fundamental narratives.
FAQ
What is the current trend for Lucid stock?
The daily trend is clearly bearish. Lucid stock closed at $5.09 on August 27, below its 20-day EMA at 5.95, its 50-day EMA at 6.27, and its 200-day EMA at 9.43.
Where are the key support and resistance levels for LCID?
Key daily support sits at 4.77, with the lower Bollinger Band at 4.59. Key resistance sits at 5.51, while the daily pivot is at 5.18 and the 20-day EMA is near 5.95.
Is there any bullish signal in the technical picture?
The hourly chart shows a pause in selling pressure, with RSI at 44.08 and a small positive MACD histogram of 0.03. However, this stabilization has not reversed the broader bearish structure.
What fundamental factors are influencing Lucid stock?
News flow is split. Some coverage points to Q4 Gravity GT-S deliveries as a potential catalyst. Other coverage focuses on ongoing cash burn and skepticism toward the new CEO’s turnaround promises.
Disclaimer: This article is for informational purposes only and does not constitute financial advice, an investment recommendation, or a solicitation to buy or sell any financial instrument or cryptocurrency. The analysis provided is not indicative of future results. Investing in crypto assets and financial markets carries a high risk of capital loss. Always do your own research (DYOR) and consult a qualified financial advisor before making any decision.
Article produced with the assistance of artificial intelligence and reviewed by the editorial team.
Lucid Stock Sinks to $5.09, Trading Far Below Its $9.43 Long-Term Average
Lucid stock remains trapped in a structural downtrend. Shares closed at $5.09 on August 27, below every major moving average, confirming sellers still control the broader trend. The slide has coincided with skeptical headlines questioning whether Lucid can keep funding its turnaround while rivals scale production faster.
LCID — daily chart with candlesticks, EMA20/EMA50 and volume.
Key takeaways
Lucid stock closed at $5.09 on August 27, below its 20-day, 50-day, and 200-day EMAs.
The daily timeframe is bearish, with RSI at 36.65 and a widening negative MACD histogram at -0.18.
Hourly momentum is pausing near the 5.05–5.15 zone even though the broader trend remains tilted lower.
Key downside support sits at $4.77, while a bullish shift would require reclaiming the $5.18 daily pivot.
News flow is split between a potential Q4 Gravity GT-S catalyst and concerns over ongoing cash burn.
Daily Trend: Bearish Bias Dominates LCID Stock Price Action
The daily chart confirms a bearish regime for Lucid stock, with price below every major trend anchor.
Trend Anchors and Momentum
On the daily timeframe, LCID trades beneath its 20-day EMA at 5.95 and its 50-day EMA at 6.27. It also sits far below the 200-day EMA at 9.43. That last gap is significant. It shows the stock has lost nearly half its value relative to its longer-term trend anchor. It also reinforces the bearish reading attached to this timeframe.
The daily RSI sits at 36.65. That is weak territory, but not yet technically oversold. It leaves room for further downside before exhaustion signals typically appear. Meanwhile, the MACD line at -0.41 remains well below its signal line at -0.23, with a histogram of -0.18. The gap between the two lines is still widening. Momentum is negative, and sellers are gaining strength on the daily chart.
Volatility and Pivot Levels
Bollinger Bands add another layer. The mid-band sits at 6.28, the upper band at 7.96, and the lower band at 4.59. With price at 5.09, Lucid stock trades much closer to the lower band than to the mid-line. That is a classic signature of a market riding the lower channel in a persistent downtrend. Notably, daily ATR14 stands at 0.43, indicating volatility remains elevated relative to the current price level.
Pivot levels reinforce the pressure. The daily pivot point sits at 5.18, with resistance at 5.51 (R1) and support at 4.77 (S1). Price closing below the pivot at 5.09 confirms sellers dictated the session. The next real test lies at that 4.77 support band.
1H Timeframe: Momentum Pauses, But Trend Is Not Reversed
On the hourly chart, momentum is pausing, but the trend has not reversed.
The hourly chart tells a more nuanced story. Price at 5.09 is hugging its 20-period EMA of 5.13. The 50-hour EMA at 5.39 and the 200-hour EMA at 6.12 still sit meaningfully above current levels. In other words, the short-term average has caught up with price. The broader hourly structure remains tilted lower.
RSI on the 1H chart reads 44.08, noticeably higher than the daily reading and firmly neutral. At the same time, MACD shows the line at -0.08 against a signal of -0.11, producing a small positive histogram of 0.03. That is a subtle but real divergence from the daily picture. Intraday momentum is flattening out, even flickering slightly positive, while the bigger trend below it remains bearish.
However, this is where the conflict between timeframes becomes explicit. The daily chart says sellers are firmly in control. The hourly chart suggests the selling pressure has paused, at least temporarily. Price is consolidating right around its own pivot point of 5.12. Hourly resistance at 5.15 (R1) and support at 5.05 (S1) are both extremely tight to current price. That underscores how narrow this consolidation has become.
Bollinger Bands on the hourly chart show the mid-band at 5.10, the upper band at 5.39, and the lower band at 4.80. Price sits almost exactly at the mid-line. That is another sign of indecision rather than directional conviction. Still, the hourly regime is labeled bearish. The momentum readings are clearly softer than the daily ones. This complicates any assumption that the drop is accelerating right now.
15-Minute Chart: Execution Context Only
The 15-minute chart offers execution context rather than a directional edge, with price coiling in a neutral range.
Zooming into the 15-minute chart, the picture is one of pure indecision rather than a tradable signal on its own. Price at 5.09 sits below the 20-period EMA (5.14), the 50-period EMA (5.12), and the 200-period EMA (5.41). RSI at 45.95 is neutral. MACD is essentially flat, with the line at 0.02 versus a signal of 0.04 and a histogram of -0.02.
The 15m Bollinger Bands show the mid-band at 5.18, the upper band at 5.34, and the lower band at 5.03. Price is hugging the lower half of the range, consistent with short-term hesitation. The regime here reads “neutral,” which fits. This timeframe is not offering a directional edge. It only shows how tightly the stock is coiling near the 5.06–5.13 pivot zone before its next move.
The News Backdrop Adds Fundamental Weight to the Bearish Case
The news backdrop adds fundamental weight to the bearish technical case, even though the narrative is not uniformly negative.
Technical weakness on LCID stock is not happening in a vacuum. Recent headlines describe Lucid’s stock collapsing again after its new CEO unveiled a sweeping list of fixes, partnerships, and promises. Wall Street punished the shares regardless. Separately, coverage noted Lucid sinking 6% despite unveiling what the company calls America’s most powerful three-row crossover. Investors reportedly read the fine print very differently than management intended.
At the same time, not every voice is bearish. One Seeking Alpha piece frames Lucid as an EV turnaround play with significant upside. It points to Q4 Gravity GT-S deliveries as a potential catalyst, even while acknowledging weak margins persist. On the other hand, a Motley Fool piece bluntly questions whether there is still a bull case left. It notes Lucid keeps burning cash while rivals scale production. This split in narrative mirrors the technical divergence between the daily downtrend and the hourly pause.
Bullish Scenario: What Would Need to Change
A genuine bullish reversal would require reclaiming the 5.18 daily pivot and then the 20-day EMA near 5.95.
For that reversal in Lucid stock, price would first need to hold above the 5.18 daily pivot and the 20-day EMA near 5.95. Meanwhile, a daily close back above the 5.51 R1 level would meaningfully weaken the current bearish regime. RSI pushing back above 50 and the MACD histogram flipping positive would reinforce that shift. On the fundamental side, positive delivery updates tied to the Gravity GT-S in the fourth quarter could give the turnaround thesis more credibility. Evidence that cash burn is stabilizing would help as well.
Bearish Scenario: What Would Confirm Further Downside
Further downside would likely be confirmed by a break below the 4.77 daily support and a test of the 4.59 lower band.
Conversely, the bearish case strengthens if price breaks below the daily S1 support at 4.77 and tests the lower Bollinger Band at 4.59. A daily RSI reading that fails to recover above 40 would confirm sellers are reasserting control after the hourly pause. A further widening of the MACD histogram would reinforce that reading. Continued negative headlines around cash burn and skepticism toward management’s turnaround promises would likely reinforce that move. That is especially true given how far price already sits from the 200-day EMA at 9.43.
Closing Take
The dominant lens remains bearish, even though intraday stabilization has reduced immediate downside velocity.
Overall, the daily trend in Lucid stock remains clearly bearish, and that has to be the dominant lens through which traders view this setup. However, the hourly stabilization around the 5.05–5.15 zone suggests the drop has lost some immediate downside velocity. It has not reversed, though. The 15-minute chart offers no directional edge. It only confirms that price is coiling near short-term pivots.
ATR readings are elevated on both daily and hourly timeframes. Volatility is likely to remain a defining feature of LCID stock price action in the sessions ahead. Positioning around key levels like 4.77 support and 5.51 resistance will matter more than ever. The market is still digesting conflicting fundamental narratives.
FAQ
What is the current trend for Lucid stock?
The daily trend is clearly bearish. Lucid stock closed at $5.09 on August 27, below its 20-day EMA at 5.95, its 50-day EMA at 6.27, and its 200-day EMA at 9.43.
Where are the key support and resistance levels for LCID?
Key daily support sits at 4.77, with the lower Bollinger Band at 4.59. Key resistance sits at 5.51, while the daily pivot is at 5.18 and the 20-day EMA is near 5.95.
Is there any bullish signal in the technical picture?
The hourly chart shows a pause in selling pressure, with RSI at 44.08 and a small positive MACD histogram of 0.03. However, this stabilization has not reversed the broader bearish structure.
What fundamental factors are influencing Lucid stock?
News flow is split. Some coverage points to Q4 Gravity GT-S deliveries as a potential catalyst. Other coverage focuses on ongoing cash burn and skepticism toward the new CEO’s turnaround promises.
Disclaimer: This article is for informational purposes only and does not constitute financial advice, an investment recommendation, or a solicitation to buy or sell any financial instrument or cryptocurrency. The analysis provided is not indicative of future results. Investing in crypto assets and financial markets carries a high risk of capital loss. Always do your own research (DYOR) and consult a qualified financial advisor before making any decision.
Article produced with the assistance of artificial intelligence and reviewed by the editorial team.
LCID — daily chart with candlesticks, EMA20/EMA50 and volume.
Key takeaways
Lucid stock closed at $5.09 on August 27, below its 20-day, 50-day, and 200-day EMAs.
The daily timeframe is bearish, with RSI at 36.65 and a widening negative MACD histogram at -0.18.
Hourly momentum is pausing near the 5.05–5.15 zone even though the broader trend remains tilted lower.
Key downside support sits at $4.77, while a bullish shift would require reclaiming the $5.18 daily pivot.
News flow is split between a potential Q4 Gravity GT-S catalyst and concerns over ongoing cash burn.
Daily Trend: Bearish Bias Dominates LCID Stock Price Action
The daily chart confirms a bearish regime for Lucid stock, with price below every major trend anchor.
Trend Anchors and Momentum
On the daily timeframe, LCID trades beneath its 20-day EMA at 5.95 and its 50-day EMA at 6.27. It also sits far below the 200-day EMA at 9.43. That last gap is significant. It shows the stock has lost nearly half its value relative to its longer-term trend anchor. It also reinforces the bearish reading attached to this timeframe.
The daily RSI sits at 36.65. That is weak territory, but not yet technically oversold. It leaves room for further downside before exhaustion signals typically appear. Meanwhile, the MACD line at -0.41 remains well below its signal line at -0.23, with a histogram of -0.18. The gap between the two lines is still widening. Momentum is negative, and sellers are gaining strength on the daily chart.
Volatility and Pivot Levels
Bollinger Bands add another layer. The mid-band sits at 6.28, the upper band at 7.96, and the lower band at 4.59. With price at 5.09, Lucid stock trades much closer to the lower band than to the mid-line. That is a classic signature of a market riding the lower channel in a persistent downtrend. Notably, daily ATR14 stands at 0.43, indicating volatility remains elevated relative to the current price level.
Pivot levels reinforce the pressure. The daily pivot point sits at 5.18, with resistance at 5.51 (R1) and support at 4.77 (S1). Price closing below the pivot at 5.09 confirms sellers dictated the session. The next real test lies at that 4.77 support band.
1H Timeframe: Momentum Pauses, But Trend Is Not Reversed
On the hourly chart, momentum is pausing, but the trend has not reversed.
The hourly chart tells a more nuanced story. Price at 5.09 is hugging its 20-period EMA of 5.13. The 50-hour EMA at 5.39 and the 200-hour EMA at 6.12 still sit meaningfully above current levels. In other words, the short-term average has caught up with price. The broader hourly structure remains tilted lower.
RSI on the 1H chart reads 44.08, noticeably higher than the daily reading and firmly neutral. At the same time, MACD shows the line at -0.08 against a signal of -0.11, producing a small positive histogram of 0.03. That is a subtle but real divergence from the daily picture. Intraday momentum is flattening out, even flickering slightly positive, while the bigger trend below it remains bearish.
However, this is where the conflict between timeframes becomes explicit. The daily chart says sellers are firmly in control. The hourly chart suggests the selling pressure has paused, at least temporarily. Price is consolidating right around its own pivot point of 5.12. Hourly resistance at 5.15 (R1) and support at 5.05 (S1) are both extremely tight to current price. That underscores how narrow this consolidation has become.
Bollinger Bands on the hourly chart show the mid-band at 5.10, the upper band at 5.39, and the lower band at 4.80. Price sits almost exactly at the mid-line. That is another sign of indecision rather than directional conviction. Still, the hourly regime is labeled bearish. The momentum readings are clearly softer than the daily ones. This complicates any assumption that the drop is accelerating right now.
15-Minute Chart: Execution Context Only
The 15-minute chart offers execution context rather than a directional edge, with price coiling in a neutral range.
Zooming into the 15-minute chart, the picture is one of pure indecision rather than a tradable signal on its own. Price at 5.09 sits below the 20-period EMA (5.14), the 50-period EMA (5.12), and the 200-period EMA (5.41). RSI at 45.95 is neutral. MACD is essentially flat, with the line at 0.02 versus a signal of 0.04 and a histogram of -0.02.
The 15m Bollinger Bands show the mid-band at 5.18, the upper band at 5.34, and the lower band at 5.03. Price is hugging the lower half of the range, consistent with short-term hesitation. The regime here reads “neutral,” which fits. This timeframe is not offering a directional edge. It only shows how tightly the stock is coiling near the 5.06–5.13 pivot zone before its next move.
The News Backdrop Adds Fundamental Weight to the Bearish Case
The news backdrop adds fundamental weight to the bearish technical case, even though the narrative is not uniformly negative.
Technical weakness on LCID stock is not happening in a vacuum. Recent headlines describe Lucid’s stock collapsing again after its new CEO unveiled a sweeping list of fixes, partnerships, and promises. Wall Street punished the shares regardless. Separately, coverage noted Lucid sinking 6% despite unveiling what the company calls America’s most powerful three-row crossover. Investors reportedly read the fine print very differently than management intended.
At the same time, not every voice is bearish. One Seeking Alpha piece frames Lucid as an EV turnaround play with significant upside. It points to Q4 Gravity GT-S deliveries as a potential catalyst, even while acknowledging weak margins persist. On the other hand, a Motley Fool piece bluntly questions whether there is still a bull case left. It notes Lucid keeps burning cash while rivals scale production. This split in narrative mirrors the technical divergence between the daily downtrend and the hourly pause.
Bullish Scenario: What Would Need to Change
A genuine bullish reversal would require reclaiming the 5.18 daily pivot and then the 20-day EMA near 5.95.
For that reversal in Lucid stock, price would first need to hold above the 5.18 daily pivot and the 20-day EMA near 5.95. Meanwhile, a daily close back above the 5.51 R1 level would meaningfully weaken the current bearish regime. RSI pushing back above 50 and the MACD histogram flipping positive would reinforce that shift. On the fundamental side, positive delivery updates tied to the Gravity GT-S in the fourth quarter could give the turnaround thesis more credibility. Evidence that cash burn is stabilizing would help as well.
Bearish Scenario: What Would Confirm Further Downside
Further downside would likely be confirmed by a break below the 4.77 daily support and a test of the 4.59 lower band.
Conversely, the bearish case strengthens if price breaks below the daily S1 support at 4.77 and tests the lower Bollinger Band at 4.59. A daily RSI reading that fails to recover above 40 would confirm sellers are reasserting control after the hourly pause. A further widening of the MACD histogram would reinforce that reading. Continued negative headlines around cash burn and skepticism toward management’s turnaround promises would likely reinforce that move. That is especially true given how far price already sits from the 200-day EMA at 9.43.
Closing Take
The dominant lens remains bearish, even though intraday stabilization has reduced immediate downside velocity.
Overall, the daily trend in Lucid stock remains clearly bearish, and that has to be the dominant lens through which traders view this setup. However, the hourly stabilization around the 5.05–5.15 zone suggests the drop has lost some immediate downside velocity. It has not reversed, though. The 15-minute chart offers no directional edge. It only confirms that price is coiling near short-term pivots.
ATR readings are elevated on both daily and hourly timeframes. Volatility is likely to remain a defining feature of LCID stock price action in the sessions ahead. Positioning around key levels like 4.77 support and 5.51 resistance will matter more than ever. The market is still digesting conflicting fundamental narratives.
FAQ
What is the current trend for Lucid stock?
The daily trend is clearly bearish. Lucid stock closed at $5.09 on August 27, below its 20-day EMA at 5.95, its 50-day EMA at 6.27, and its 200-day EMA at 9.43.
Where are the key support and resistance levels for LCID?
Key daily support sits at 4.77, with the lower Bollinger Band at 4.59. Key resistance sits at 5.51, while the daily pivot is at 5.18 and the 20-day EMA is near 5.95.
Is there any bullish signal in the technical picture?
The hourly chart shows a pause in selling pressure, with RSI at 44.08 and a small positive MACD histogram of 0.03. However, this stabilization has not reversed the broader bearish structure.
What fundamental factors are influencing Lucid stock?
News flow is split. Some coverage points to Q4 Gravity GT-S deliveries as a potential catalyst. Other coverage focuses on ongoing cash burn and skepticism toward the new CEO’s turnaround promises.
Disclaimer: This article is for informational purposes only and does not constitute financial advice, an investment recommendation, or a solicitation to buy or sell any financial instrument or cryptocurrency. The analysis provided is not indicative of future results. Investing in crypto assets and financial markets carries a high risk of capital loss. Always do your own research (DYOR) and consult a qualified financial advisor before making any decision.
Article produced with the assistance of artificial intelligence and reviewed by the editorial team.
10
Article
BitGo NYDIG acquisition adds 250 clients as Bitcoin tops $80KBitGo has struck a deal to buy the institutional trading business of NYDIG, a move that pulls the Bitcoin-focused custody firm deeper into derivatives, financing and structured products just as crypto markets show signs of waking back up. The BitGo NYDIG acquisition brings roughly 30 employees and, according to a person familiar with the matter cited by CNBC, around 250 institutional client relationships into BitGo’s fold. Terms of the deal have not been disclosed.
Key takeaways
BitGo has acquired NYDIG’s institutional trading business, adding derivatives, structured products, financing and capital markets services.
The deal brings about 30 employees and an estimated 250 institutional client relationships to BitGo, according to a person close to the matter cited by CNBC.
NYDIG will redirect its resources toward power generation, Bitcoin mining and high-performance computing data centers.
NYDIG’s development pipeline exceeds 3 gigawatts, with more than 1 GW of capacity expected to come online in 2027 and 2028.
The move comes as Bitcoin has climbed more than 20% over the past week, briefly topping $80,000, according to CNBC.
BitGo Acquires NYDIG’s Institutional Trading Business
BitGo has completed a deal to absorb the institutional trading arm of NYDIG, one of the crypto industry’s longer-standing Bitcoin infrastructure companies. The transaction adds derivatives, structured products, financing and other capital markets services to a client base that includes asset managers, hedge funds and corporations.
Details of the Acquisition
NYDIG’s institutional trading unit had built its business around serving asset managers, hedge funds, corporations, family offices and other large investors, with particular strength in derivatives, financing and customized trading strategies, according to CNBC. That specialization is now folding into BitGo’s existing custody, settlement and wallet infrastructure operations, according to reporting from CNBC and The Block. No financial terms of the transaction have been made public, and Cointelegraph noted that BitGo had not responded to a request for additional details by publication time.
Employee and Client Transition
Roughly 30 employees are joining BitGo as part of the deal. A person close to the matter told CNBC that around 250 institutional client relationships are also expected to transfer over. That combination of headcount and existing client ties gives BitGo an instant foothold in a segment of institutional crypto trading it hadn’t previously built out on its own.
Expansion of BitGo’s Institutional Crypto Services
The BitGo NYDIG acquisition effectively hands the company a ready-made derivatives and financing desk rather than requiring it to build one from scratch. That matters because BitGo has long been known primarily for custody and wallet security, not for structured trading products — this deal changes that positioning almost overnight.
Enhanced Derivatives and Financing Capabilities
With the addition of NYDIG’s trading business, BitGo now offers a broader menu of capital markets services layered on top of its custody and settlement infrastructure. This kind of crypto derivatives expansion reflects a wider industry pattern: infrastructure providers are increasingly bundling trading, financing and custody together rather than offering them as separate products, making it easier for institutional clients to manage everything under one roof.
Statements from BitGo Leadership
BitGo CEO Mike Belshe said the acquisition will “meaningfully scale” the company’s trading and infrastructure capabilities, positioning it to serve a wider range of institutional clients. Pete Janney, BitGo’s head of financial infrastructure, framed the deal in terms of continuity for existing NYDIG clients, saying: “This transaction allows our team to continue delivering the same innovative solutions, execution quality, and dedication clients have come to expect, now backed by an even deeper set of resources.”
NYDIG’s Strategic Shift to Bitcoin Mining and Power Generation
Selling off its institutional trading business lets NYDIG concentrate on an entirely different corner of the Bitcoin economy: power generation, mining and high-performance computing. It’s a pivot that says as much about where NYDIG sees future growth as it does about BitGo’s ambitions in institutional crypto trading.
Post-Acquisition Business Focus
According to the joint announcement from both companies, the sale frees up NYDIG’s resources to concentrate on power generation, Bitcoin mining and high-performance computing data centers. That’s a notable departure from trading and financial services, and it places NYDIG squarely in the middle of a growing trend of Bitcoin-linked companies chasing energy infrastructure and compute demand rather than pure financial products.
Development Pipeline and Capacity Expectations
NYDIG says its development pipeline already exceeds 3 gigawatts of power generation capacity, with more than 1 GW expected to be delivered in 2027 and 2028 alone. That’s a substantial bet on Bitcoin mining development and data-center infrastructure at a moment when demand for compute power — both for mining and for AI-adjacent workloads — is climbing across the industry.
Why This Deal Matters for the Crypto Market
The timing here isn’t incidental. CNBC reported that Bitcoin has risen more than 20% over the past week, briefly topping $80,000, after months of thin trading volume and tepid investor interest. BitGo’s expansion into derivatives and financing looks like a bet that institutional appetite for crypto trading is returning after a prolonged slowdown — and that firms positioned with deeper infrastructure will capture a disproportionate share of that rebound.
There’s also a broader signal buried in this transaction: the crypto industry appears to be shifting away from treating digital assets purely as a speculative asset class and moving toward building out the infrastructure — custody, financing, derivatives, and now power and compute — that institutions actually need to participate at scale. BitGo, which went public earlier this year and is based in Sioux Falls, South Dakota, has built its reputation since its founding in 2013 on security and institutional trust rather than trading flash. Adding NYDIG’s trading desk fills a gap in that reputation rather than reinventing it.
FAQ
What did BitGo acquire from NYDIG?
BitGo acquired NYDIG’s institutional trading business, including derivatives, structured products, and financing capabilities.
How does the acquisition benefit BitGo’s services?
The acquisition expands BitGo’s trading and infrastructure capabilities, allowing it to serve a broader range of institutional clients.
What will NYDIG focus on after selling its trading business?
NYDIG will focus on power generation, Bitcoin mining, and high-performance computing data centers.
How many employees transferred to BitGo from NYDIG?
About 30 employees from NYDIG’s institutional trading business joined BitGo, along with an estimated 250 institutional client relationships, according to a person close to the matter cited by CNBC.
Article produced with the assistance of artificial intelligence and reviewed by the editorial team.
BitGo NYDIG acquisition adds 250 clients as Bitcoin tops $80K
BitGo has struck a deal to buy the institutional trading business of NYDIG, a move that pulls the Bitcoin-focused custody firm deeper into derivatives, financing and structured products just as crypto markets show signs of waking back up. The BitGo NYDIG acquisition brings roughly 30 employees and, according to a person familiar with the matter cited by CNBC, around 250 institutional client relationships into BitGo’s fold. Terms of the deal have not been disclosed.
Key takeaways
BitGo has acquired NYDIG’s institutional trading business, adding derivatives, structured products, financing and capital markets services.
The deal brings about 30 employees and an estimated 250 institutional client relationships to BitGo, according to a person close to the matter cited by CNBC.
NYDIG will redirect its resources toward power generation, Bitcoin mining and high-performance computing data centers.
NYDIG’s development pipeline exceeds 3 gigawatts, with more than 1 GW of capacity expected to come online in 2027 and 2028.
The move comes as Bitcoin has climbed more than 20% over the past week, briefly topping $80,000, according to CNBC.
BitGo Acquires NYDIG’s Institutional Trading Business
BitGo has completed a deal to absorb the institutional trading arm of NYDIG, one of the crypto industry’s longer-standing Bitcoin infrastructure companies. The transaction adds derivatives, structured products, financing and other capital markets services to a client base that includes asset managers, hedge funds and corporations.
Details of the Acquisition
NYDIG’s institutional trading unit had built its business around serving asset managers, hedge funds, corporations, family offices and other large investors, with particular strength in derivatives, financing and customized trading strategies, according to CNBC. That specialization is now folding into BitGo’s existing custody, settlement and wallet infrastructure operations, according to reporting from CNBC and The Block. No financial terms of the transaction have been made public, and Cointelegraph noted that BitGo had not responded to a request for additional details by publication time.
Employee and Client Transition
Roughly 30 employees are joining BitGo as part of the deal. A person close to the matter told CNBC that around 250 institutional client relationships are also expected to transfer over. That combination of headcount and existing client ties gives BitGo an instant foothold in a segment of institutional crypto trading it hadn’t previously built out on its own.
Expansion of BitGo’s Institutional Crypto Services
The BitGo NYDIG acquisition effectively hands the company a ready-made derivatives and financing desk rather than requiring it to build one from scratch. That matters because BitGo has long been known primarily for custody and wallet security, not for structured trading products — this deal changes that positioning almost overnight.
Enhanced Derivatives and Financing Capabilities
With the addition of NYDIG’s trading business, BitGo now offers a broader menu of capital markets services layered on top of its custody and settlement infrastructure. This kind of crypto derivatives expansion reflects a wider industry pattern: infrastructure providers are increasingly bundling trading, financing and custody together rather than offering them as separate products, making it easier for institutional clients to manage everything under one roof.
Statements from BitGo Leadership
BitGo CEO Mike Belshe said the acquisition will “meaningfully scale” the company’s trading and infrastructure capabilities, positioning it to serve a wider range of institutional clients. Pete Janney, BitGo’s head of financial infrastructure, framed the deal in terms of continuity for existing NYDIG clients, saying: “This transaction allows our team to continue delivering the same innovative solutions, execution quality, and dedication clients have come to expect, now backed by an even deeper set of resources.”
NYDIG’s Strategic Shift to Bitcoin Mining and Power Generation
Selling off its institutional trading business lets NYDIG concentrate on an entirely different corner of the Bitcoin economy: power generation, mining and high-performance computing. It’s a pivot that says as much about where NYDIG sees future growth as it does about BitGo’s ambitions in institutional crypto trading.
Post-Acquisition Business Focus
According to the joint announcement from both companies, the sale frees up NYDIG’s resources to concentrate on power generation, Bitcoin mining and high-performance computing data centers. That’s a notable departure from trading and financial services, and it places NYDIG squarely in the middle of a growing trend of Bitcoin-linked companies chasing energy infrastructure and compute demand rather than pure financial products.
Development Pipeline and Capacity Expectations
NYDIG says its development pipeline already exceeds 3 gigawatts of power generation capacity, with more than 1 GW expected to be delivered in 2027 and 2028 alone. That’s a substantial bet on Bitcoin mining development and data-center infrastructure at a moment when demand for compute power — both for mining and for AI-adjacent workloads — is climbing across the industry.
Why This Deal Matters for the Crypto Market
The timing here isn’t incidental. CNBC reported that Bitcoin has risen more than 20% over the past week, briefly topping $80,000, after months of thin trading volume and tepid investor interest. BitGo’s expansion into derivatives and financing looks like a bet that institutional appetite for crypto trading is returning after a prolonged slowdown — and that firms positioned with deeper infrastructure will capture a disproportionate share of that rebound.
There’s also a broader signal buried in this transaction: the crypto industry appears to be shifting away from treating digital assets purely as a speculative asset class and moving toward building out the infrastructure — custody, financing, derivatives, and now power and compute — that institutions actually need to participate at scale. BitGo, which went public earlier this year and is based in Sioux Falls, South Dakota, has built its reputation since its founding in 2013 on security and institutional trust rather than trading flash. Adding NYDIG’s trading desk fills a gap in that reputation rather than reinventing it.
FAQ
What did BitGo acquire from NYDIG?
BitGo acquired NYDIG’s institutional trading business, including derivatives, structured products, and financing capabilities.
How does the acquisition benefit BitGo’s services?
The acquisition expands BitGo’s trading and infrastructure capabilities, allowing it to serve a broader range of institutional clients.
What will NYDIG focus on after selling its trading business?
NYDIG will focus on power generation, Bitcoin mining, and high-performance computing data centers.
How many employees transferred to BitGo from NYDIG?
About 30 employees from NYDIG’s institutional trading business joined BitGo, along with an estimated 250 institutional client relationships, according to a person close to the matter cited by CNBC.
Article produced with the assistance of artificial intelligence and reviewed by the editorial team.
Key takeaways
BitGo has acquired NYDIG’s institutional trading business, adding derivatives, structured products, financing and capital markets services.
The deal brings about 30 employees and an estimated 250 institutional client relationships to BitGo, according to a person close to the matter cited by CNBC.
NYDIG will redirect its resources toward power generation, Bitcoin mining and high-performance computing data centers.
NYDIG’s development pipeline exceeds 3 gigawatts, with more than 1 GW of capacity expected to come online in 2027 and 2028.
The move comes as Bitcoin has climbed more than 20% over the past week, briefly topping $80,000, according to CNBC.
BitGo Acquires NYDIG’s Institutional Trading Business
BitGo has completed a deal to absorb the institutional trading arm of NYDIG, one of the crypto industry’s longer-standing Bitcoin infrastructure companies. The transaction adds derivatives, structured products, financing and other capital markets services to a client base that includes asset managers, hedge funds and corporations.
Details of the Acquisition
NYDIG’s institutional trading unit had built its business around serving asset managers, hedge funds, corporations, family offices and other large investors, with particular strength in derivatives, financing and customized trading strategies, according to CNBC. That specialization is now folding into BitGo’s existing custody, settlement and wallet infrastructure operations, according to reporting from CNBC and The Block. No financial terms of the transaction have been made public, and Cointelegraph noted that BitGo had not responded to a request for additional details by publication time.
Employee and Client Transition
Roughly 30 employees are joining BitGo as part of the deal. A person close to the matter told CNBC that around 250 institutional client relationships are also expected to transfer over. That combination of headcount and existing client ties gives BitGo an instant foothold in a segment of institutional crypto trading it hadn’t previously built out on its own.
Expansion of BitGo’s Institutional Crypto Services
The BitGo NYDIG acquisition effectively hands the company a ready-made derivatives and financing desk rather than requiring it to build one from scratch. That matters because BitGo has long been known primarily for custody and wallet security, not for structured trading products — this deal changes that positioning almost overnight.
Enhanced Derivatives and Financing Capabilities
With the addition of NYDIG’s trading business, BitGo now offers a broader menu of capital markets services layered on top of its custody and settlement infrastructure. This kind of crypto derivatives expansion reflects a wider industry pattern: infrastructure providers are increasingly bundling trading, financing and custody together rather than offering them as separate products, making it easier for institutional clients to manage everything under one roof.
Statements from BitGo Leadership
BitGo CEO Mike Belshe said the acquisition will “meaningfully scale” the company’s trading and infrastructure capabilities, positioning it to serve a wider range of institutional clients. Pete Janney, BitGo’s head of financial infrastructure, framed the deal in terms of continuity for existing NYDIG clients, saying: “This transaction allows our team to continue delivering the same innovative solutions, execution quality, and dedication clients have come to expect, now backed by an even deeper set of resources.”
NYDIG’s Strategic Shift to Bitcoin Mining and Power Generation
Selling off its institutional trading business lets NYDIG concentrate on an entirely different corner of the Bitcoin economy: power generation, mining and high-performance computing. It’s a pivot that says as much about where NYDIG sees future growth as it does about BitGo’s ambitions in institutional crypto trading.
Post-Acquisition Business Focus
According to the joint announcement from both companies, the sale frees up NYDIG’s resources to concentrate on power generation, Bitcoin mining and high-performance computing data centers. That’s a notable departure from trading and financial services, and it places NYDIG squarely in the middle of a growing trend of Bitcoin-linked companies chasing energy infrastructure and compute demand rather than pure financial products.
Development Pipeline and Capacity Expectations
NYDIG says its development pipeline already exceeds 3 gigawatts of power generation capacity, with more than 1 GW expected to be delivered in 2027 and 2028 alone. That’s a substantial bet on Bitcoin mining development and data-center infrastructure at a moment when demand for compute power — both for mining and for AI-adjacent workloads — is climbing across the industry.
Why This Deal Matters for the Crypto Market
The timing here isn’t incidental. CNBC reported that Bitcoin has risen more than 20% over the past week, briefly topping $80,000, after months of thin trading volume and tepid investor interest. BitGo’s expansion into derivatives and financing looks like a bet that institutional appetite for crypto trading is returning after a prolonged slowdown — and that firms positioned with deeper infrastructure will capture a disproportionate share of that rebound.
There’s also a broader signal buried in this transaction: the crypto industry appears to be shifting away from treating digital assets purely as a speculative asset class and moving toward building out the infrastructure — custody, financing, derivatives, and now power and compute — that institutions actually need to participate at scale. BitGo, which went public earlier this year and is based in Sioux Falls, South Dakota, has built its reputation since its founding in 2013 on security and institutional trust rather than trading flash. Adding NYDIG’s trading desk fills a gap in that reputation rather than reinventing it.
FAQ
What did BitGo acquire from NYDIG?
BitGo acquired NYDIG’s institutional trading business, including derivatives, structured products, and financing capabilities.
How does the acquisition benefit BitGo’s services?
The acquisition expands BitGo’s trading and infrastructure capabilities, allowing it to serve a broader range of institutional clients.
What will NYDIG focus on after selling its trading business?
NYDIG will focus on power generation, Bitcoin mining, and high-performance computing data centers.
How many employees transferred to BitGo from NYDIG?
About 30 employees from NYDIG’s institutional trading business joined BitGo, along with an estimated 250 institutional client relationships, according to a person close to the matter cited by CNBC.
Article produced with the assistance of artificial intelligence and reviewed by the editorial team.
7
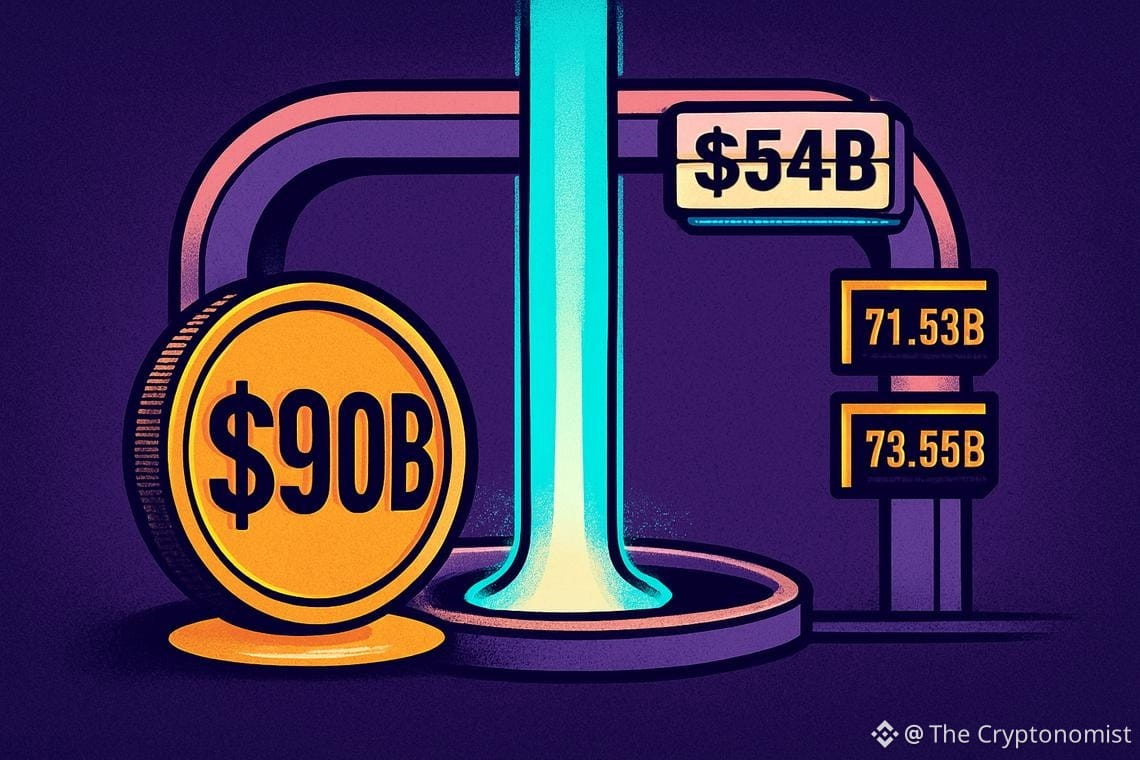
Article
Circle USDC Valuation Growth Hits $90B as Bernstein Sees 59% UpsideCircle’s valuation has more than doubled in a short stretch, and the numbers behind that jump are hard to ignore. According to a tweet from crypto analytics firm CryptoQuant, USDC‘s market capitalization climbed from $71.53 billion to $73.55 billion, while Circle’s own valuation surged from $54 billion to $90 billion. That kind of parallel movement is exactly what’s fueling talk of sustained Circle USDC valuation growth across trading desks and crypto forums this week.
Key takeaways
Circle’s valuation rose from $54 billion to $90 billion as USDC’s market cap grew from $71.53 billion to $73.55 billion, per CryptoQuant.
USDC remains a US dollar-pegged stablecoin widely used for crypto trading and liquidity, with Circle managing the peg and its link to traditional finance.
Trading activity for USDC has picked up, though overall volume is still described as thin.
Circle’s Valuation Surge Linked to USDC Growth
Circle’s valuation jump appears directly tied to how fast USDC is expanding, not an isolated market quirk. The stablecoin issuer’s valuation climbing from $54 billion to $90 billion lines up closely with the timeframe in which USDC’s market cap grew by roughly $2 billion, based on the CryptoQuant figures. That kind of parallel timing rarely happens by accident in crypto markets.
Correlation Between Valuation and Stablecoin Expansion
The relationship between the two numbers points to a broader pattern: investors appear to be pricing Circle’s worth largely around how much USDC it can keep in circulation. When the stablecoin’s supply grows, Circle’s revenue potential from reserves and transaction flow grows with it, and that seems to be showing up in how the market values the company. It’s worth noting the correlation is observational rather than a confirmed cause-and-effect relationship, but the timing overlap is notable enough that market watchers have taken notice.
USDC’s Growing Role in Crypto Trading and Liquidity
USDC functions as one of the most widely used dollar-pegged assets in crypto, and that utility is central to why its growth matters beyond just a headline number. It’s used across trading pairs, decentralized finance protocols, and as a liquidity bridge between fiat and digital assets, which means expanding supply tends to ripple across multiple corners of the market at once.
Circle’s Role in Maintaining the Peg
Circle, as the issuer, is the entity responsible for keeping USDC anchored to the US dollar and connected to traditional finance rails. That responsibility is part of why the company’s valuation tends to move alongside the stablecoin’s footprint — the bigger USDC gets, the more central Circle becomes to the plumbing that keeps crypto trading and settlement running smoothly.
Trading Volume Tells a More Cautious Story
Not everything about USDC’s current trajectory is unambiguously bullish. Trading activity for the stablecoin has picked up, but overall volume remains thin compared to what would typically accompany a valuation swing of this size. That gap between rising valuation and modest volume suggests the market’s enthusiasm is running slightly ahead of actual trading demand, at least for now. It’s a detail worth watching, because thin volume can limit how far a positive trend actually reaches before it needs fresh confirmation from real trading flow.
Market Sentiment and Potential Outlook
Put together, the CryptoQuant data paint a picture of a market that’s increasingly confident in USDC’s expanding footprint and, by extension, in Circle’s business model. That confidence is showing up in Circle’s valuation and in growing usage across decentralized finance, tokenized markets, and agent-driven payments. If USDC’s supply keeps climbing and trading volume eventually catches up to the current valuation trend, further price appreciation for Circle could follow.
Still, that upside isn’t guaranteed. Broader crypto market conditions can shift quickly, and a sudden change in sentiment across major cryptocurrencies could just as easily interrupt USDC’s current momentum. For now, traders and analysts alike appear to be watching the same signal: whether stablecoin growth keeps translating into real valuation gains, or whether the current enthusiasm cools once trading volume is forced to catch up with the headlines.
FAQ
What caused Circle’s valuation to rise recently?
Circle’s valuation rose alongside the growth of USDC’s market capitalization, reflecting increased market confidence in USDC’s expansion, according to CryptoQuant data shared on X.
How is USDC used in the cryptocurrency market?
USDC is a US dollar-pegged stablecoin widely used in crypto trading and liquidity, serving as a key asset for trading and maintaining stable value across decentralized finance and other crypto markets.
Does increased trading activity for USDC mean a large market impact currently?
Although USDC’s trading activity has increased, the overall trading volume remains low, which may limit its immediate market impact even as its valuation and supply climb.
Are there risks associated with the current optimism around Circle and USDC?
Yes, potential risks exist if overall cryptocurrency market conditions shift suddenly, which could affect the positive trends currently supporting Circle’s valuation and USDC’s expansion.
Article produced with the assistance of artificial intelligence and reviewed by the editorial team.
Circle USDC Valuation Growth Hits $90B as Bernstein Sees 59% Upside
Circle’s valuation has more than doubled in a short stretch, and the numbers behind that jump are hard to ignore. According to a tweet from crypto analytics firm CryptoQuant, USDC‘s market capitalization climbed from $71.53 billion to $73.55 billion, while Circle’s own valuation surged from $54 billion to $90 billion. That kind of parallel movement is exactly what’s fueling talk of sustained Circle USDC valuation growth across trading desks and crypto forums this week.
Key takeaways
Circle’s valuation rose from $54 billion to $90 billion as USDC’s market cap grew from $71.53 billion to $73.55 billion, per CryptoQuant.
USDC remains a US dollar-pegged stablecoin widely used for crypto trading and liquidity, with Circle managing the peg and its link to traditional finance.
Trading activity for USDC has picked up, though overall volume is still described as thin.
Circle’s Valuation Surge Linked to USDC Growth
Circle’s valuation jump appears directly tied to how fast USDC is expanding, not an isolated market quirk. The stablecoin issuer’s valuation climbing from $54 billion to $90 billion lines up closely with the timeframe in which USDC’s market cap grew by roughly $2 billion, based on the CryptoQuant figures. That kind of parallel timing rarely happens by accident in crypto markets.
Correlation Between Valuation and Stablecoin Expansion
The relationship between the two numbers points to a broader pattern: investors appear to be pricing Circle’s worth largely around how much USDC it can keep in circulation. When the stablecoin’s supply grows, Circle’s revenue potential from reserves and transaction flow grows with it, and that seems to be showing up in how the market values the company. It’s worth noting the correlation is observational rather than a confirmed cause-and-effect relationship, but the timing overlap is notable enough that market watchers have taken notice.
USDC’s Growing Role in Crypto Trading and Liquidity
USDC functions as one of the most widely used dollar-pegged assets in crypto, and that utility is central to why its growth matters beyond just a headline number. It’s used across trading pairs, decentralized finance protocols, and as a liquidity bridge between fiat and digital assets, which means expanding supply tends to ripple across multiple corners of the market at once.
Circle’s Role in Maintaining the Peg
Circle, as the issuer, is the entity responsible for keeping USDC anchored to the US dollar and connected to traditional finance rails. That responsibility is part of why the company’s valuation tends to move alongside the stablecoin’s footprint — the bigger USDC gets, the more central Circle becomes to the plumbing that keeps crypto trading and settlement running smoothly.
Trading Volume Tells a More Cautious Story
Not everything about USDC’s current trajectory is unambiguously bullish. Trading activity for the stablecoin has picked up, but overall volume remains thin compared to what would typically accompany a valuation swing of this size. That gap between rising valuation and modest volume suggests the market’s enthusiasm is running slightly ahead of actual trading demand, at least for now. It’s a detail worth watching, because thin volume can limit how far a positive trend actually reaches before it needs fresh confirmation from real trading flow.
Market Sentiment and Potential Outlook
Put together, the CryptoQuant data paint a picture of a market that’s increasingly confident in USDC’s expanding footprint and, by extension, in Circle’s business model. That confidence is showing up in Circle’s valuation and in growing usage across decentralized finance, tokenized markets, and agent-driven payments. If USDC’s supply keeps climbing and trading volume eventually catches up to the current valuation trend, further price appreciation for Circle could follow.
Still, that upside isn’t guaranteed. Broader crypto market conditions can shift quickly, and a sudden change in sentiment across major cryptocurrencies could just as easily interrupt USDC’s current momentum. For now, traders and analysts alike appear to be watching the same signal: whether stablecoin growth keeps translating into real valuation gains, or whether the current enthusiasm cools once trading volume is forced to catch up with the headlines.
FAQ
What caused Circle’s valuation to rise recently?
Circle’s valuation rose alongside the growth of USDC’s market capitalization, reflecting increased market confidence in USDC’s expansion, according to CryptoQuant data shared on X.
How is USDC used in the cryptocurrency market?
USDC is a US dollar-pegged stablecoin widely used in crypto trading and liquidity, serving as a key asset for trading and maintaining stable value across decentralized finance and other crypto markets.
Does increased trading activity for USDC mean a large market impact currently?
Although USDC’s trading activity has increased, the overall trading volume remains low, which may limit its immediate market impact even as its valuation and supply climb.
Are there risks associated with the current optimism around Circle and USDC?
Yes, potential risks exist if overall cryptocurrency market conditions shift suddenly, which could affect the positive trends currently supporting Circle’s valuation and USDC’s expansion.
Article produced with the assistance of artificial intelligence and reviewed by the editorial team.
Key takeaways
Circle’s valuation rose from $54 billion to $90 billion as USDC’s market cap grew from $71.53 billion to $73.55 billion, per CryptoQuant.
USDC remains a US dollar-pegged stablecoin widely used for crypto trading and liquidity, with Circle managing the peg and its link to traditional finance.
Trading activity for USDC has picked up, though overall volume is still described as thin.
Circle’s Valuation Surge Linked to USDC Growth
Circle’s valuation jump appears directly tied to how fast USDC is expanding, not an isolated market quirk. The stablecoin issuer’s valuation climbing from $54 billion to $90 billion lines up closely with the timeframe in which USDC’s market cap grew by roughly $2 billion, based on the CryptoQuant figures. That kind of parallel timing rarely happens by accident in crypto markets.
Correlation Between Valuation and Stablecoin Expansion
The relationship between the two numbers points to a broader pattern: investors appear to be pricing Circle’s worth largely around how much USDC it can keep in circulation. When the stablecoin’s supply grows, Circle’s revenue potential from reserves and transaction flow grows with it, and that seems to be showing up in how the market values the company. It’s worth noting the correlation is observational rather than a confirmed cause-and-effect relationship, but the timing overlap is notable enough that market watchers have taken notice.
USDC’s Growing Role in Crypto Trading and Liquidity
USDC functions as one of the most widely used dollar-pegged assets in crypto, and that utility is central to why its growth matters beyond just a headline number. It’s used across trading pairs, decentralized finance protocols, and as a liquidity bridge between fiat and digital assets, which means expanding supply tends to ripple across multiple corners of the market at once.
Circle’s Role in Maintaining the Peg
Circle, as the issuer, is the entity responsible for keeping USDC anchored to the US dollar and connected to traditional finance rails. That responsibility is part of why the company’s valuation tends to move alongside the stablecoin’s footprint — the bigger USDC gets, the more central Circle becomes to the plumbing that keeps crypto trading and settlement running smoothly.
Trading Volume Tells a More Cautious Story
Not everything about USDC’s current trajectory is unambiguously bullish. Trading activity for the stablecoin has picked up, but overall volume remains thin compared to what would typically accompany a valuation swing of this size. That gap between rising valuation and modest volume suggests the market’s enthusiasm is running slightly ahead of actual trading demand, at least for now. It’s a detail worth watching, because thin volume can limit how far a positive trend actually reaches before it needs fresh confirmation from real trading flow.
Market Sentiment and Potential Outlook
Put together, the CryptoQuant data paint a picture of a market that’s increasingly confident in USDC’s expanding footprint and, by extension, in Circle’s business model. That confidence is showing up in Circle’s valuation and in growing usage across decentralized finance, tokenized markets, and agent-driven payments. If USDC’s supply keeps climbing and trading volume eventually catches up to the current valuation trend, further price appreciation for Circle could follow.
Still, that upside isn’t guaranteed. Broader crypto market conditions can shift quickly, and a sudden change in sentiment across major cryptocurrencies could just as easily interrupt USDC’s current momentum. For now, traders and analysts alike appear to be watching the same signal: whether stablecoin growth keeps translating into real valuation gains, or whether the current enthusiasm cools once trading volume is forced to catch up with the headlines.
FAQ
What caused Circle’s valuation to rise recently?
Circle’s valuation rose alongside the growth of USDC’s market capitalization, reflecting increased market confidence in USDC’s expansion, according to CryptoQuant data shared on X.
How is USDC used in the cryptocurrency market?
USDC is a US dollar-pegged stablecoin widely used in crypto trading and liquidity, serving as a key asset for trading and maintaining stable value across decentralized finance and other crypto markets.
Does increased trading activity for USDC mean a large market impact currently?
Although USDC’s trading activity has increased, the overall trading volume remains low, which may limit its immediate market impact even as its valuation and supply climb.
Are there risks associated with the current optimism around Circle and USDC?
Yes, potential risks exist if overall cryptocurrency market conditions shift suddenly, which could affect the positive trends currently supporting Circle’s valuation and USDC’s expansion.
Article produced with the assistance of artificial intelligence and reviewed by the editorial team.
36
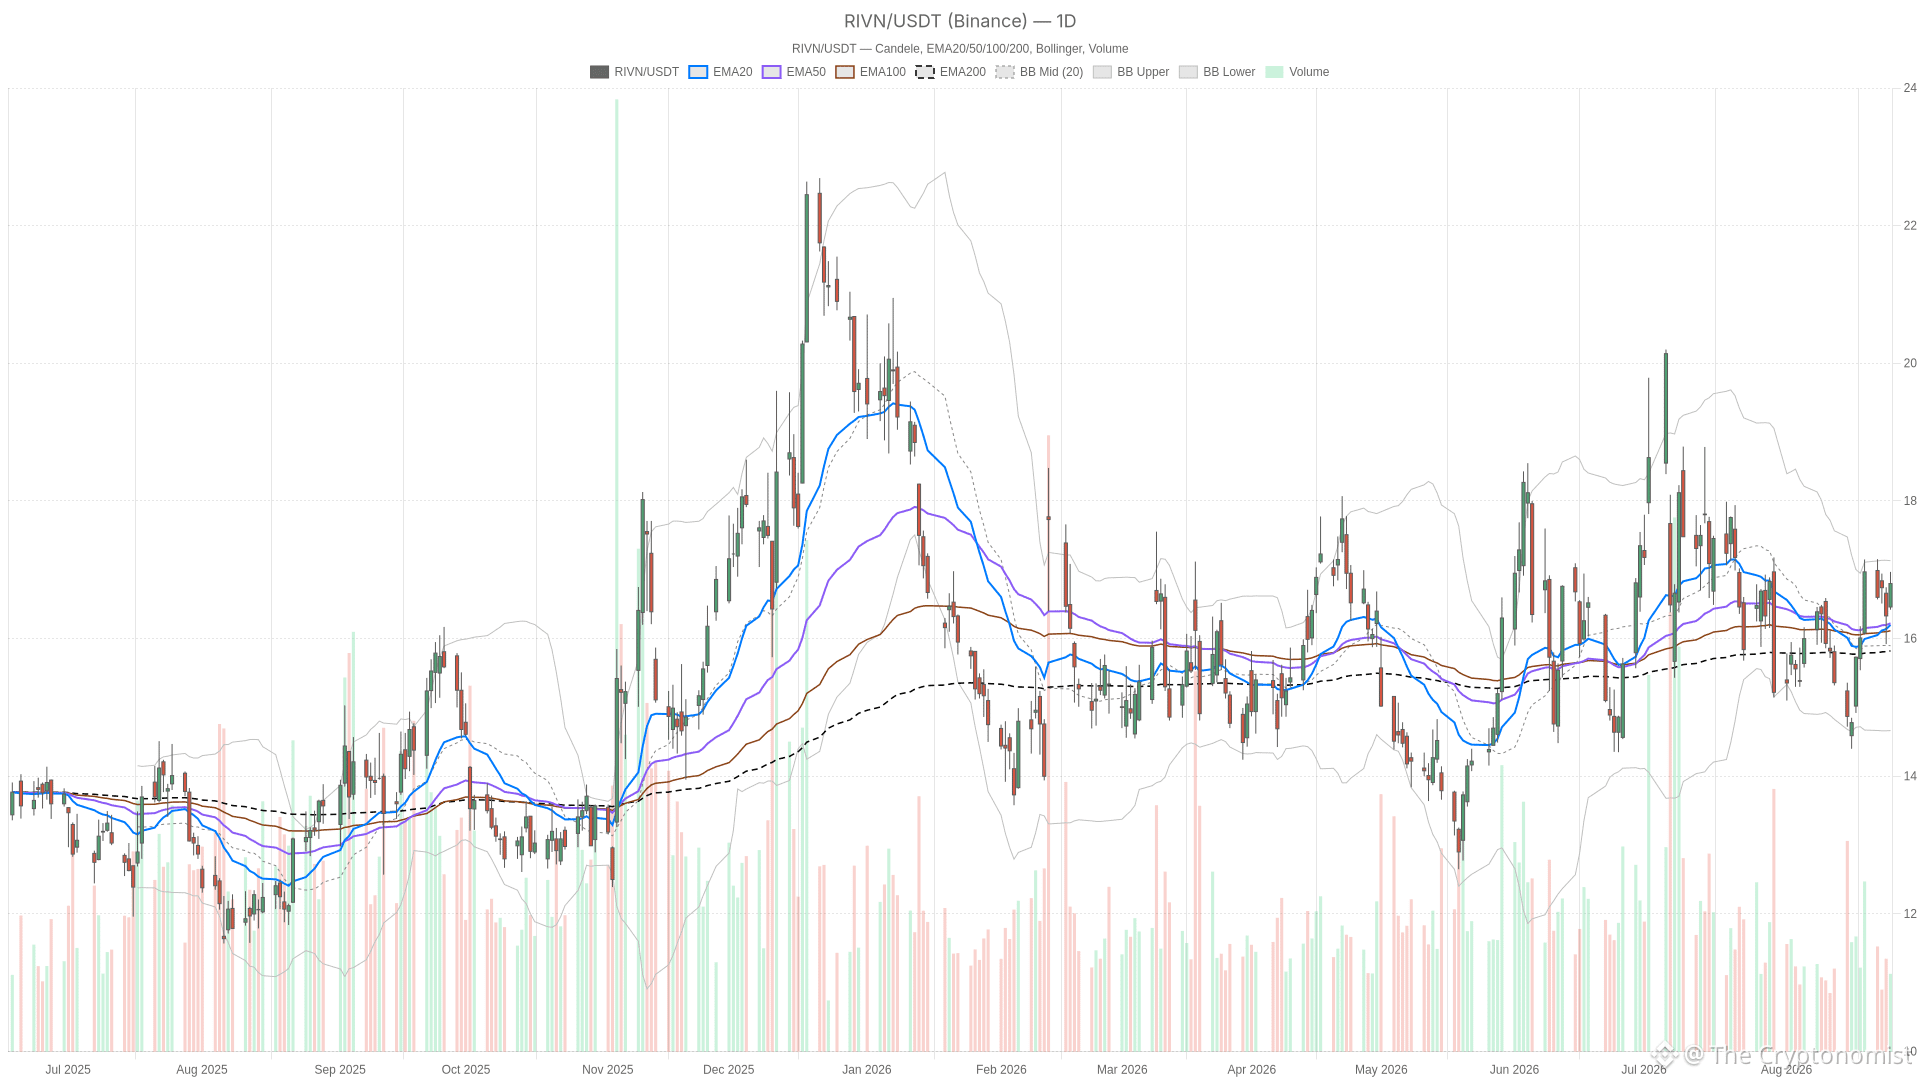
Article
Rivian stock nears $17.04 resistance as CFO exit clouds the setupRivian stock closed Thursday at $16.80 after trading between $16.42 and $16.97. The session showed a market building on recent gains. However, CFO Claire McDonough’s announced departure to GE Vernova adds uncertainty into Friday’s open, testing the technical setup.
RIVN — daily chart with candlesticks, EMA20/EMA50 and volume.
Key takeaways
Rivian stock closed Thursday at $16.80, above its $16.46 open and near the daily upper Bollinger Band at $17.13.
The daily MACD turned positive with a 0.15 histogram, but the daily regime remains neutral.
CFO Claire McDonough steps down October 30 to join GE Vernova during the R2 ramp.
Key resistance sits at $17.04 (daily R1), with support near $16.49 (daily S1).
The 1H timeframe is bullish, while the 15-minute MACD histogram has flipped slightly negative.
Rivian Stock Daily Chart: A Cautious Attempt at a Breakout
Rivian stock’s daily chart shows a cautious breakout attempt rather than a confirmed trend. Price closed above the EMA20 ($16.20), EMA50 ($16.22) and EMA200 ($15.82). That looks constructive on the surface. However, the EMA20 and EMA50 are nearly overlapping. This signals a market still flattening out of consolidation, not one in a clean trend.
The daily RSI at 54.8 sits in neutral territory, above the midline but far from overbought. Meanwhile, the daily MACD line (0.04) has crossed above its signal line (-0.12). The positive histogram of 0.15 marks a shift from fading downside momentum toward early upside momentum.
Daily Bollinger Bands place the mid-line at $15.90, the upper band at $17.13 and the lower band at $14.66. Thursday’s close at $16.80 sits near the upper band. This typically reflects an expansion phase after tighter, low-volatility trading. Daily ATR14 at 0.65 confirms volatility is picking up relative to price.
Daily pivot levels set the pivot at $16.73, resistance R1 at $17.04 and support S1 at $16.49. Closing above the pivot and pushing toward R1 is a near-term positive. Still, price is now bumping directly against a key resistance zone rather than trading with clean room above it.
1H Timeframe: Momentum Confirms, but Narrowly
The 1-hour timeframe confirms the bullish turn, though the momentum signal remains thin. Price at $16.80 sits above the EMA20 ($16.56), EMA50 ($16.35) and EMA200 ($16.24). The system flags this timeframe as bullish outright. RSI at 60.18 supports that view, showing intraday buyers in control without stretched conditions.
The 1H MACD line (0.08) is above its signal line (0.05), with a positive but thin histogram of 0.03. That is a genuine bullish signal, yet the small histogram suggests limited force. In other words, the 1H chart confirms the daily attempt to turn higher, but without much conviction.
1H Bollinger Bands show the mid at $16.54 and the upper band at $17.12, with price hugging that boundary. Combined with an ATR14 of 0.23, this points to a market that has already made a meaningful short-term move. It is now testing how much further it can extend before pausing. The 1H pivot at $16.79, resistance at $16.89 and support at $16.69 form a tight, undecided zone.
15-Minute Execution Context: Momentum Stalls Near Resistance
The 15-minute chart shows short-term momentum stalling right near resistance. The regime is still labeled bullish. Price holds above the EMA20 ($16.71), EMA50 ($16.61) and EMA200 ($16.33). RSI at 58.68 remains constructive. Notice, however, that the MACD line and signal line are essentially equal at 0.08. The histogram has flipped slightly negative at -0.01. That is a subtle but real warning: momentum is losing its edge as price approaches resistance.
The 15-minute Bollinger Bands have compressed sharply. The mid sits at $16.73 and the upper band at just $16.83, a tight range versus the daily and hourly bands. This compression, paired with an ATR14 of only 0.08, often precedes a decisive move once the range breaks. The 15m pivot at $16.82, resistance at $16.87 and support at $16.74 frame the immediate battleground for traders watching RIVN stock price action into Friday’s session.
Bullish Scenario: Clearing the $17.04–$17.13 Zone
The bullish case requires a clean break above $17.04 and a sustained close beyond $17.13. That break would confirm the daily MACD crossover is more than a false start. It would likely pull the EMA20 above the EMA50 on the daily chart, reinforcing the shift already visible on the 1H timeframe. Holding above the $16.69–$16.79 hourly support zone, with RSI staying above 50 across timeframes, would keep the short-term uptrend intact.
Notably, one of this week’s news items framed Rivian as ‘an EV maker on the rebound.’ If that is reflected in continued buying interest, it would align with the technical push toward resistance.
Bearish Scenario: CFO Exit Meets a Resistance Wall
The bearish case hinges on the CFO departure landing at a sensitive technical juncture. On the other hand, a failure to clear the $16.87–$17.04 resistance band would matter. Combined with the already-flattening 15-minute MACD histogram, it would suggest buyers are running out of steam at the top of the range. In that scenario, price could retreat toward daily S1 at $16.49 or the EMA20/EMA50 cluster near $16.20–$16.22.
A daily close back below that EMA cluster would invalidate the tentative bullish structure. It would shift the neutral daily regime firmly toward the downside. McDonough’s exit adds execution risk to the R2 ramp during a period of fragile EV demand.
Closing Thoughts: A Two-Sided Inflection Point
Rivian stock sits at a two-sided technical inflection point. Overall, the daily chart shows early signs of a momentum shift. The 1-hour timeframe confirms that shift with a clearer bullish regime. The 15-minute chart shows the push losing steam into resistance. Meanwhile, the CFO transition introduces a fundamental variable the charts alone cannot price in.
Volatility, as measured by ATR across all three timeframes, has been building. Price is squeezed between resistance near $16.87–$17.04 and support near $16.49–$16.69. The next directional move is likely to be sharp once it comes. Positioning around RIVN stock into this window should account for that two-sided risk rather than assume the grind higher continues uninterrupted.
FAQ
What is the key resistance level for Rivian stock?
The key resistance band sits at $16.87–$17.04, with daily R1 at $17.04 and the upper Bollinger Band at $17.13. A sustained close above that zone would confirm the bullish case.
Why does the CFO departure matter to the technical setup?
CFO Claire McDonough is stepping down October 30 to join GE Vernova during the R2 ramp. The stock reportedly slipped after-hours on the news, adding execution risk at a sensitive technical juncture.
Where is the key support if Rivian stock pulls back?
Support sits near daily S1 at $16.49, with a deeper EMA20/EMA50 cluster near $16.20–$16.22. A daily close below that cluster would invalidate the bullish structure.
Is the current trend bullish or neutral?
The 1-hour timeframe is bullish, while the daily regime remains neutral. The 15-minute chart shows short-term momentum stalling near resistance, making the setup two-sided.
Disclaimer: This article is for informational purposes only and does not constitute financial advice, an investment recommendation, or a solicitation to buy or sell any financial instrument or cryptocurrency. The analysis provided is not indicative of future results. Investing in crypto assets and financial markets carries a high risk of capital loss. Always do your own research (DYOR) and consult a qualified financial advisor before making any decision.
Article produced with the assistance of artificial intelligence and reviewed by the editorial team.
Rivian stock nears $17.04 resistance as CFO exit clouds the setup
Rivian stock closed Thursday at $16.80 after trading between $16.42 and $16.97. The session showed a market building on recent gains. However, CFO Claire McDonough’s announced departure to GE Vernova adds uncertainty into Friday’s open, testing the technical setup.
RIVN — daily chart with candlesticks, EMA20/EMA50 and volume.
Key takeaways
Rivian stock closed Thursday at $16.80, above its $16.46 open and near the daily upper Bollinger Band at $17.13.
The daily MACD turned positive with a 0.15 histogram, but the daily regime remains neutral.
CFO Claire McDonough steps down October 30 to join GE Vernova during the R2 ramp.
Key resistance sits at $17.04 (daily R1), with support near $16.49 (daily S1).
The 1H timeframe is bullish, while the 15-minute MACD histogram has flipped slightly negative.
Rivian Stock Daily Chart: A Cautious Attempt at a Breakout
Rivian stock’s daily chart shows a cautious breakout attempt rather than a confirmed trend. Price closed above the EMA20 ($16.20), EMA50 ($16.22) and EMA200 ($15.82). That looks constructive on the surface. However, the EMA20 and EMA50 are nearly overlapping. This signals a market still flattening out of consolidation, not one in a clean trend.
The daily RSI at 54.8 sits in neutral territory, above the midline but far from overbought. Meanwhile, the daily MACD line (0.04) has crossed above its signal line (-0.12). The positive histogram of 0.15 marks a shift from fading downside momentum toward early upside momentum.
Daily Bollinger Bands place the mid-line at $15.90, the upper band at $17.13 and the lower band at $14.66. Thursday’s close at $16.80 sits near the upper band. This typically reflects an expansion phase after tighter, low-volatility trading. Daily ATR14 at 0.65 confirms volatility is picking up relative to price.
Daily pivot levels set the pivot at $16.73, resistance R1 at $17.04 and support S1 at $16.49. Closing above the pivot and pushing toward R1 is a near-term positive. Still, price is now bumping directly against a key resistance zone rather than trading with clean room above it.
1H Timeframe: Momentum Confirms, but Narrowly
The 1-hour timeframe confirms the bullish turn, though the momentum signal remains thin. Price at $16.80 sits above the EMA20 ($16.56), EMA50 ($16.35) and EMA200 ($16.24). The system flags this timeframe as bullish outright. RSI at 60.18 supports that view, showing intraday buyers in control without stretched conditions.
The 1H MACD line (0.08) is above its signal line (0.05), with a positive but thin histogram of 0.03. That is a genuine bullish signal, yet the small histogram suggests limited force. In other words, the 1H chart confirms the daily attempt to turn higher, but without much conviction.
1H Bollinger Bands show the mid at $16.54 and the upper band at $17.12, with price hugging that boundary. Combined with an ATR14 of 0.23, this points to a market that has already made a meaningful short-term move. It is now testing how much further it can extend before pausing. The 1H pivot at $16.79, resistance at $16.89 and support at $16.69 form a tight, undecided zone.
15-Minute Execution Context: Momentum Stalls Near Resistance
The 15-minute chart shows short-term momentum stalling right near resistance. The regime is still labeled bullish. Price holds above the EMA20 ($16.71), EMA50 ($16.61) and EMA200 ($16.33). RSI at 58.68 remains constructive. Notice, however, that the MACD line and signal line are essentially equal at 0.08. The histogram has flipped slightly negative at -0.01. That is a subtle but real warning: momentum is losing its edge as price approaches resistance.
The 15-minute Bollinger Bands have compressed sharply. The mid sits at $16.73 and the upper band at just $16.83, a tight range versus the daily and hourly bands. This compression, paired with an ATR14 of only 0.08, often precedes a decisive move once the range breaks. The 15m pivot at $16.82, resistance at $16.87 and support at $16.74 frame the immediate battleground for traders watching RIVN stock price action into Friday’s session.
Bullish Scenario: Clearing the $17.04–$17.13 Zone
The bullish case requires a clean break above $17.04 and a sustained close beyond $17.13. That break would confirm the daily MACD crossover is more than a false start. It would likely pull the EMA20 above the EMA50 on the daily chart, reinforcing the shift already visible on the 1H timeframe. Holding above the $16.69–$16.79 hourly support zone, with RSI staying above 50 across timeframes, would keep the short-term uptrend intact.
Notably, one of this week’s news items framed Rivian as ‘an EV maker on the rebound.’ If that is reflected in continued buying interest, it would align with the technical push toward resistance.
Bearish Scenario: CFO Exit Meets a Resistance Wall
The bearish case hinges on the CFO departure landing at a sensitive technical juncture. On the other hand, a failure to clear the $16.87–$17.04 resistance band would matter. Combined with the already-flattening 15-minute MACD histogram, it would suggest buyers are running out of steam at the top of the range. In that scenario, price could retreat toward daily S1 at $16.49 or the EMA20/EMA50 cluster near $16.20–$16.22.
A daily close back below that EMA cluster would invalidate the tentative bullish structure. It would shift the neutral daily regime firmly toward the downside. McDonough’s exit adds execution risk to the R2 ramp during a period of fragile EV demand.
Closing Thoughts: A Two-Sided Inflection Point
Rivian stock sits at a two-sided technical inflection point. Overall, the daily chart shows early signs of a momentum shift. The 1-hour timeframe confirms that shift with a clearer bullish regime. The 15-minute chart shows the push losing steam into resistance. Meanwhile, the CFO transition introduces a fundamental variable the charts alone cannot price in.
Volatility, as measured by ATR across all three timeframes, has been building. Price is squeezed between resistance near $16.87–$17.04 and support near $16.49–$16.69. The next directional move is likely to be sharp once it comes. Positioning around RIVN stock into this window should account for that two-sided risk rather than assume the grind higher continues uninterrupted.
FAQ
What is the key resistance level for Rivian stock?
The key resistance band sits at $16.87–$17.04, with daily R1 at $17.04 and the upper Bollinger Band at $17.13. A sustained close above that zone would confirm the bullish case.
Why does the CFO departure matter to the technical setup?
CFO Claire McDonough is stepping down October 30 to join GE Vernova during the R2 ramp. The stock reportedly slipped after-hours on the news, adding execution risk at a sensitive technical juncture.
Where is the key support if Rivian stock pulls back?
Support sits near daily S1 at $16.49, with a deeper EMA20/EMA50 cluster near $16.20–$16.22. A daily close below that cluster would invalidate the bullish structure.
Is the current trend bullish or neutral?
The 1-hour timeframe is bullish, while the daily regime remains neutral. The 15-minute chart shows short-term momentum stalling near resistance, making the setup two-sided.
Disclaimer: This article is for informational purposes only and does not constitute financial advice, an investment recommendation, or a solicitation to buy or sell any financial instrument or cryptocurrency. The analysis provided is not indicative of future results. Investing in crypto assets and financial markets carries a high risk of capital loss. Always do your own research (DYOR) and consult a qualified financial advisor before making any decision.
Article produced with the assistance of artificial intelligence and reviewed by the editorial team.
RIVN — daily chart with candlesticks, EMA20/EMA50 and volume.
Key takeaways
Rivian stock closed Thursday at $16.80, above its $16.46 open and near the daily upper Bollinger Band at $17.13.
The daily MACD turned positive with a 0.15 histogram, but the daily regime remains neutral.
CFO Claire McDonough steps down October 30 to join GE Vernova during the R2 ramp.
Key resistance sits at $17.04 (daily R1), with support near $16.49 (daily S1).
The 1H timeframe is bullish, while the 15-minute MACD histogram has flipped slightly negative.
Rivian Stock Daily Chart: A Cautious Attempt at a Breakout
Rivian stock’s daily chart shows a cautious breakout attempt rather than a confirmed trend. Price closed above the EMA20 ($16.20), EMA50 ($16.22) and EMA200 ($15.82). That looks constructive on the surface. However, the EMA20 and EMA50 are nearly overlapping. This signals a market still flattening out of consolidation, not one in a clean trend.
The daily RSI at 54.8 sits in neutral territory, above the midline but far from overbought. Meanwhile, the daily MACD line (0.04) has crossed above its signal line (-0.12). The positive histogram of 0.15 marks a shift from fading downside momentum toward early upside momentum.
Daily Bollinger Bands place the mid-line at $15.90, the upper band at $17.13 and the lower band at $14.66. Thursday’s close at $16.80 sits near the upper band. This typically reflects an expansion phase after tighter, low-volatility trading. Daily ATR14 at 0.65 confirms volatility is picking up relative to price.
Daily pivot levels set the pivot at $16.73, resistance R1 at $17.04 and support S1 at $16.49. Closing above the pivot and pushing toward R1 is a near-term positive. Still, price is now bumping directly against a key resistance zone rather than trading with clean room above it.
1H Timeframe: Momentum Confirms, but Narrowly
The 1-hour timeframe confirms the bullish turn, though the momentum signal remains thin. Price at $16.80 sits above the EMA20 ($16.56), EMA50 ($16.35) and EMA200 ($16.24). The system flags this timeframe as bullish outright. RSI at 60.18 supports that view, showing intraday buyers in control without stretched conditions.
The 1H MACD line (0.08) is above its signal line (0.05), with a positive but thin histogram of 0.03. That is a genuine bullish signal, yet the small histogram suggests limited force. In other words, the 1H chart confirms the daily attempt to turn higher, but without much conviction.
1H Bollinger Bands show the mid at $16.54 and the upper band at $17.12, with price hugging that boundary. Combined with an ATR14 of 0.23, this points to a market that has already made a meaningful short-term move. It is now testing how much further it can extend before pausing. The 1H pivot at $16.79, resistance at $16.89 and support at $16.69 form a tight, undecided zone.
15-Minute Execution Context: Momentum Stalls Near Resistance
The 15-minute chart shows short-term momentum stalling right near resistance. The regime is still labeled bullish. Price holds above the EMA20 ($16.71), EMA50 ($16.61) and EMA200 ($16.33). RSI at 58.68 remains constructive. Notice, however, that the MACD line and signal line are essentially equal at 0.08. The histogram has flipped slightly negative at -0.01. That is a subtle but real warning: momentum is losing its edge as price approaches resistance.
The 15-minute Bollinger Bands have compressed sharply. The mid sits at $16.73 and the upper band at just $16.83, a tight range versus the daily and hourly bands. This compression, paired with an ATR14 of only 0.08, often precedes a decisive move once the range breaks. The 15m pivot at $16.82, resistance at $16.87 and support at $16.74 frame the immediate battleground for traders watching RIVN stock price action into Friday’s session.
Bullish Scenario: Clearing the $17.04–$17.13 Zone
The bullish case requires a clean break above $17.04 and a sustained close beyond $17.13. That break would confirm the daily MACD crossover is more than a false start. It would likely pull the EMA20 above the EMA50 on the daily chart, reinforcing the shift already visible on the 1H timeframe. Holding above the $16.69–$16.79 hourly support zone, with RSI staying above 50 across timeframes, would keep the short-term uptrend intact.
Notably, one of this week’s news items framed Rivian as ‘an EV maker on the rebound.’ If that is reflected in continued buying interest, it would align with the technical push toward resistance.
Bearish Scenario: CFO Exit Meets a Resistance Wall
The bearish case hinges on the CFO departure landing at a sensitive technical juncture. On the other hand, a failure to clear the $16.87–$17.04 resistance band would matter. Combined with the already-flattening 15-minute MACD histogram, it would suggest buyers are running out of steam at the top of the range. In that scenario, price could retreat toward daily S1 at $16.49 or the EMA20/EMA50 cluster near $16.20–$16.22.
A daily close back below that EMA cluster would invalidate the tentative bullish structure. It would shift the neutral daily regime firmly toward the downside. McDonough’s exit adds execution risk to the R2 ramp during a period of fragile EV demand.
Closing Thoughts: A Two-Sided Inflection Point
Rivian stock sits at a two-sided technical inflection point. Overall, the daily chart shows early signs of a momentum shift. The 1-hour timeframe confirms that shift with a clearer bullish regime. The 15-minute chart shows the push losing steam into resistance. Meanwhile, the CFO transition introduces a fundamental variable the charts alone cannot price in.
Volatility, as measured by ATR across all three timeframes, has been building. Price is squeezed between resistance near $16.87–$17.04 and support near $16.49–$16.69. The next directional move is likely to be sharp once it comes. Positioning around RIVN stock into this window should account for that two-sided risk rather than assume the grind higher continues uninterrupted.
FAQ
What is the key resistance level for Rivian stock?
The key resistance band sits at $16.87–$17.04, with daily R1 at $17.04 and the upper Bollinger Band at $17.13. A sustained close above that zone would confirm the bullish case.
Why does the CFO departure matter to the technical setup?
CFO Claire McDonough is stepping down October 30 to join GE Vernova during the R2 ramp. The stock reportedly slipped after-hours on the news, adding execution risk at a sensitive technical juncture.
Where is the key support if Rivian stock pulls back?
Support sits near daily S1 at $16.49, with a deeper EMA20/EMA50 cluster near $16.20–$16.22. A daily close below that cluster would invalidate the bullish structure.
Is the current trend bullish or neutral?
The 1-hour timeframe is bullish, while the daily regime remains neutral. The 15-minute chart shows short-term momentum stalling near resistance, making the setup two-sided.
Disclaimer: This article is for informational purposes only and does not constitute financial advice, an investment recommendation, or a solicitation to buy or sell any financial instrument or cryptocurrency. The analysis provided is not indicative of future results. Investing in crypto assets and financial markets carries a high risk of capital loss. Always do your own research (DYOR) and consult a qualified financial advisor before making any decision.
Article produced with the assistance of artificial intelligence and reviewed by the editorial team.
13

Article
Nike stock hits fresh 52-week low as bearish trend deepensNike stock (NKE) remains locked in a well-defined downtrend. Shares closed at 38.44, below the daily pivot of 38.47 and below the lower Bollinger Band at 38.45. The 52-week low near 38.17 from today keeps sentiment under pressure.
NKE — daily chart with candlesticks, EMA20/EMA50 and volume.
Key takeaways
Nike stock closed at 38.44, below the daily pivot of 38.47 and below the lower Bollinger Band at 38.45.
Daily EMAs are stacked bearish, with price below the ema20 at 40.6, the ema50 at 42.01, and the ema200 at 50.05.
The daily RSI14 at 36.6 leaves room for further downside before oversold conditions appear.
The daily MACD line at -0.89 sits below its signal line at -0.7, confirming persistent downside momentum.
Bulls need to reclaim 38.5 and the Bollinger mid-band at 40.82, while sellers target a break below 38.14.
Nike Stock Technical Structure: Daily Bias Stays Bearish
The daily chart confirms a clear bearish regime for Nike stock. Price sits well below the ema20 at 40.6, the ema50 at 42.01, and the ema200 at 50.05. This stacked bearish alignment leaves little doubt about the dominant trend.
Meanwhile, the daily RSI14 at 36.6 is not yet in oversold territory. That means the decline could still extend before any mean-reversion argument gains traction. The daily MACD line at -0.89 remains below its signal line at -0.7. The histogram of -0.19 confirms downside momentum is still in control rather than fading.
Bollinger Bands and Volatility Context
Overall, Bollinger Bands reinforce the bearish read. The mid-band sits at 40.82 and the upper band at 43.19. Price trading right at the lower band near 38.45 signals that sellers are driving volatility almost entirely. The daily ATR14 of 1.13 points to elevated volatility, typical of sustained downtrends rather than quiet consolidation.
Lower Timeframe Confirmation
On the 1H timeframe, the picture stays consistent with the daily bias. Price at 38.43 remains below the ema20 at 38.9, the ema50 at 39.62, and the ema200 at 40.93. This mirrors the daily structure at a shorter horizon. The 1H RSI14 at 31.28 edges closer to oversold conditions.
Notably, the 1H MACD line and signal line are essentially converging at -0.49. The histogram is flattening to 0. This hints that downside momentum may be pausing rather than accelerating in the very near term.
However, this creates a subtle tension between timeframes. The daily chart still shows momentum pressing lower. At the same time, the flattening 1H MACD histogram suggests sellers may be losing some short-term steam. This does not flip the bias bullish. Yet it suggests any near-term bounce should be read as corrective within a larger downtrend.
Execution Context on the 15-Minute Chart
On the 15-minute timeframe, the regime reads neutral. Price at 38.43 hovers almost exactly at its ema20 of 38.42. The 15m RSI14 at 47.76 sits near the midpoint, and the MACD histogram has ticked slightly positive at 0.02. This reflects short-term stabilization after the recent slide toward the 52-week low. Meanwhile, pivot levels cluster tightly around 38.41 for the pivot point, 38.5 for R1, and 38.34 for S1.
Bullish Scenario for Nike Stock
A bullish turn in Nike stock requires reclaiming key short-term resistance. Price would need to recover the daily pivot at 38.47 and hold above the 1H resistance near 38.5.
On the fundamental side, some support exists. Recent valuation commentary noted that Nike stock looks undervalued on an earnings basis. In contrast, discounted cash flow analysis suggests shares are closer to fair value.
If buyers push price back above the ema20 clusters on both the daily and 1H charts, that would be an early signal. A decisively positive 1H MACD histogram would add confirmation that the corrective bounce is gaining traction. A reclaim of the daily Bollinger mid-band at 40.82 would be the more meaningful confirmation that the downtrend is losing force.
Bearish Scenario and Invalidation Levels
The more likely path, based on current evidence, favors continued downside. A break below the daily S1 at 38.14 would confirm sellers remain firmly in control. The daily RSI14 pushing below 30 would reinforce that read.
Meanwhile, news flow adds weight to this scenario. Analysts have been cutting price targets on Nike stock amid weak demand signals. Notably, Dick’s Sporting Goods’ recent warning has been flagged as a poor omen for athletic apparel names, including Nike.
Overall, this scenario simply requires the bearish alignment to persist. That is the path of least resistance given the stacked EMA structure across the higher timeframes.
Closing Thoughts on Nike Stock Positioning
Nike stock sits at a technically fragile point heading into the next session. Price trades near its lower daily Bollinger Band and at 52-week lows. Daily momentum remains tilted bearish, and the 1H timeframe confirms that broader weakness.
At the same time, short-term flattening in 1H MACD momentum and neutral 15m conditions suggest near-term consolidation before the next directional move. Given elevated ATR readings and ongoing headline risk around consumer demand and traffic softness, volatility is likely to stay elevated.
Positioning around this asset should account for the possibility of sharp intraday swings. On balance, this remains a daily downtrend that has yet to show convincing signs of exhaustion.
FAQ
What is the current trend for Nike stock?
The daily chart shows a bearish trend. Nike stock closed at 38.44, below its ema20 at 40.6, ema50 at 42.01, and ema200 at 50.05.
Where is the key support level for Nike stock?
The immediate downside level is the daily S1 at 38.14. A break below this level would confirm sellers remain in control.
What would signal a bullish reversal in Nike stock?
Bulls would need to reclaim 38.5 and push above the ema20 clusters. A reclaim of the daily Bollinger mid-band at 40.82 would confirm the downtrend is losing force.
Is Nike stock oversold right now?
Not yet on the daily timeframe. The daily RSI14 sits at 36.6, leaving room for further downside before oversold conditions below 30 appear.
Disclaimer: This article is for informational purposes only and does not constitute financial advice, an investment recommendation, or a solicitation to buy or sell any financial instrument or cryptocurrency. The analysis provided is not indicative of future results. Investing in crypto assets and financial markets carries a high risk of capital loss. Always do your own research (DYOR) and consult a qualified financial advisor before making any decision.
Article produced with the assistance of artificial intelligence and reviewed by the editorial team.
Nike stock hits fresh 52-week low as bearish trend deepens
Nike stock (NKE) remains locked in a well-defined downtrend. Shares closed at 38.44, below the daily pivot of 38.47 and below the lower Bollinger Band at 38.45. The 52-week low near 38.17 from today keeps sentiment under pressure.
NKE — daily chart with candlesticks, EMA20/EMA50 and volume.
Key takeaways
Nike stock closed at 38.44, below the daily pivot of 38.47 and below the lower Bollinger Band at 38.45.
Daily EMAs are stacked bearish, with price below the ema20 at 40.6, the ema50 at 42.01, and the ema200 at 50.05.
The daily RSI14 at 36.6 leaves room for further downside before oversold conditions appear.
The daily MACD line at -0.89 sits below its signal line at -0.7, confirming persistent downside momentum.
Bulls need to reclaim 38.5 and the Bollinger mid-band at 40.82, while sellers target a break below 38.14.
Nike Stock Technical Structure: Daily Bias Stays Bearish
The daily chart confirms a clear bearish regime for Nike stock. Price sits well below the ema20 at 40.6, the ema50 at 42.01, and the ema200 at 50.05. This stacked bearish alignment leaves little doubt about the dominant trend.
Meanwhile, the daily RSI14 at 36.6 is not yet in oversold territory. That means the decline could still extend before any mean-reversion argument gains traction. The daily MACD line at -0.89 remains below its signal line at -0.7. The histogram of -0.19 confirms downside momentum is still in control rather than fading.
Bollinger Bands and Volatility Context
Overall, Bollinger Bands reinforce the bearish read. The mid-band sits at 40.82 and the upper band at 43.19. Price trading right at the lower band near 38.45 signals that sellers are driving volatility almost entirely. The daily ATR14 of 1.13 points to elevated volatility, typical of sustained downtrends rather than quiet consolidation.
Lower Timeframe Confirmation
On the 1H timeframe, the picture stays consistent with the daily bias. Price at 38.43 remains below the ema20 at 38.9, the ema50 at 39.62, and the ema200 at 40.93. This mirrors the daily structure at a shorter horizon. The 1H RSI14 at 31.28 edges closer to oversold conditions.
Notably, the 1H MACD line and signal line are essentially converging at -0.49. The histogram is flattening to 0. This hints that downside momentum may be pausing rather than accelerating in the very near term.
However, this creates a subtle tension between timeframes. The daily chart still shows momentum pressing lower. At the same time, the flattening 1H MACD histogram suggests sellers may be losing some short-term steam. This does not flip the bias bullish. Yet it suggests any near-term bounce should be read as corrective within a larger downtrend.
Execution Context on the 15-Minute Chart
On the 15-minute timeframe, the regime reads neutral. Price at 38.43 hovers almost exactly at its ema20 of 38.42. The 15m RSI14 at 47.76 sits near the midpoint, and the MACD histogram has ticked slightly positive at 0.02. This reflects short-term stabilization after the recent slide toward the 52-week low. Meanwhile, pivot levels cluster tightly around 38.41 for the pivot point, 38.5 for R1, and 38.34 for S1.
Bullish Scenario for Nike Stock
A bullish turn in Nike stock requires reclaiming key short-term resistance. Price would need to recover the daily pivot at 38.47 and hold above the 1H resistance near 38.5.
On the fundamental side, some support exists. Recent valuation commentary noted that Nike stock looks undervalued on an earnings basis. In contrast, discounted cash flow analysis suggests shares are closer to fair value.
If buyers push price back above the ema20 clusters on both the daily and 1H charts, that would be an early signal. A decisively positive 1H MACD histogram would add confirmation that the corrective bounce is gaining traction. A reclaim of the daily Bollinger mid-band at 40.82 would be the more meaningful confirmation that the downtrend is losing force.
Bearish Scenario and Invalidation Levels
The more likely path, based on current evidence, favors continued downside. A break below the daily S1 at 38.14 would confirm sellers remain firmly in control. The daily RSI14 pushing below 30 would reinforce that read.
Meanwhile, news flow adds weight to this scenario. Analysts have been cutting price targets on Nike stock amid weak demand signals. Notably, Dick’s Sporting Goods’ recent warning has been flagged as a poor omen for athletic apparel names, including Nike.
Overall, this scenario simply requires the bearish alignment to persist. That is the path of least resistance given the stacked EMA structure across the higher timeframes.
Closing Thoughts on Nike Stock Positioning
Nike stock sits at a technically fragile point heading into the next session. Price trades near its lower daily Bollinger Band and at 52-week lows. Daily momentum remains tilted bearish, and the 1H timeframe confirms that broader weakness.
At the same time, short-term flattening in 1H MACD momentum and neutral 15m conditions suggest near-term consolidation before the next directional move. Given elevated ATR readings and ongoing headline risk around consumer demand and traffic softness, volatility is likely to stay elevated.
Positioning around this asset should account for the possibility of sharp intraday swings. On balance, this remains a daily downtrend that has yet to show convincing signs of exhaustion.
FAQ
What is the current trend for Nike stock?
The daily chart shows a bearish trend. Nike stock closed at 38.44, below its ema20 at 40.6, ema50 at 42.01, and ema200 at 50.05.
Where is the key support level for Nike stock?
The immediate downside level is the daily S1 at 38.14. A break below this level would confirm sellers remain in control.
What would signal a bullish reversal in Nike stock?
Bulls would need to reclaim 38.5 and push above the ema20 clusters. A reclaim of the daily Bollinger mid-band at 40.82 would confirm the downtrend is losing force.
Is Nike stock oversold right now?
Not yet on the daily timeframe. The daily RSI14 sits at 36.6, leaving room for further downside before oversold conditions below 30 appear.
Disclaimer: This article is for informational purposes only and does not constitute financial advice, an investment recommendation, or a solicitation to buy or sell any financial instrument or cryptocurrency. The analysis provided is not indicative of future results. Investing in crypto assets and financial markets carries a high risk of capital loss. Always do your own research (DYOR) and consult a qualified financial advisor before making any decision.
Article produced with the assistance of artificial intelligence and reviewed by the editorial team.
NKE — daily chart with candlesticks, EMA20/EMA50 and volume.
Key takeaways
Nike stock closed at 38.44, below the daily pivot of 38.47 and below the lower Bollinger Band at 38.45.
Daily EMAs are stacked bearish, with price below the ema20 at 40.6, the ema50 at 42.01, and the ema200 at 50.05.
The daily RSI14 at 36.6 leaves room for further downside before oversold conditions appear.
The daily MACD line at -0.89 sits below its signal line at -0.7, confirming persistent downside momentum.
Bulls need to reclaim 38.5 and the Bollinger mid-band at 40.82, while sellers target a break below 38.14.
Nike Stock Technical Structure: Daily Bias Stays Bearish
The daily chart confirms a clear bearish regime for Nike stock. Price sits well below the ema20 at 40.6, the ema50 at 42.01, and the ema200 at 50.05. This stacked bearish alignment leaves little doubt about the dominant trend.
Meanwhile, the daily RSI14 at 36.6 is not yet in oversold territory. That means the decline could still extend before any mean-reversion argument gains traction. The daily MACD line at -0.89 remains below its signal line at -0.7. The histogram of -0.19 confirms downside momentum is still in control rather than fading.
Bollinger Bands and Volatility Context
Overall, Bollinger Bands reinforce the bearish read. The mid-band sits at 40.82 and the upper band at 43.19. Price trading right at the lower band near 38.45 signals that sellers are driving volatility almost entirely. The daily ATR14 of 1.13 points to elevated volatility, typical of sustained downtrends rather than quiet consolidation.
Lower Timeframe Confirmation
On the 1H timeframe, the picture stays consistent with the daily bias. Price at 38.43 remains below the ema20 at 38.9, the ema50 at 39.62, and the ema200 at 40.93. This mirrors the daily structure at a shorter horizon. The 1H RSI14 at 31.28 edges closer to oversold conditions.
Notably, the 1H MACD line and signal line are essentially converging at -0.49. The histogram is flattening to 0. This hints that downside momentum may be pausing rather than accelerating in the very near term.
However, this creates a subtle tension between timeframes. The daily chart still shows momentum pressing lower. At the same time, the flattening 1H MACD histogram suggests sellers may be losing some short-term steam. This does not flip the bias bullish. Yet it suggests any near-term bounce should be read as corrective within a larger downtrend.
Execution Context on the 15-Minute Chart
On the 15-minute timeframe, the regime reads neutral. Price at 38.43 hovers almost exactly at its ema20 of 38.42. The 15m RSI14 at 47.76 sits near the midpoint, and the MACD histogram has ticked slightly positive at 0.02. This reflects short-term stabilization after the recent slide toward the 52-week low. Meanwhile, pivot levels cluster tightly around 38.41 for the pivot point, 38.5 for R1, and 38.34 for S1.
Bullish Scenario for Nike Stock
A bullish turn in Nike stock requires reclaiming key short-term resistance. Price would need to recover the daily pivot at 38.47 and hold above the 1H resistance near 38.5.
On the fundamental side, some support exists. Recent valuation commentary noted that Nike stock looks undervalued on an earnings basis. In contrast, discounted cash flow analysis suggests shares are closer to fair value.
If buyers push price back above the ema20 clusters on both the daily and 1H charts, that would be an early signal. A decisively positive 1H MACD histogram would add confirmation that the corrective bounce is gaining traction. A reclaim of the daily Bollinger mid-band at 40.82 would be the more meaningful confirmation that the downtrend is losing force.
Bearish Scenario and Invalidation Levels
The more likely path, based on current evidence, favors continued downside. A break below the daily S1 at 38.14 would confirm sellers remain firmly in control. The daily RSI14 pushing below 30 would reinforce that read.
Meanwhile, news flow adds weight to this scenario. Analysts have been cutting price targets on Nike stock amid weak demand signals. Notably, Dick’s Sporting Goods’ recent warning has been flagged as a poor omen for athletic apparel names, including Nike.
Overall, this scenario simply requires the bearish alignment to persist. That is the path of least resistance given the stacked EMA structure across the higher timeframes.
Closing Thoughts on Nike Stock Positioning
Nike stock sits at a technically fragile point heading into the next session. Price trades near its lower daily Bollinger Band and at 52-week lows. Daily momentum remains tilted bearish, and the 1H timeframe confirms that broader weakness.
At the same time, short-term flattening in 1H MACD momentum and neutral 15m conditions suggest near-term consolidation before the next directional move. Given elevated ATR readings and ongoing headline risk around consumer demand and traffic softness, volatility is likely to stay elevated.
Positioning around this asset should account for the possibility of sharp intraday swings. On balance, this remains a daily downtrend that has yet to show convincing signs of exhaustion.
FAQ
What is the current trend for Nike stock?
The daily chart shows a bearish trend. Nike stock closed at 38.44, below its ema20 at 40.6, ema50 at 42.01, and ema200 at 50.05.
Where is the key support level for Nike stock?
The immediate downside level is the daily S1 at 38.14. A break below this level would confirm sellers remain in control.
What would signal a bullish reversal in Nike stock?
Bulls would need to reclaim 38.5 and push above the ema20 clusters. A reclaim of the daily Bollinger mid-band at 40.82 would confirm the downtrend is losing force.
Is Nike stock oversold right now?
Not yet on the daily timeframe. The daily RSI14 sits at 36.6, leaving room for further downside before oversold conditions below 30 appear.
Disclaimer: This article is for informational purposes only and does not constitute financial advice, an investment recommendation, or a solicitation to buy or sell any financial instrument or cryptocurrency. The analysis provided is not indicative of future results. Investing in crypto assets and financial markets carries a high risk of capital loss. Always do your own research (DYOR) and consult a qualified financial advisor before making any decision.
Article produced with the assistance of artificial intelligence and reviewed by the editorial team.
NKEUS+2.96%
53

Article
VET altcoin price potential faces its biggest test above $0.00813VET is trading near $0.0068 today, but that number tells only half the story. The token that once soared to nearly $0.28 during the last bull run remains roughly 97% below its all-time high, even as fresh technical signals are fueling talk of a dramatic long-term turnaround. Assessing VET’s altcoin price potential right now means weighing a brutal multi-year correction against chart patterns that some analysts say point toward a major structural pivot.
Key takeaways
VET trades around $0.0068, up over 5% in 24 hours, more than 31% over seven days, and about 53% over the past month, according to CoinMarketCap data.
The token remains roughly 97% below its previous all-time high of $0.2798, despite a sharp two-week rally of over 70%.
Analysts point to a macro accumulation zone and a strong reaction from a high time frame bullish order block as signs of a possible inflection point.
A sustained close above $0.00813 is being flagged as the level that would confirm a major bullish breakout.
Price projections range from a speculative 3,800% upside scenario to a more grounded 5x–11x forecast over the coming months.
VET’s Current Market Performance and Price Trends
VET is showing short-term strength while still sitting deep in negative territory compared to its cycle peak, a combination that makes its recovery story unusually layered. The token’s recent bounce contrasts sharply with its long-term underperformance, which is exactly why traders are paying closer attention now.
Trading value and short-term gains
According to CoinMarketCap analytics, VET is currently trading in the $0.0068 price range, up over 5% in the last 24 hours. The token has also gained more than 31% over the past week and roughly 53% over the past 30 days, a pace that stands out in a market where broader sentiment is being shaped by Bitcoin trading near $79,000 and Ethereum holding above $2,500. Both larger assets are seen as bullish signals for the wider market, with analysts watching for BTC to test $84,000 and ETH to approach $3,000.
Price performance relative to ATH
Despite the recent momentum, VET is still down more than 72% over the past year and remains over 97% away from its previous all-time high, meaning it failed to reclaim its old peak even during the latest bull cycle. That gap matters: it frames every current price move as part of a long recovery attempt rather than a fresh breakout from strength. Notably, VET’s price pumped over 70% in just the last two weeks, a sharp expansion that some analysts describe as the kind of move that often precedes a healthy 20-40% retracement before any further advance.
Technical Analysis Highlights Macro Accumulation Zone
Chart analysts are now describing VET as sitting inside a macro accumulation zone, a technical structure that historically precedes larger directional moves once price breaks free of it. This is the core argument behind the more optimistic read on VET’s altcoin price potential.
Reaction from high time frame bullish order block
One crypto analyst, commenting on the setup, noted that VET has “perfectly reacted from its HTF bullish order block and is now trading above a major macro accumulation zone.” That reaction is significant because it suggests buyers stepped in at a level tied to the token’s prior cycle structure. According to this analysis, the previous cycle all-time high was set at $0.2798, after which a macro correction pushed VET down 97% into an accumulation range between $0.004950 and $0.003767. VET has already shown a strong bounce from that demand zone, which the analyst frames as evidence that, after years of correction and consolidation, the token is approaching a potentially important structural inflection point.
Expert Projections and Potential Price Upside
Two very different upside scenarios are circulating for VET, and the gap between them says a lot about how speculative long-range crypto forecasting can be. One reading points to explosive gains; the other, more cautious view, still implies a multiple of the current price.
Explosive potential versus a realistic growth forecast
The bullish technical case argues that the current setup offers a clearly defined invalidation level paired with significantly larger upside if the macro breakout confirms, with some analysis pointing to an upside potential of around 3,800% from the accumulation zone. That figure is explicitly framed as a macro accumulation opportunity rather than a short-term target. A separate, more conservative view comes from another crypto expert, who put the realistic target closer to a 5x to 11x increase over the coming months. That same analyst added a note of caution, pointing out that VET “is not in a hot sector and it has a long track record of partnerships that never translated into sustained token demand.”
Breakout confirmation and possible retracement
Technically, the level to watch is $0.00813. A sustained two-week close above that price would, according to the analysis, mean a major bullish breakout for VET. That confirmation followed the token’s 70% surge over the past two weeks, and analysts note that a 20-40% retracement after such a sharp expansion would be structurally healthy rather than a warning sign, potentially setting up the next leg higher.
Why this matters: VET’s setup illustrates a broader tension playing out across altcoins that never reclaimed their prior highs — strong short-term momentum can coexist with deep structural damage, and separating genuine accumulation from a temporary bounce requires more than a single green candle. For traders tracking VET’s altcoin price potential, the $0.00813 level and the token’s response to any retracement will likely determine whether this move extends or fades.
FAQ
What is the current price and recent short-term performance of VET?
VET is currently trading around $0.0068, up over 5% in the last 24 hours and over 53% in the last 30 days.
How far is VET from its all-time high?
VET is down approximately 97% from its previous all-time high.
What technical indicators suggest potential growth for VET?
VET is in a macro accumulation zone, has reacted strongly from a high time frame bullish order block, and a close above $0.00813 could confirm a bullish breakout.
What price upside do experts predict for VET?
Experts suggest a potential explosive upside of up to 3,800%, with more realistic projections between 5x and 11x price increase over the coming months.
Article produced with the assistance of artificial intelligence and reviewed by the editorial team.
VET altcoin price potential faces its biggest test above $0.00813
VET is trading near $0.0068 today, but that number tells only half the story. The token that once soared to nearly $0.28 during the last bull run remains roughly 97% below its all-time high, even as fresh technical signals are fueling talk of a dramatic long-term turnaround. Assessing VET’s altcoin price potential right now means weighing a brutal multi-year correction against chart patterns that some analysts say point toward a major structural pivot.
Key takeaways
VET trades around $0.0068, up over 5% in 24 hours, more than 31% over seven days, and about 53% over the past month, according to CoinMarketCap data.
The token remains roughly 97% below its previous all-time high of $0.2798, despite a sharp two-week rally of over 70%.
Analysts point to a macro accumulation zone and a strong reaction from a high time frame bullish order block as signs of a possible inflection point.
A sustained close above $0.00813 is being flagged as the level that would confirm a major bullish breakout.
Price projections range from a speculative 3,800% upside scenario to a more grounded 5x–11x forecast over the coming months.
VET’s Current Market Performance and Price Trends
VET is showing short-term strength while still sitting deep in negative territory compared to its cycle peak, a combination that makes its recovery story unusually layered. The token’s recent bounce contrasts sharply with its long-term underperformance, which is exactly why traders are paying closer attention now.
Trading value and short-term gains
According to CoinMarketCap analytics, VET is currently trading in the $0.0068 price range, up over 5% in the last 24 hours. The token has also gained more than 31% over the past week and roughly 53% over the past 30 days, a pace that stands out in a market where broader sentiment is being shaped by Bitcoin trading near $79,000 and Ethereum holding above $2,500. Both larger assets are seen as bullish signals for the wider market, with analysts watching for BTC to test $84,000 and ETH to approach $3,000.
Price performance relative to ATH
Despite the recent momentum, VET is still down more than 72% over the past year and remains over 97% away from its previous all-time high, meaning it failed to reclaim its old peak even during the latest bull cycle. That gap matters: it frames every current price move as part of a long recovery attempt rather than a fresh breakout from strength. Notably, VET’s price pumped over 70% in just the last two weeks, a sharp expansion that some analysts describe as the kind of move that often precedes a healthy 20-40% retracement before any further advance.
Technical Analysis Highlights Macro Accumulation Zone
Chart analysts are now describing VET as sitting inside a macro accumulation zone, a technical structure that historically precedes larger directional moves once price breaks free of it. This is the core argument behind the more optimistic read on VET’s altcoin price potential.
Reaction from high time frame bullish order block
One crypto analyst, commenting on the setup, noted that VET has “perfectly reacted from its HTF bullish order block and is now trading above a major macro accumulation zone.” That reaction is significant because it suggests buyers stepped in at a level tied to the token’s prior cycle structure. According to this analysis, the previous cycle all-time high was set at $0.2798, after which a macro correction pushed VET down 97% into an accumulation range between $0.004950 and $0.003767. VET has already shown a strong bounce from that demand zone, which the analyst frames as evidence that, after years of correction and consolidation, the token is approaching a potentially important structural inflection point.
Expert Projections and Potential Price Upside
Two very different upside scenarios are circulating for VET, and the gap between them says a lot about how speculative long-range crypto forecasting can be. One reading points to explosive gains; the other, more cautious view, still implies a multiple of the current price.
Explosive potential versus a realistic growth forecast
The bullish technical case argues that the current setup offers a clearly defined invalidation level paired with significantly larger upside if the macro breakout confirms, with some analysis pointing to an upside potential of around 3,800% from the accumulation zone. That figure is explicitly framed as a macro accumulation opportunity rather than a short-term target. A separate, more conservative view comes from another crypto expert, who put the realistic target closer to a 5x to 11x increase over the coming months. That same analyst added a note of caution, pointing out that VET “is not in a hot sector and it has a long track record of partnerships that never translated into sustained token demand.”
Breakout confirmation and possible retracement
Technically, the level to watch is $0.00813. A sustained two-week close above that price would, according to the analysis, mean a major bullish breakout for VET. That confirmation followed the token’s 70% surge over the past two weeks, and analysts note that a 20-40% retracement after such a sharp expansion would be structurally healthy rather than a warning sign, potentially setting up the next leg higher.
Why this matters: VET’s setup illustrates a broader tension playing out across altcoins that never reclaimed their prior highs — strong short-term momentum can coexist with deep structural damage, and separating genuine accumulation from a temporary bounce requires more than a single green candle. For traders tracking VET’s altcoin price potential, the $0.00813 level and the token’s response to any retracement will likely determine whether this move extends or fades.
FAQ
What is the current price and recent short-term performance of VET?
VET is currently trading around $0.0068, up over 5% in the last 24 hours and over 53% in the last 30 days.
How far is VET from its all-time high?
VET is down approximately 97% from its previous all-time high.
What technical indicators suggest potential growth for VET?
VET is in a macro accumulation zone, has reacted strongly from a high time frame bullish order block, and a close above $0.00813 could confirm a bullish breakout.
What price upside do experts predict for VET?
Experts suggest a potential explosive upside of up to 3,800%, with more realistic projections between 5x and 11x price increase over the coming months.
Article produced with the assistance of artificial intelligence and reviewed by the editorial team.
Key takeaways
VET trades around $0.0068, up over 5% in 24 hours, more than 31% over seven days, and about 53% over the past month, according to CoinMarketCap data.
The token remains roughly 97% below its previous all-time high of $0.2798, despite a sharp two-week rally of over 70%.
Analysts point to a macro accumulation zone and a strong reaction from a high time frame bullish order block as signs of a possible inflection point.
A sustained close above $0.00813 is being flagged as the level that would confirm a major bullish breakout.
Price projections range from a speculative 3,800% upside scenario to a more grounded 5x–11x forecast over the coming months.
VET’s Current Market Performance and Price Trends
VET is showing short-term strength while still sitting deep in negative territory compared to its cycle peak, a combination that makes its recovery story unusually layered. The token’s recent bounce contrasts sharply with its long-term underperformance, which is exactly why traders are paying closer attention now.
Trading value and short-term gains
According to CoinMarketCap analytics, VET is currently trading in the $0.0068 price range, up over 5% in the last 24 hours. The token has also gained more than 31% over the past week and roughly 53% over the past 30 days, a pace that stands out in a market where broader sentiment is being shaped by Bitcoin trading near $79,000 and Ethereum holding above $2,500. Both larger assets are seen as bullish signals for the wider market, with analysts watching for BTC to test $84,000 and ETH to approach $3,000.
Price performance relative to ATH
Despite the recent momentum, VET is still down more than 72% over the past year and remains over 97% away from its previous all-time high, meaning it failed to reclaim its old peak even during the latest bull cycle. That gap matters: it frames every current price move as part of a long recovery attempt rather than a fresh breakout from strength. Notably, VET’s price pumped over 70% in just the last two weeks, a sharp expansion that some analysts describe as the kind of move that often precedes a healthy 20-40% retracement before any further advance.
Technical Analysis Highlights Macro Accumulation Zone
Chart analysts are now describing VET as sitting inside a macro accumulation zone, a technical structure that historically precedes larger directional moves once price breaks free of it. This is the core argument behind the more optimistic read on VET’s altcoin price potential.
Reaction from high time frame bullish order block
One crypto analyst, commenting on the setup, noted that VET has “perfectly reacted from its HTF bullish order block and is now trading above a major macro accumulation zone.” That reaction is significant because it suggests buyers stepped in at a level tied to the token’s prior cycle structure. According to this analysis, the previous cycle all-time high was set at $0.2798, after which a macro correction pushed VET down 97% into an accumulation range between $0.004950 and $0.003767. VET has already shown a strong bounce from that demand zone, which the analyst frames as evidence that, after years of correction and consolidation, the token is approaching a potentially important structural inflection point.
Expert Projections and Potential Price Upside
Two very different upside scenarios are circulating for VET, and the gap between them says a lot about how speculative long-range crypto forecasting can be. One reading points to explosive gains; the other, more cautious view, still implies a multiple of the current price.
Explosive potential versus a realistic growth forecast
The bullish technical case argues that the current setup offers a clearly defined invalidation level paired with significantly larger upside if the macro breakout confirms, with some analysis pointing to an upside potential of around 3,800% from the accumulation zone. That figure is explicitly framed as a macro accumulation opportunity rather than a short-term target. A separate, more conservative view comes from another crypto expert, who put the realistic target closer to a 5x to 11x increase over the coming months. That same analyst added a note of caution, pointing out that VET “is not in a hot sector and it has a long track record of partnerships that never translated into sustained token demand.”
Breakout confirmation and possible retracement
Technically, the level to watch is $0.00813. A sustained two-week close above that price would, according to the analysis, mean a major bullish breakout for VET. That confirmation followed the token’s 70% surge over the past two weeks, and analysts note that a 20-40% retracement after such a sharp expansion would be structurally healthy rather than a warning sign, potentially setting up the next leg higher.
Why this matters: VET’s setup illustrates a broader tension playing out across altcoins that never reclaimed their prior highs — strong short-term momentum can coexist with deep structural damage, and separating genuine accumulation from a temporary bounce requires more than a single green candle. For traders tracking VET’s altcoin price potential, the $0.00813 level and the token’s response to any retracement will likely determine whether this move extends or fades.
FAQ
What is the current price and recent short-term performance of VET?
VET is currently trading around $0.0068, up over 5% in the last 24 hours and over 53% in the last 30 days.
How far is VET from its all-time high?
VET is down approximately 97% from its previous all-time high.
What technical indicators suggest potential growth for VET?
VET is in a macro accumulation zone, has reacted strongly from a high time frame bullish order block, and a close above $0.00813 could confirm a bullish breakout.
What price upside do experts predict for VET?
Experts suggest a potential explosive upside of up to 3,800%, with more realistic projections between 5x and 11x price increase over the coming months.
Article produced with the assistance of artificial intelligence and reviewed by the editorial team.
95
Article
Solana Spot Trading API Taps 500M Wallets Amid Base RotationSolana just gave traders a new tool at a curious moment for its ecosystem. The blockchain rolled out a spot trading API designed to let users execute trades programmatically, bridge assets across chains, and tap into on-chain intelligence spanning hundreds of millions of wallets. The timing is notable: the launch of the Solana spot trading API lands right as so-called smart money appears to be rotating toward Base, a rival network, raising questions about where liquidity and trading activity go next.
Key takeaways
Solana has launched a spot trading API built to enhance programmatic trading and expand accessibility across its network.
The tool supports cross-chain transactions, letting users bridge assets into Solana more seamlessly.
It can query on-chain intelligence across roughly 500 million wallets, giving traders a much wider data lens.
The rollout coincides with smart money increasingly moving toward Base, a sign of shifting trading strategies across the broader ecosystem.
Analysts say the API could drive higher transaction volumes and user engagement on Solana in the coming weeks, though no hard volume data has been confirmed yet.
Solana Launches Spot Trading API to Enhance Trading
Solana’s newest release answers a simple question: how do you make trading faster and more programmatic without sacrificing the network’s reputation for high throughput and low transaction costs? The answer, according to details shared around the launch, is an API that lets traders execute transactions automatically rather than manually clicking through interfaces every time a trade needs to happen.
API Features and Capabilities
Beyond automation, the API’s standout feature is its cross-chain functionality. It supports cross-chain transactions, which means users on other blockchains can bridge into Solana more easily than before. That matters because friction at the bridging stage has long been one of the biggest deterrents for traders moving capital between ecosystems. Removing that friction, even partially, tends to open the door to new liquidity that might otherwise stay parked elsewhere.
On-Chain Intelligence Querying
The API also lets developers and traders query on-chain intelligence across 500 million wallets, a scale that gives users a far broader dataset to work from when building trading strategies or tracking wallet behavior. For a network competing to attract sophisticated trading desks and algorithmic strategies, that kind of visibility into wallet-level activity is a meaningful differentiator, not just a technical footnote.
Smart Money Movement Towards Base Signals Strategic Shift
Smart money is increasingly routing through Base, and that shift is happening at the same time Solana is trying to sharpen its own trading tools. It’s a coincidence worth watching closely, because it hints at a broader repositioning among sophisticated traders who move capital where infrastructure and opportunity look strongest.
Implications for Trading Dynamics
Why does this matter? Because when informed capital moves, it often signals where liquidity and attention are likely to follow. If Base continues absorbing smart money flows, Solana’s timing with its new API could be read as a defensive and offensive move at once — a way to keep its own trading environment competitive while other networks pull in capital. The API launch doesn’t reverse that trend on its own, but it does give Solana a fresh pitch to traders weighing where to deploy funds.
Potential Growth in Liquidity and User Engagement
The bigger opportunity lies in what happens if developers and traders actually adopt the tool. Easier Solana cross-chain trading, combined with deeper on-chain data access, could pull in liquidity that was previously sitting on the sidelines or parked on other chains. More user engagement typically follows more accessible tooling, and Solana’s ecosystem has built its reputation on exactly that kind of accessibility.
Market Implications and Future Outlook
The market’s reaction so far is mixed, not decisive. There’s no confirmed transaction volume data yet tied directly to the API’s rollout, so it’s too early to call this a turning point. Still, Solana’s proactive stance — launching new trading infrastructure rather than waiting on broader market conditions to improve — puts it in a position to capture upside if sentiment turns.
Current Market Sentiment
Solana continues to lean on its core strengths: fast settlement and cheap transactions. That foundation hasn’t changed. What has changed is the competitive pressure coming from networks like Base pulling in smart money, which forces Solana to keep innovating on the trading-infrastructure side rather than resting on raw speed alone.
Key Levels and Trader Considerations
Traders watching this story should focus less on price action and more on adoption signals. How quickly do developers integrate the new API? Does transaction activity on Solana pick up in the weeks following the rollout? Does the smart money flow toward Base slow down, accelerate, or stay roughly flat? Those answers, more than any single price chart, will determine whether this API launch marks a genuine shift in trading dynamics or simply a useful upgrade that arrived at an eventful moment.
FAQ
What is the main purpose of Solana’s new spot trading API?
The API is designed to enhance trading capabilities by enabling programmatic transactions and supporting cross-chain operations, making it easier for users to trade efficiently within Solana’s ecosystem.
How does the API support cross-chain transactions?
It allows users to bridge assets seamlessly between Solana and other blockchains, reducing the friction that typically comes with moving capital across separate networks.
What does the shift of smart money towards Base indicate?
It signals a strategic change in trading dynamics, one that could influence liquidity and user engagement across Solana’s ecosystem as capital reassesses where to flow.
What should traders monitor following the API launch?
Traders should watch transaction activity and user engagement levels closely as adoption of the API grows, since these signals will indicate whether the launch is translating into real network activity.
Article produced with the assistance of artificial intelligence and reviewed by the editorial team.
Solana Spot Trading API Taps 500M Wallets Amid Base Rotation
Solana just gave traders a new tool at a curious moment for its ecosystem. The blockchain rolled out a spot trading API designed to let users execute trades programmatically, bridge assets across chains, and tap into on-chain intelligence spanning hundreds of millions of wallets. The timing is notable: the launch of the Solana spot trading API lands right as so-called smart money appears to be rotating toward Base, a rival network, raising questions about where liquidity and trading activity go next.
Key takeaways
Solana has launched a spot trading API built to enhance programmatic trading and expand accessibility across its network.
The tool supports cross-chain transactions, letting users bridge assets into Solana more seamlessly.
It can query on-chain intelligence across roughly 500 million wallets, giving traders a much wider data lens.
The rollout coincides with smart money increasingly moving toward Base, a sign of shifting trading strategies across the broader ecosystem.
Analysts say the API could drive higher transaction volumes and user engagement on Solana in the coming weeks, though no hard volume data has been confirmed yet.
Solana Launches Spot Trading API to Enhance Trading
Solana’s newest release answers a simple question: how do you make trading faster and more programmatic without sacrificing the network’s reputation for high throughput and low transaction costs? The answer, according to details shared around the launch, is an API that lets traders execute transactions automatically rather than manually clicking through interfaces every time a trade needs to happen.
API Features and Capabilities
Beyond automation, the API’s standout feature is its cross-chain functionality. It supports cross-chain transactions, which means users on other blockchains can bridge into Solana more easily than before. That matters because friction at the bridging stage has long been one of the biggest deterrents for traders moving capital between ecosystems. Removing that friction, even partially, tends to open the door to new liquidity that might otherwise stay parked elsewhere.
On-Chain Intelligence Querying
The API also lets developers and traders query on-chain intelligence across 500 million wallets, a scale that gives users a far broader dataset to work from when building trading strategies or tracking wallet behavior. For a network competing to attract sophisticated trading desks and algorithmic strategies, that kind of visibility into wallet-level activity is a meaningful differentiator, not just a technical footnote.
Smart Money Movement Towards Base Signals Strategic Shift
Smart money is increasingly routing through Base, and that shift is happening at the same time Solana is trying to sharpen its own trading tools. It’s a coincidence worth watching closely, because it hints at a broader repositioning among sophisticated traders who move capital where infrastructure and opportunity look strongest.
Implications for Trading Dynamics
Why does this matter? Because when informed capital moves, it often signals where liquidity and attention are likely to follow. If Base continues absorbing smart money flows, Solana’s timing with its new API could be read as a defensive and offensive move at once — a way to keep its own trading environment competitive while other networks pull in capital. The API launch doesn’t reverse that trend on its own, but it does give Solana a fresh pitch to traders weighing where to deploy funds.
Potential Growth in Liquidity and User Engagement
The bigger opportunity lies in what happens if developers and traders actually adopt the tool. Easier Solana cross-chain trading, combined with deeper on-chain data access, could pull in liquidity that was previously sitting on the sidelines or parked on other chains. More user engagement typically follows more accessible tooling, and Solana’s ecosystem has built its reputation on exactly that kind of accessibility.
Market Implications and Future Outlook
The market’s reaction so far is mixed, not decisive. There’s no confirmed transaction volume data yet tied directly to the API’s rollout, so it’s too early to call this a turning point. Still, Solana’s proactive stance — launching new trading infrastructure rather than waiting on broader market conditions to improve — puts it in a position to capture upside if sentiment turns.
Current Market Sentiment
Solana continues to lean on its core strengths: fast settlement and cheap transactions. That foundation hasn’t changed. What has changed is the competitive pressure coming from networks like Base pulling in smart money, which forces Solana to keep innovating on the trading-infrastructure side rather than resting on raw speed alone.
Key Levels and Trader Considerations
Traders watching this story should focus less on price action and more on adoption signals. How quickly do developers integrate the new API? Does transaction activity on Solana pick up in the weeks following the rollout? Does the smart money flow toward Base slow down, accelerate, or stay roughly flat? Those answers, more than any single price chart, will determine whether this API launch marks a genuine shift in trading dynamics or simply a useful upgrade that arrived at an eventful moment.
FAQ
What is the main purpose of Solana’s new spot trading API?
The API is designed to enhance trading capabilities by enabling programmatic transactions and supporting cross-chain operations, making it easier for users to trade efficiently within Solana’s ecosystem.
How does the API support cross-chain transactions?
It allows users to bridge assets seamlessly between Solana and other blockchains, reducing the friction that typically comes with moving capital across separate networks.
What does the shift of smart money towards Base indicate?
It signals a strategic change in trading dynamics, one that could influence liquidity and user engagement across Solana’s ecosystem as capital reassesses where to flow.
What should traders monitor following the API launch?
Traders should watch transaction activity and user engagement levels closely as adoption of the API grows, since these signals will indicate whether the launch is translating into real network activity.
Article produced with the assistance of artificial intelligence and reviewed by the editorial team.
Key takeaways
Solana has launched a spot trading API built to enhance programmatic trading and expand accessibility across its network.
The tool supports cross-chain transactions, letting users bridge assets into Solana more seamlessly.
It can query on-chain intelligence across roughly 500 million wallets, giving traders a much wider data lens.
The rollout coincides with smart money increasingly moving toward Base, a sign of shifting trading strategies across the broader ecosystem.
Analysts say the API could drive higher transaction volumes and user engagement on Solana in the coming weeks, though no hard volume data has been confirmed yet.
Solana Launches Spot Trading API to Enhance Trading
Solana’s newest release answers a simple question: how do you make trading faster and more programmatic without sacrificing the network’s reputation for high throughput and low transaction costs? The answer, according to details shared around the launch, is an API that lets traders execute transactions automatically rather than manually clicking through interfaces every time a trade needs to happen.
API Features and Capabilities
Beyond automation, the API’s standout feature is its cross-chain functionality. It supports cross-chain transactions, which means users on other blockchains can bridge into Solana more easily than before. That matters because friction at the bridging stage has long been one of the biggest deterrents for traders moving capital between ecosystems. Removing that friction, even partially, tends to open the door to new liquidity that might otherwise stay parked elsewhere.
On-Chain Intelligence Querying
The API also lets developers and traders query on-chain intelligence across 500 million wallets, a scale that gives users a far broader dataset to work from when building trading strategies or tracking wallet behavior. For a network competing to attract sophisticated trading desks and algorithmic strategies, that kind of visibility into wallet-level activity is a meaningful differentiator, not just a technical footnote.
Smart Money Movement Towards Base Signals Strategic Shift
Smart money is increasingly routing through Base, and that shift is happening at the same time Solana is trying to sharpen its own trading tools. It’s a coincidence worth watching closely, because it hints at a broader repositioning among sophisticated traders who move capital where infrastructure and opportunity look strongest.
Implications for Trading Dynamics
Why does this matter? Because when informed capital moves, it often signals where liquidity and attention are likely to follow. If Base continues absorbing smart money flows, Solana’s timing with its new API could be read as a defensive and offensive move at once — a way to keep its own trading environment competitive while other networks pull in capital. The API launch doesn’t reverse that trend on its own, but it does give Solana a fresh pitch to traders weighing where to deploy funds.
Potential Growth in Liquidity and User Engagement
The bigger opportunity lies in what happens if developers and traders actually adopt the tool. Easier Solana cross-chain trading, combined with deeper on-chain data access, could pull in liquidity that was previously sitting on the sidelines or parked on other chains. More user engagement typically follows more accessible tooling, and Solana’s ecosystem has built its reputation on exactly that kind of accessibility.
Market Implications and Future Outlook
The market’s reaction so far is mixed, not decisive. There’s no confirmed transaction volume data yet tied directly to the API’s rollout, so it’s too early to call this a turning point. Still, Solana’s proactive stance — launching new trading infrastructure rather than waiting on broader market conditions to improve — puts it in a position to capture upside if sentiment turns.
Current Market Sentiment
Solana continues to lean on its core strengths: fast settlement and cheap transactions. That foundation hasn’t changed. What has changed is the competitive pressure coming from networks like Base pulling in smart money, which forces Solana to keep innovating on the trading-infrastructure side rather than resting on raw speed alone.
Key Levels and Trader Considerations
Traders watching this story should focus less on price action and more on adoption signals. How quickly do developers integrate the new API? Does transaction activity on Solana pick up in the weeks following the rollout? Does the smart money flow toward Base slow down, accelerate, or stay roughly flat? Those answers, more than any single price chart, will determine whether this API launch marks a genuine shift in trading dynamics or simply a useful upgrade that arrived at an eventful moment.
FAQ
What is the main purpose of Solana’s new spot trading API?
The API is designed to enhance trading capabilities by enabling programmatic transactions and supporting cross-chain operations, making it easier for users to trade efficiently within Solana’s ecosystem.
How does the API support cross-chain transactions?
It allows users to bridge assets seamlessly between Solana and other blockchains, reducing the friction that typically comes with moving capital across separate networks.
What does the shift of smart money towards Base indicate?
It signals a strategic change in trading dynamics, one that could influence liquidity and user engagement across Solana’s ecosystem as capital reassesses where to flow.
What should traders monitor following the API launch?
Traders should watch transaction activity and user engagement levels closely as adoption of the API grows, since these signals will indicate whether the launch is translating into real network activity.
Article produced with the assistance of artificial intelligence and reviewed by the editorial team.
14
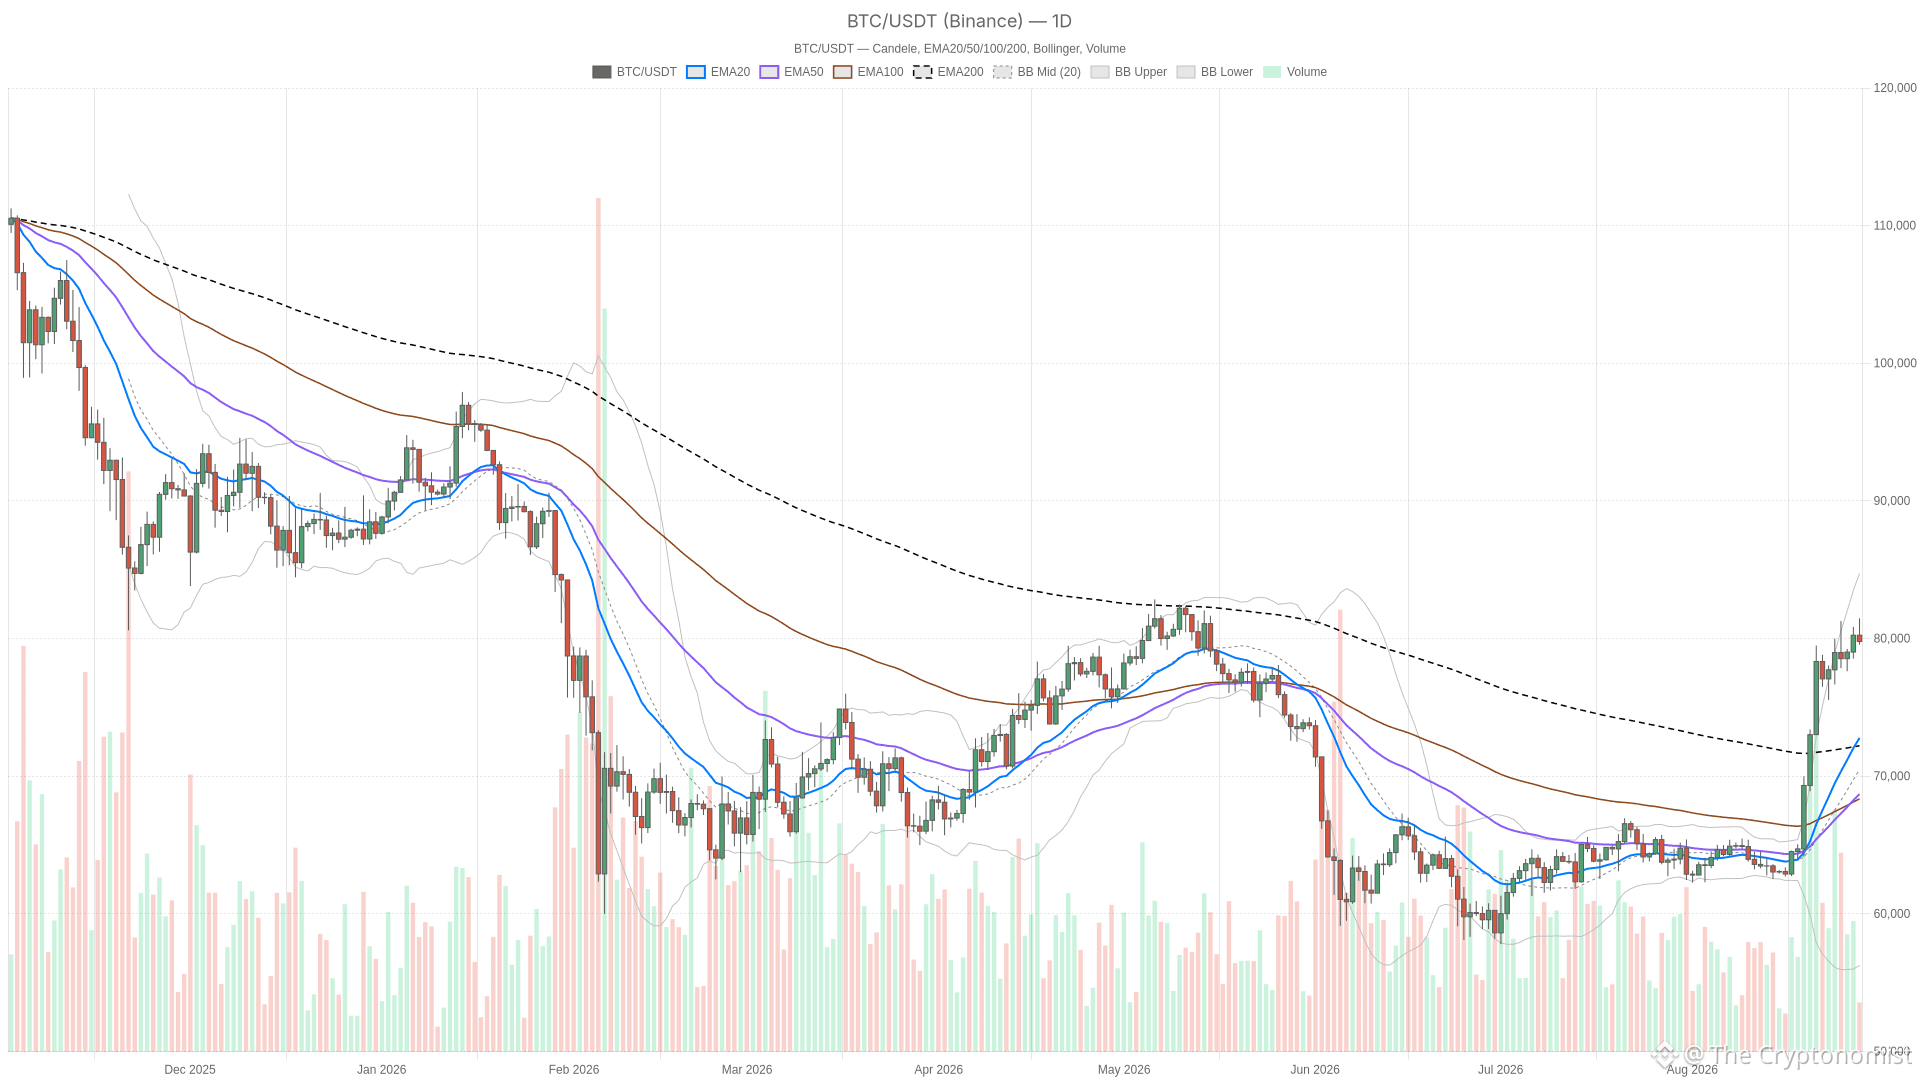
Article
Bitcoin price today stalls near $80,000 amid overbought warning signsAs of August 28, 2026, the Bitcoin price today sits at $79,789.69, just below the $80,000 mark. The daily chart shows strong momentum while shorter timeframes reveal early fatigue, creating a tense consolidation phase worth watching closely.
BTC/USDT — daily chart with candlesticks, EMA20/EMA50 and volume.
Key takeaways
Bitcoin sits at $79,789.69 on August 28, 2026, just below the $80,000 level.
The daily RSI14 reads 79.62, deep in overbought territory, while the daily MACD stays bullish.
The hourly MACD has turned mildly negative, pointing to short-term momentum fatigue.
The pivot at $80,275.56 marks the upside level, while $79,072.24 holds as key support.
The Fear & Greed Index reads 73 (‘Greed’) even as total crypto market cap fell -1.81% in 24 hours.
Why This Consolidation Matters
This consolidation matters because Bitcoin’s surge past $80,000 was fast and headline-driven. Bloomberg reported Bitcoin surging past $80,000 on fresh US ETF inflows. Earlier, BTC touched a three-month high as ‘momentum returns.’ CNBC flagged the move as the biggest 3-day rally since 2023. In other words, this is not a quiet grind. It is a rapid repricing, and rapid repricings tend to overshoot before they consolidate. That setup appears across the daily, hourly, and 15-minute charts.
Daily Chart: Bulls Are in Control, But the Tape Is Overheated
The daily chart shows bulls in control, but the tape is overheated. On the daily timeframe, the trend structure is unambiguous. Price at $79,789.69 trades well above the 20-day EMA at $72,784.37. It also sits above the 50-day EMA at $68,706 and the 200-day EMA at $72,215.59. That is a wide, expanding gap between spot and its moving averages. This kind of separation appears only during genuine trend acceleration, not routine drift.
The RSI14 backs that up loudly at 79.62, deep into overbought territory. In a healthy uptrend, RSI can stay elevated without triggering an immediate reversal. However, a reading this high warns that the move is stretched. It remains vulnerable to a sharp mean-reversion swing if buyers pause.
The MACD tells the same bullish story. The line at 4,228.89 sits well above the signal at 3,113.62, with a histogram of 1,115.28. It is wide and positive, meaning momentum is still accelerating rather than rolling over. No bearish crossover has appeared on this timeframe yet.
Bollinger Bands show the mid-line at $70,491.57. The upper band sits at $84,723.77 and the lower band at $56,259.36. Price is closer to the upper band but has not tagged it. That means there is still room to run before the daily chart hits a hard ceiling. The ATR14 at 2,719.13 confirms volatility has expanded meaningfully. Swings of a few thousand dollars are now the norm, so shallow pullbacks should not be read as trend failure.
The daily pivot structure adds nuance. The pivot point sits at $80,275.56, with R1 at $80,993 and S1 at $79,072.24. Spot price is currently just below the pivot. That puts the market in a slightly defensive posture relative to the classic pivot framework. Bulls need to reclaim $80,275.56 to fully re-assert control. Meanwhile, $79,072.24 is the line that keeps the broader uptrend intact.
Hourly Timeframe: Momentum Cools After the Vertical Move
The hourly chart shows momentum cooling after the vertical move. Zooming into the 1H chart, the picture shifts from acceleration to consolidation. Price trades between the 20-hour EMA at $79,855.85 above and the 50-hour EMA at $79,501.81 below. This is a classic pinch after a sharp rally. The 200-hour EMA at $76,515.43 remains far below, confirming the broader trend has not broken.
RSI14 on the hourly has cooled to a neutral 50.29. It has essentially wiped out the extreme reading seen on the daily. That is normal after a fast move. It simply means there is no directional edge on this timeframe alone right now.
The hourly MACD has actually flipped negative. The line at 107.2 sits below the signal at 210.31, with a histogram of -103.11. That is a mild bearish crossover, and it lines up with the Bollinger Bands. The mid-line sits at $80,062.32, with price trading below it and closer to the lower band at $79,453.21. Momentum has stalled, not reversed, but it has stalled.
ATR14 on the hourly is a modest 397.03, a fraction of the daily reading. That reinforces a period of digestion rather than distribution. The hourly pivot has PP at $79,763.23, R1 at $79,866.46, and S1 at $79,686.45. Price sits just above the pivot, boxed into a tight range while the market waits for the next catalyst.
15-Minute View: Early Signs of Stabilization
The 15-minute chart shows early signs of stabilization. This is where execution context lives. It shows the first tentative signs of a bounce attempt. Price sits below the 20-period EMA at $79,817.87 and the 50-period EMA at $79,929.4. However, it remains above the 200-period EMA at $79,635.79. That is a minor pullback sitting inside a larger sideways band.
RSI14 at 47.35 is soft but not broken. More interesting is the MACD. The line at -93.84 remains below the signal at -106.12, so no confirmed bullish cross has appeared. Still, the histogram has flipped positive at +12.29. That is often the earliest tell of a short-term reversal attempt. It is not confirmation, but it is worth watching.
Bollinger Bands are tight here. The mid-line sits at $79,762.42, the upper band at $79,943.77, and the lower band at $79,581.07. The ATR14 of 158.64 confirms volatility has compressed sharply. The 15-minute pivot point sits at $79,788, essentially where price trades right now. This is a coiled market, not a trending one, on the smallest timeframe.
Bullish and Bearish Scenarios
Two scenarios matter: a bullish reclaim above $80,275.56 or a bearish break below $79,072.24. The bullish path requires BTC to reclaim the daily pivot at $80,275.56 and push through R1 at $80,993. The hourly chart must flip back above its 20-EMA at $79,855.85. Moreover, the 15-minute MACD’s early positive tick must turn into a real breakout above the $79,943.77 upper band.
If that happens, the daily upper Bollinger Band near $84,723.77 becomes the next realistic target. Traders still cite ETF-driven demand as the fundamental driver behind the move past $80,000. What would kill this scenario is a failure to reclaim $80,275.56. Combined with a negative hourly MACD and a loss of the $79,501.81 EMA50 support, that would flip the near-term structure defensive fast.
The bearish scenario centers on the stretched daily RSI. A break below the daily S1 at $79,072.24 would be the first real technical crack. Given RSI14 at 79.62, that setup is exactly where profit-taking can accelerate into a sharper mean-reversion move. Price could fall back toward the daily 20-EMA at $72,784.37 or the Bollinger mid-line near $70,491.57.
This scenario gains credibility from the broader market backdrop. Total crypto market cap slipped -1.81% over 24 hours even as BTC dominance held near 59.24%. That combination sometimes signals capital leaving the market broadly rather than just rotating out of altcoins. What would invalidate the bearish case is a reclaim of the hourly EMA20 at $79,855.85. If the 15-minute chart also clears $79,943.77 on real volume, the path back toward $80,275 returns to the table.
Positioning, Risk, and What This Moment Really Tells Us
This moment signals a decision zone, not a broken uptrend. The Fear & Greed Index reading of 73 (‘Greed’) shows sentiment has not caught up with the hourly chart’s hesitation. Traders are still leaning bullish even as lower-timeframe momentum cools. That divergence deserves respect rather than dismissal. Total market capitalization sits around $2.697 trillion and fell -1.81% over the past day, according to CoinGecko. Meanwhile, BTC dominance remains elevated, suggesting Bitcoin is the more resilient asset within a broader market that is leaking value elsewhere.
None of this makes the next move obvious. The daily structure says the trend is intact and accelerating. The hourly says momentum has paused and mildly reversed. The 15-minute chart says the market is coiled and waiting. When timeframes disagree like this, the honest read is that BTC is in a decision zone. It is not because the uptrend is broken, but because it has stretched far enough that a pause was overdue.
Volatility, as measured by the daily ATR of 2,719.13, is elevated enough that moves in either direction could be sharp. Anyone tracking the Bitcoin price today should treat the $80,275 pivot on the upside and the $79,072 support on the downside as the two levels most likely to decide which scenario plays out first. Both directions currently carry real conviction behind them.
In short, Bitcoin is holding just below $80,000 in a high-volatility decision zone. The daily chart remains bullish but overheated, while the hourly and 15-minute charts point to a pause. The $80,275.56 pivot and the $79,072.24 support are the key levels to watch next.
FAQ
Is Bitcoin overbought right now?
Yes, the daily RSI14 reads 79.62, which is deep in overbought territory. That said, RSI can stay elevated in a healthy uptrend. The reading signals that the move is stretched and vulnerable to a sharp mean-reversion swing if buyers pause.
What are the key levels to watch for Bitcoin?
The daily pivot at $80,275.56 is the key upside level, with R1 at $80,993. On the downside, support sits at $79,072.24. A break below that level would be the first real technical crack, potentially opening a move toward the daily 20-EMA at $72,784.37.
Why has Bitcoin stalled near $80,000?
The daily chart shows a strong uptrend, but the hourly MACD has turned mildly negative and hourly RSI has cooled to 50.29. After a fast, headline-driven repricing past $80,000, the lower timeframes are showing momentum fatigue while the broader trend remains intact.
Disclaimer: This article is for informational purposes only and does not constitute financial advice, an investment recommendation, or a solicitation to buy or sell any financial instrument or cryptocurrency. The analysis provided is not indicative of future results. Investing in crypto assets and financial markets carries a high risk of capital loss. Always do your own research (DYOR) and consult a qualified financial advisor before making any decision.
Article produced with the assistance of artificial intelligence and reviewed by the editorial team.
Bitcoin price today stalls near $80,000 amid overbought warning signs
As of August 28, 2026, the Bitcoin price today sits at $79,789.69, just below the $80,000 mark. The daily chart shows strong momentum while shorter timeframes reveal early fatigue, creating a tense consolidation phase worth watching closely.
BTC/USDT — daily chart with candlesticks, EMA20/EMA50 and volume.
Key takeaways
Bitcoin sits at $79,789.69 on August 28, 2026, just below the $80,000 level.
The daily RSI14 reads 79.62, deep in overbought territory, while the daily MACD stays bullish.
The hourly MACD has turned mildly negative, pointing to short-term momentum fatigue.
The pivot at $80,275.56 marks the upside level, while $79,072.24 holds as key support.
The Fear & Greed Index reads 73 (‘Greed’) even as total crypto market cap fell -1.81% in 24 hours.
Why This Consolidation Matters
This consolidation matters because Bitcoin’s surge past $80,000 was fast and headline-driven. Bloomberg reported Bitcoin surging past $80,000 on fresh US ETF inflows. Earlier, BTC touched a three-month high as ‘momentum returns.’ CNBC flagged the move as the biggest 3-day rally since 2023. In other words, this is not a quiet grind. It is a rapid repricing, and rapid repricings tend to overshoot before they consolidate. That setup appears across the daily, hourly, and 15-minute charts.
Daily Chart: Bulls Are in Control, But the Tape Is Overheated
The daily chart shows bulls in control, but the tape is overheated. On the daily timeframe, the trend structure is unambiguous. Price at $79,789.69 trades well above the 20-day EMA at $72,784.37. It also sits above the 50-day EMA at $68,706 and the 200-day EMA at $72,215.59. That is a wide, expanding gap between spot and its moving averages. This kind of separation appears only during genuine trend acceleration, not routine drift.
The RSI14 backs that up loudly at 79.62, deep into overbought territory. In a healthy uptrend, RSI can stay elevated without triggering an immediate reversal. However, a reading this high warns that the move is stretched. It remains vulnerable to a sharp mean-reversion swing if buyers pause.
The MACD tells the same bullish story. The line at 4,228.89 sits well above the signal at 3,113.62, with a histogram of 1,115.28. It is wide and positive, meaning momentum is still accelerating rather than rolling over. No bearish crossover has appeared on this timeframe yet.
Bollinger Bands show the mid-line at $70,491.57. The upper band sits at $84,723.77 and the lower band at $56,259.36. Price is closer to the upper band but has not tagged it. That means there is still room to run before the daily chart hits a hard ceiling. The ATR14 at 2,719.13 confirms volatility has expanded meaningfully. Swings of a few thousand dollars are now the norm, so shallow pullbacks should not be read as trend failure.
The daily pivot structure adds nuance. The pivot point sits at $80,275.56, with R1 at $80,993 and S1 at $79,072.24. Spot price is currently just below the pivot. That puts the market in a slightly defensive posture relative to the classic pivot framework. Bulls need to reclaim $80,275.56 to fully re-assert control. Meanwhile, $79,072.24 is the line that keeps the broader uptrend intact.
Hourly Timeframe: Momentum Cools After the Vertical Move
The hourly chart shows momentum cooling after the vertical move. Zooming into the 1H chart, the picture shifts from acceleration to consolidation. Price trades between the 20-hour EMA at $79,855.85 above and the 50-hour EMA at $79,501.81 below. This is a classic pinch after a sharp rally. The 200-hour EMA at $76,515.43 remains far below, confirming the broader trend has not broken.
RSI14 on the hourly has cooled to a neutral 50.29. It has essentially wiped out the extreme reading seen on the daily. That is normal after a fast move. It simply means there is no directional edge on this timeframe alone right now.
The hourly MACD has actually flipped negative. The line at 107.2 sits below the signal at 210.31, with a histogram of -103.11. That is a mild bearish crossover, and it lines up with the Bollinger Bands. The mid-line sits at $80,062.32, with price trading below it and closer to the lower band at $79,453.21. Momentum has stalled, not reversed, but it has stalled.
ATR14 on the hourly is a modest 397.03, a fraction of the daily reading. That reinforces a period of digestion rather than distribution. The hourly pivot has PP at $79,763.23, R1 at $79,866.46, and S1 at $79,686.45. Price sits just above the pivot, boxed into a tight range while the market waits for the next catalyst.
15-Minute View: Early Signs of Stabilization
The 15-minute chart shows early signs of stabilization. This is where execution context lives. It shows the first tentative signs of a bounce attempt. Price sits below the 20-period EMA at $79,817.87 and the 50-period EMA at $79,929.4. However, it remains above the 200-period EMA at $79,635.79. That is a minor pullback sitting inside a larger sideways band.
RSI14 at 47.35 is soft but not broken. More interesting is the MACD. The line at -93.84 remains below the signal at -106.12, so no confirmed bullish cross has appeared. Still, the histogram has flipped positive at +12.29. That is often the earliest tell of a short-term reversal attempt. It is not confirmation, but it is worth watching.
Bollinger Bands are tight here. The mid-line sits at $79,762.42, the upper band at $79,943.77, and the lower band at $79,581.07. The ATR14 of 158.64 confirms volatility has compressed sharply. The 15-minute pivot point sits at $79,788, essentially where price trades right now. This is a coiled market, not a trending one, on the smallest timeframe.
Bullish and Bearish Scenarios
Two scenarios matter: a bullish reclaim above $80,275.56 or a bearish break below $79,072.24. The bullish path requires BTC to reclaim the daily pivot at $80,275.56 and push through R1 at $80,993. The hourly chart must flip back above its 20-EMA at $79,855.85. Moreover, the 15-minute MACD’s early positive tick must turn into a real breakout above the $79,943.77 upper band.
If that happens, the daily upper Bollinger Band near $84,723.77 becomes the next realistic target. Traders still cite ETF-driven demand as the fundamental driver behind the move past $80,000. What would kill this scenario is a failure to reclaim $80,275.56. Combined with a negative hourly MACD and a loss of the $79,501.81 EMA50 support, that would flip the near-term structure defensive fast.
The bearish scenario centers on the stretched daily RSI. A break below the daily S1 at $79,072.24 would be the first real technical crack. Given RSI14 at 79.62, that setup is exactly where profit-taking can accelerate into a sharper mean-reversion move. Price could fall back toward the daily 20-EMA at $72,784.37 or the Bollinger mid-line near $70,491.57.
This scenario gains credibility from the broader market backdrop. Total crypto market cap slipped -1.81% over 24 hours even as BTC dominance held near 59.24%. That combination sometimes signals capital leaving the market broadly rather than just rotating out of altcoins. What would invalidate the bearish case is a reclaim of the hourly EMA20 at $79,855.85. If the 15-minute chart also clears $79,943.77 on real volume, the path back toward $80,275 returns to the table.
Positioning, Risk, and What This Moment Really Tells Us
This moment signals a decision zone, not a broken uptrend. The Fear & Greed Index reading of 73 (‘Greed’) shows sentiment has not caught up with the hourly chart’s hesitation. Traders are still leaning bullish even as lower-timeframe momentum cools. That divergence deserves respect rather than dismissal. Total market capitalization sits around $2.697 trillion and fell -1.81% over the past day, according to CoinGecko. Meanwhile, BTC dominance remains elevated, suggesting Bitcoin is the more resilient asset within a broader market that is leaking value elsewhere.
None of this makes the next move obvious. The daily structure says the trend is intact and accelerating. The hourly says momentum has paused and mildly reversed. The 15-minute chart says the market is coiled and waiting. When timeframes disagree like this, the honest read is that BTC is in a decision zone. It is not because the uptrend is broken, but because it has stretched far enough that a pause was overdue.
Volatility, as measured by the daily ATR of 2,719.13, is elevated enough that moves in either direction could be sharp. Anyone tracking the Bitcoin price today should treat the $80,275 pivot on the upside and the $79,072 support on the downside as the two levels most likely to decide which scenario plays out first. Both directions currently carry real conviction behind them.
In short, Bitcoin is holding just below $80,000 in a high-volatility decision zone. The daily chart remains bullish but overheated, while the hourly and 15-minute charts point to a pause. The $80,275.56 pivot and the $79,072.24 support are the key levels to watch next.
FAQ
Is Bitcoin overbought right now?
Yes, the daily RSI14 reads 79.62, which is deep in overbought territory. That said, RSI can stay elevated in a healthy uptrend. The reading signals that the move is stretched and vulnerable to a sharp mean-reversion swing if buyers pause.
What are the key levels to watch for Bitcoin?
The daily pivot at $80,275.56 is the key upside level, with R1 at $80,993. On the downside, support sits at $79,072.24. A break below that level would be the first real technical crack, potentially opening a move toward the daily 20-EMA at $72,784.37.
Why has Bitcoin stalled near $80,000?
The daily chart shows a strong uptrend, but the hourly MACD has turned mildly negative and hourly RSI has cooled to 50.29. After a fast, headline-driven repricing past $80,000, the lower timeframes are showing momentum fatigue while the broader trend remains intact.
Disclaimer: This article is for informational purposes only and does not constitute financial advice, an investment recommendation, or a solicitation to buy or sell any financial instrument or cryptocurrency. The analysis provided is not indicative of future results. Investing in crypto assets and financial markets carries a high risk of capital loss. Always do your own research (DYOR) and consult a qualified financial advisor before making any decision.
Article produced with the assistance of artificial intelligence and reviewed by the editorial team.
BTC/USDT — daily chart with candlesticks, EMA20/EMA50 and volume.
Key takeaways
Bitcoin sits at $79,789.69 on August 28, 2026, just below the $80,000 level.
The daily RSI14 reads 79.62, deep in overbought territory, while the daily MACD stays bullish.
The hourly MACD has turned mildly negative, pointing to short-term momentum fatigue.
The pivot at $80,275.56 marks the upside level, while $79,072.24 holds as key support.
The Fear & Greed Index reads 73 (‘Greed’) even as total crypto market cap fell -1.81% in 24 hours.
Why This Consolidation Matters
This consolidation matters because Bitcoin’s surge past $80,000 was fast and headline-driven. Bloomberg reported Bitcoin surging past $80,000 on fresh US ETF inflows. Earlier, BTC touched a three-month high as ‘momentum returns.’ CNBC flagged the move as the biggest 3-day rally since 2023. In other words, this is not a quiet grind. It is a rapid repricing, and rapid repricings tend to overshoot before they consolidate. That setup appears across the daily, hourly, and 15-minute charts.
Daily Chart: Bulls Are in Control, But the Tape Is Overheated
The daily chart shows bulls in control, but the tape is overheated. On the daily timeframe, the trend structure is unambiguous. Price at $79,789.69 trades well above the 20-day EMA at $72,784.37. It also sits above the 50-day EMA at $68,706 and the 200-day EMA at $72,215.59. That is a wide, expanding gap between spot and its moving averages. This kind of separation appears only during genuine trend acceleration, not routine drift.
The RSI14 backs that up loudly at 79.62, deep into overbought territory. In a healthy uptrend, RSI can stay elevated without triggering an immediate reversal. However, a reading this high warns that the move is stretched. It remains vulnerable to a sharp mean-reversion swing if buyers pause.
The MACD tells the same bullish story. The line at 4,228.89 sits well above the signal at 3,113.62, with a histogram of 1,115.28. It is wide and positive, meaning momentum is still accelerating rather than rolling over. No bearish crossover has appeared on this timeframe yet.
Bollinger Bands show the mid-line at $70,491.57. The upper band sits at $84,723.77 and the lower band at $56,259.36. Price is closer to the upper band but has not tagged it. That means there is still room to run before the daily chart hits a hard ceiling. The ATR14 at 2,719.13 confirms volatility has expanded meaningfully. Swings of a few thousand dollars are now the norm, so shallow pullbacks should not be read as trend failure.
The daily pivot structure adds nuance. The pivot point sits at $80,275.56, with R1 at $80,993 and S1 at $79,072.24. Spot price is currently just below the pivot. That puts the market in a slightly defensive posture relative to the classic pivot framework. Bulls need to reclaim $80,275.56 to fully re-assert control. Meanwhile, $79,072.24 is the line that keeps the broader uptrend intact.
Hourly Timeframe: Momentum Cools After the Vertical Move
The hourly chart shows momentum cooling after the vertical move. Zooming into the 1H chart, the picture shifts from acceleration to consolidation. Price trades between the 20-hour EMA at $79,855.85 above and the 50-hour EMA at $79,501.81 below. This is a classic pinch after a sharp rally. The 200-hour EMA at $76,515.43 remains far below, confirming the broader trend has not broken.
RSI14 on the hourly has cooled to a neutral 50.29. It has essentially wiped out the extreme reading seen on the daily. That is normal after a fast move. It simply means there is no directional edge on this timeframe alone right now.
The hourly MACD has actually flipped negative. The line at 107.2 sits below the signal at 210.31, with a histogram of -103.11. That is a mild bearish crossover, and it lines up with the Bollinger Bands. The mid-line sits at $80,062.32, with price trading below it and closer to the lower band at $79,453.21. Momentum has stalled, not reversed, but it has stalled.
ATR14 on the hourly is a modest 397.03, a fraction of the daily reading. That reinforces a period of digestion rather than distribution. The hourly pivot has PP at $79,763.23, R1 at $79,866.46, and S1 at $79,686.45. Price sits just above the pivot, boxed into a tight range while the market waits for the next catalyst.
15-Minute View: Early Signs of Stabilization
The 15-minute chart shows early signs of stabilization. This is where execution context lives. It shows the first tentative signs of a bounce attempt. Price sits below the 20-period EMA at $79,817.87 and the 50-period EMA at $79,929.4. However, it remains above the 200-period EMA at $79,635.79. That is a minor pullback sitting inside a larger sideways band.
RSI14 at 47.35 is soft but not broken. More interesting is the MACD. The line at -93.84 remains below the signal at -106.12, so no confirmed bullish cross has appeared. Still, the histogram has flipped positive at +12.29. That is often the earliest tell of a short-term reversal attempt. It is not confirmation, but it is worth watching.
Bollinger Bands are tight here. The mid-line sits at $79,762.42, the upper band at $79,943.77, and the lower band at $79,581.07. The ATR14 of 158.64 confirms volatility has compressed sharply. The 15-minute pivot point sits at $79,788, essentially where price trades right now. This is a coiled market, not a trending one, on the smallest timeframe.
Bullish and Bearish Scenarios
Two scenarios matter: a bullish reclaim above $80,275.56 or a bearish break below $79,072.24. The bullish path requires BTC to reclaim the daily pivot at $80,275.56 and push through R1 at $80,993. The hourly chart must flip back above its 20-EMA at $79,855.85. Moreover, the 15-minute MACD’s early positive tick must turn into a real breakout above the $79,943.77 upper band.
If that happens, the daily upper Bollinger Band near $84,723.77 becomes the next realistic target. Traders still cite ETF-driven demand as the fundamental driver behind the move past $80,000. What would kill this scenario is a failure to reclaim $80,275.56. Combined with a negative hourly MACD and a loss of the $79,501.81 EMA50 support, that would flip the near-term structure defensive fast.
The bearish scenario centers on the stretched daily RSI. A break below the daily S1 at $79,072.24 would be the first real technical crack. Given RSI14 at 79.62, that setup is exactly where profit-taking can accelerate into a sharper mean-reversion move. Price could fall back toward the daily 20-EMA at $72,784.37 or the Bollinger mid-line near $70,491.57.
This scenario gains credibility from the broader market backdrop. Total crypto market cap slipped -1.81% over 24 hours even as BTC dominance held near 59.24%. That combination sometimes signals capital leaving the market broadly rather than just rotating out of altcoins. What would invalidate the bearish case is a reclaim of the hourly EMA20 at $79,855.85. If the 15-minute chart also clears $79,943.77 on real volume, the path back toward $80,275 returns to the table.
Positioning, Risk, and What This Moment Really Tells Us
This moment signals a decision zone, not a broken uptrend. The Fear & Greed Index reading of 73 (‘Greed’) shows sentiment has not caught up with the hourly chart’s hesitation. Traders are still leaning bullish even as lower-timeframe momentum cools. That divergence deserves respect rather than dismissal. Total market capitalization sits around $2.697 trillion and fell -1.81% over the past day, according to CoinGecko. Meanwhile, BTC dominance remains elevated, suggesting Bitcoin is the more resilient asset within a broader market that is leaking value elsewhere.
None of this makes the next move obvious. The daily structure says the trend is intact and accelerating. The hourly says momentum has paused and mildly reversed. The 15-minute chart says the market is coiled and waiting. When timeframes disagree like this, the honest read is that BTC is in a decision zone. It is not because the uptrend is broken, but because it has stretched far enough that a pause was overdue.
Volatility, as measured by the daily ATR of 2,719.13, is elevated enough that moves in either direction could be sharp. Anyone tracking the Bitcoin price today should treat the $80,275 pivot on the upside and the $79,072 support on the downside as the two levels most likely to decide which scenario plays out first. Both directions currently carry real conviction behind them.
In short, Bitcoin is holding just below $80,000 in a high-volatility decision zone. The daily chart remains bullish but overheated, while the hourly and 15-minute charts point to a pause. The $80,275.56 pivot and the $79,072.24 support are the key levels to watch next.
FAQ
Is Bitcoin overbought right now?
Yes, the daily RSI14 reads 79.62, which is deep in overbought territory. That said, RSI can stay elevated in a healthy uptrend. The reading signals that the move is stretched and vulnerable to a sharp mean-reversion swing if buyers pause.
What are the key levels to watch for Bitcoin?
The daily pivot at $80,275.56 is the key upside level, with R1 at $80,993. On the downside, support sits at $79,072.24. A break below that level would be the first real technical crack, potentially opening a move toward the daily 20-EMA at $72,784.37.
Why has Bitcoin stalled near $80,000?
The daily chart shows a strong uptrend, but the hourly MACD has turned mildly negative and hourly RSI has cooled to 50.29. After a fast, headline-driven repricing past $80,000, the lower timeframes are showing momentum fatigue while the broader trend remains intact.
Disclaimer: This article is for informational purposes only and does not constitute financial advice, an investment recommendation, or a solicitation to buy or sell any financial instrument or cryptocurrency. The analysis provided is not indicative of future results. Investing in crypto assets and financial markets carries a high risk of capital loss. Always do your own research (DYOR) and consult a qualified financial advisor before making any decision.
Article produced with the assistance of artificial intelligence and reviewed by the editorial team.
51
Article
Charles Schwab crypto expansion adds Solana, Avalanche and ChainlinkCharles Schwab is doubling down on digital assets. The brokerage giant has confirmed plans to add Solana, Avalanche, and Chainlink to its crypto trading platform, marking the next phase of a Charles Schwab crypto expansion that began quietly just a few months ago with only Bitcoin and Ethereum on offer. The move signals that one of Wall Street’s most traditional names is no longer content to sit on the sidelines while crypto-native platforms capture retail trading volume.
Key takeaways
Charles Schwab plans to add Solana, Avalanche, and Chainlink to its Schwab Crypto platform, expanding beyond Bitcoin and Ethereum.
Schwab Crypto launched in May 2026 and is accessible via web portal, mobile app, and the thinkorswim trading platform.
Trading fees stand at 0.75% per trade, and the service is unavailable in New York, Louisiana, US territories, and foreign markets.
Schwab now oversees $13.04 trillion in client assets across 39.9 million brokerage accounts, after posting record Q2 2026 net revenue of $7.1 billion.
Separately, Schwab is developing S&P 500-linked prediction contracts with Cboe Global Markets, though no launch date has been set for either product.
Charles Schwab Expands Cryptocurrency Offering
Charles Schwab is broadening its digital asset lineup by adding three new tokens to a platform that only recently opened its doors to crypto trading. The Charles Schwab crypto expansion will bring Solana, Avalanche, and Chainlink alongside the existing Bitcoin and Ethereum offerings within the next several months, according to the company.
Schwab Crypto launched in May 2026, giving retail investors a straightforward way to buy and sell Bitcoin and Ethereum directly through the brokerage’s existing infrastructure. Since then, users have been able to trade through Schwab’s web portal, its smartphone app, and the thinkorswim trading platform — the same tools many clients already use for stocks and options.
New Tokens and Strategic Approach
Schwab describes the addition of Solana, Avalanche, and Chainlink as a deliberate, measured move rather than a rush to compete token-for-token with crypto-native exchanges. The company has framed it as an effort to “thoughtfully expand” its crypto lineup by picking established digital currencies with clear investor demand, rather than flooding the platform with dozens of assets the way Coinbase or Robinhood do.
Joe Vietri, who heads Digital Assets at Charles Schwab, said the expansion “provides investors with additional options for constructing a digital asset portfolio while leveraging the comprehensive investment and banking services Schwab already delivers.” That framing matters: Schwab isn’t pitching itself as a crypto exchange competitor so much as a one-stop shop where digital assets sit next to stocks, bonds, and banking products under one login.
Notably, Schwab has not disclosed a rollout timeline for the three new tokens, nor has it said whether other cryptocurrencies are under consideration beyond this batch. That silence leaves open the question of how far the platform intends to grow — and how quickly.
Service Availability, Custody, and Fees
Not every Schwab client can use the new crypto features, and the ones who can will pay a flat fee on every trade. The service is available across most of the United States, but Schwab has explicitly excluded New York and Louisiana, and it remains off-limits in US territories and abroad.
Custody sits with Charles Schwab Premier Bank, which holds the crypto accounts, while the affiliated brokerage, Charles Schwab & Co., performs certain operational tasks on the bank’s behalf. That structure keeps digital assets tethered to Schwab’s regulated banking arm rather than a standalone crypto custodian, a choice that reflects the company’s broader conservative posture toward the asset class.
Trading Fees
Transaction costs on Schwab Crypto are set at 0.75% per trade — 75 basis points on the dollar value of each transaction. That fee sits above what some dedicated crypto exchanges charge active traders, which could matter for cost-conscious investors weighing Schwab against platforms built specifically for crypto. Still, for many Schwab clients, the appeal may be less about shaving basis points and more about managing crypto and traditional investments in a single place.
Financial Performance and User Scale
Schwab’s crypto push is landing at a moment when the firm’s core business is running at record scale. As of July 31, 2026, the company oversaw $13.04 trillion in total client assets spread across 39.9 million active brokerage accounts — a base large enough that even modest crypto adoption among existing clients could move meaningful volume onto the platform.
The second quarter of 2026 was Schwab’s strongest on record, with net revenue hitting $7.1 billion and net income reaching $2.8 billion. Those numbers give context to why Schwab is willing to expand into crypto and prediction markets from a position of financial strength rather than urgency — it’s diversifying products at a moment when its traditional business is already thriving, not scrambling to find new revenue.
This is where the Charles Schwab crypto expansion becomes more than a product footnote. With tens of millions of existing brokerage accounts already in place, Schwab doesn’t need to win new customers to grow crypto adoption — it just needs existing clients to click a new tab inside an app they already use. That distribution advantage is something crypto-native platforms, however feature-rich, simply cannot replicate overnight.
Upcoming S&P 500 Prediction Contracts
Crypto isn’t the only new territory Schwab is entering. The Wall Street Journal reported in June that Schwab is developing prediction contracts tied to S&P 500 performance, built through a partnership with Cboe Global Markets.
Partnership with Cboe Global Markets
These contracts would let investors bet on whether the S&P 500 closes above or below set thresholds during a trading session. Unlike Kalshi or Polymarket, which offer prediction markets across a wide range of topics, Schwab’s initial rollout is expected to stay narrowly focused on stock index outcomes rather than branching into politics, sports, or other event-driven markets.
Industry watchers expect the product to arrive within several months, but as with the new crypto tokens, Schwab has not committed to an official launch date. Taken together, the two initiatives point to a brokerage testing how far it can stretch into speculative products without straying from its core identity as a full-service financial institution.
Why does any of this matter beyond Schwab’s own balance sheet? Because a firm managing $13.04 trillion in assets moving into crypto and prediction markets — even cautiously — puts pressure on both crypto-native exchanges and other legacy brokerages to decide how aggressively they want to compete for the same retail dollars. Schwab’s approach so far favors trust and familiarity over breadth, betting that investors would rather trade five well-known tokens inside a bank-grade platform than chase dozens of coins on an exchange built purely for crypto.
FAQ
Which new cryptocurrencies will Charles Schwab add to its Schwab Crypto platform?
Charles Schwab plans to add Solana, Avalanche, and Chainlink to Schwab Crypto in the coming months, expanding beyond its current Bitcoin and Ethereum offering.
How can users access Schwab Crypto trading services?
Users can access Schwab Crypto through Schwab’s web portal, its smartphone app, and the thinkorswim trading platform.
What are the transaction fees on the Schwab Crypto platform?
The platform charges transaction fees of 0.75% per trade, equivalent to 75 basis points on the dollar value of each transaction.
Is Schwab Crypto available in all US states?
No. Schwab Crypto is available in most US states but excludes New York and Louisiana, and it is not offered in US territories or foreign markets.
What new product is Charles Schwab developing in partnership with Cboe Global Markets?
Charles Schwab is developing prediction contracts linked to S&P 500 performance in partnership with Cboe Global Markets, though no official launch date has been announced.
Article produced with the assistance of artificial intelligence and reviewed by the editorial team.
Charles Schwab crypto expansion adds Solana, Avalanche and Chainlink
Charles Schwab is doubling down on digital assets. The brokerage giant has confirmed plans to add Solana, Avalanche, and Chainlink to its crypto trading platform, marking the next phase of a Charles Schwab crypto expansion that began quietly just a few months ago with only Bitcoin and Ethereum on offer. The move signals that one of Wall Street’s most traditional names is no longer content to sit on the sidelines while crypto-native platforms capture retail trading volume.
Key takeaways
Charles Schwab plans to add Solana, Avalanche, and Chainlink to its Schwab Crypto platform, expanding beyond Bitcoin and Ethereum.
Schwab Crypto launched in May 2026 and is accessible via web portal, mobile app, and the thinkorswim trading platform.
Trading fees stand at 0.75% per trade, and the service is unavailable in New York, Louisiana, US territories, and foreign markets.
Schwab now oversees $13.04 trillion in client assets across 39.9 million brokerage accounts, after posting record Q2 2026 net revenue of $7.1 billion.
Separately, Schwab is developing S&P 500-linked prediction contracts with Cboe Global Markets, though no launch date has been set for either product.
Charles Schwab Expands Cryptocurrency Offering
Charles Schwab is broadening its digital asset lineup by adding three new tokens to a platform that only recently opened its doors to crypto trading. The Charles Schwab crypto expansion will bring Solana, Avalanche, and Chainlink alongside the existing Bitcoin and Ethereum offerings within the next several months, according to the company.
Schwab Crypto launched in May 2026, giving retail investors a straightforward way to buy and sell Bitcoin and Ethereum directly through the brokerage’s existing infrastructure. Since then, users have been able to trade through Schwab’s web portal, its smartphone app, and the thinkorswim trading platform — the same tools many clients already use for stocks and options.
New Tokens and Strategic Approach
Schwab describes the addition of Solana, Avalanche, and Chainlink as a deliberate, measured move rather than a rush to compete token-for-token with crypto-native exchanges. The company has framed it as an effort to “thoughtfully expand” its crypto lineup by picking established digital currencies with clear investor demand, rather than flooding the platform with dozens of assets the way Coinbase or Robinhood do.
Joe Vietri, who heads Digital Assets at Charles Schwab, said the expansion “provides investors with additional options for constructing a digital asset portfolio while leveraging the comprehensive investment and banking services Schwab already delivers.” That framing matters: Schwab isn’t pitching itself as a crypto exchange competitor so much as a one-stop shop where digital assets sit next to stocks, bonds, and banking products under one login.
Notably, Schwab has not disclosed a rollout timeline for the three new tokens, nor has it said whether other cryptocurrencies are under consideration beyond this batch. That silence leaves open the question of how far the platform intends to grow — and how quickly.
Service Availability, Custody, and Fees
Not every Schwab client can use the new crypto features, and the ones who can will pay a flat fee on every trade. The service is available across most of the United States, but Schwab has explicitly excluded New York and Louisiana, and it remains off-limits in US territories and abroad.
Custody sits with Charles Schwab Premier Bank, which holds the crypto accounts, while the affiliated brokerage, Charles Schwab & Co., performs certain operational tasks on the bank’s behalf. That structure keeps digital assets tethered to Schwab’s regulated banking arm rather than a standalone crypto custodian, a choice that reflects the company’s broader conservative posture toward the asset class.
Trading Fees
Transaction costs on Schwab Crypto are set at 0.75% per trade — 75 basis points on the dollar value of each transaction. That fee sits above what some dedicated crypto exchanges charge active traders, which could matter for cost-conscious investors weighing Schwab against platforms built specifically for crypto. Still, for many Schwab clients, the appeal may be less about shaving basis points and more about managing crypto and traditional investments in a single place.
Financial Performance and User Scale
Schwab’s crypto push is landing at a moment when the firm’s core business is running at record scale. As of July 31, 2026, the company oversaw $13.04 trillion in total client assets spread across 39.9 million active brokerage accounts — a base large enough that even modest crypto adoption among existing clients could move meaningful volume onto the platform.
The second quarter of 2026 was Schwab’s strongest on record, with net revenue hitting $7.1 billion and net income reaching $2.8 billion. Those numbers give context to why Schwab is willing to expand into crypto and prediction markets from a position of financial strength rather than urgency — it’s diversifying products at a moment when its traditional business is already thriving, not scrambling to find new revenue.
This is where the Charles Schwab crypto expansion becomes more than a product footnote. With tens of millions of existing brokerage accounts already in place, Schwab doesn’t need to win new customers to grow crypto adoption — it just needs existing clients to click a new tab inside an app they already use. That distribution advantage is something crypto-native platforms, however feature-rich, simply cannot replicate overnight.
Upcoming S&P 500 Prediction Contracts
Crypto isn’t the only new territory Schwab is entering. The Wall Street Journal reported in June that Schwab is developing prediction contracts tied to S&P 500 performance, built through a partnership with Cboe Global Markets.
Partnership with Cboe Global Markets
These contracts would let investors bet on whether the S&P 500 closes above or below set thresholds during a trading session. Unlike Kalshi or Polymarket, which offer prediction markets across a wide range of topics, Schwab’s initial rollout is expected to stay narrowly focused on stock index outcomes rather than branching into politics, sports, or other event-driven markets.
Industry watchers expect the product to arrive within several months, but as with the new crypto tokens, Schwab has not committed to an official launch date. Taken together, the two initiatives point to a brokerage testing how far it can stretch into speculative products without straying from its core identity as a full-service financial institution.
Why does any of this matter beyond Schwab’s own balance sheet? Because a firm managing $13.04 trillion in assets moving into crypto and prediction markets — even cautiously — puts pressure on both crypto-native exchanges and other legacy brokerages to decide how aggressively they want to compete for the same retail dollars. Schwab’s approach so far favors trust and familiarity over breadth, betting that investors would rather trade five well-known tokens inside a bank-grade platform than chase dozens of coins on an exchange built purely for crypto.
FAQ
Which new cryptocurrencies will Charles Schwab add to its Schwab Crypto platform?
Charles Schwab plans to add Solana, Avalanche, and Chainlink to Schwab Crypto in the coming months, expanding beyond its current Bitcoin and Ethereum offering.
How can users access Schwab Crypto trading services?
Users can access Schwab Crypto through Schwab’s web portal, its smartphone app, and the thinkorswim trading platform.
What are the transaction fees on the Schwab Crypto platform?
The platform charges transaction fees of 0.75% per trade, equivalent to 75 basis points on the dollar value of each transaction.
Is Schwab Crypto available in all US states?
No. Schwab Crypto is available in most US states but excludes New York and Louisiana, and it is not offered in US territories or foreign markets.
What new product is Charles Schwab developing in partnership with Cboe Global Markets?
Charles Schwab is developing prediction contracts linked to S&P 500 performance in partnership with Cboe Global Markets, though no official launch date has been announced.
Article produced with the assistance of artificial intelligence and reviewed by the editorial team.
Key takeaways
Charles Schwab plans to add Solana, Avalanche, and Chainlink to its Schwab Crypto platform, expanding beyond Bitcoin and Ethereum.
Schwab Crypto launched in May 2026 and is accessible via web portal, mobile app, and the thinkorswim trading platform.
Trading fees stand at 0.75% per trade, and the service is unavailable in New York, Louisiana, US territories, and foreign markets.
Schwab now oversees $13.04 trillion in client assets across 39.9 million brokerage accounts, after posting record Q2 2026 net revenue of $7.1 billion.
Separately, Schwab is developing S&P 500-linked prediction contracts with Cboe Global Markets, though no launch date has been set for either product.
Charles Schwab Expands Cryptocurrency Offering
Charles Schwab is broadening its digital asset lineup by adding three new tokens to a platform that only recently opened its doors to crypto trading. The Charles Schwab crypto expansion will bring Solana, Avalanche, and Chainlink alongside the existing Bitcoin and Ethereum offerings within the next several months, according to the company.
Schwab Crypto launched in May 2026, giving retail investors a straightforward way to buy and sell Bitcoin and Ethereum directly through the brokerage’s existing infrastructure. Since then, users have been able to trade through Schwab’s web portal, its smartphone app, and the thinkorswim trading platform — the same tools many clients already use for stocks and options.
New Tokens and Strategic Approach
Schwab describes the addition of Solana, Avalanche, and Chainlink as a deliberate, measured move rather than a rush to compete token-for-token with crypto-native exchanges. The company has framed it as an effort to “thoughtfully expand” its crypto lineup by picking established digital currencies with clear investor demand, rather than flooding the platform with dozens of assets the way Coinbase or Robinhood do.
Joe Vietri, who heads Digital Assets at Charles Schwab, said the expansion “provides investors with additional options for constructing a digital asset portfolio while leveraging the comprehensive investment and banking services Schwab already delivers.” That framing matters: Schwab isn’t pitching itself as a crypto exchange competitor so much as a one-stop shop where digital assets sit next to stocks, bonds, and banking products under one login.
Notably, Schwab has not disclosed a rollout timeline for the three new tokens, nor has it said whether other cryptocurrencies are under consideration beyond this batch. That silence leaves open the question of how far the platform intends to grow — and how quickly.
Service Availability, Custody, and Fees
Not every Schwab client can use the new crypto features, and the ones who can will pay a flat fee on every trade. The service is available across most of the United States, but Schwab has explicitly excluded New York and Louisiana, and it remains off-limits in US territories and abroad.
Custody sits with Charles Schwab Premier Bank, which holds the crypto accounts, while the affiliated brokerage, Charles Schwab & Co., performs certain operational tasks on the bank’s behalf. That structure keeps digital assets tethered to Schwab’s regulated banking arm rather than a standalone crypto custodian, a choice that reflects the company’s broader conservative posture toward the asset class.
Trading Fees
Transaction costs on Schwab Crypto are set at 0.75% per trade — 75 basis points on the dollar value of each transaction. That fee sits above what some dedicated crypto exchanges charge active traders, which could matter for cost-conscious investors weighing Schwab against platforms built specifically for crypto. Still, for many Schwab clients, the appeal may be less about shaving basis points and more about managing crypto and traditional investments in a single place.
Financial Performance and User Scale
Schwab’s crypto push is landing at a moment when the firm’s core business is running at record scale. As of July 31, 2026, the company oversaw $13.04 trillion in total client assets spread across 39.9 million active brokerage accounts — a base large enough that even modest crypto adoption among existing clients could move meaningful volume onto the platform.
The second quarter of 2026 was Schwab’s strongest on record, with net revenue hitting $7.1 billion and net income reaching $2.8 billion. Those numbers give context to why Schwab is willing to expand into crypto and prediction markets from a position of financial strength rather than urgency — it’s diversifying products at a moment when its traditional business is already thriving, not scrambling to find new revenue.
This is where the Charles Schwab crypto expansion becomes more than a product footnote. With tens of millions of existing brokerage accounts already in place, Schwab doesn’t need to win new customers to grow crypto adoption — it just needs existing clients to click a new tab inside an app they already use. That distribution advantage is something crypto-native platforms, however feature-rich, simply cannot replicate overnight.
Upcoming S&P 500 Prediction Contracts
Crypto isn’t the only new territory Schwab is entering. The Wall Street Journal reported in June that Schwab is developing prediction contracts tied to S&P 500 performance, built through a partnership with Cboe Global Markets.
Partnership with Cboe Global Markets
These contracts would let investors bet on whether the S&P 500 closes above or below set thresholds during a trading session. Unlike Kalshi or Polymarket, which offer prediction markets across a wide range of topics, Schwab’s initial rollout is expected to stay narrowly focused on stock index outcomes rather than branching into politics, sports, or other event-driven markets.
Industry watchers expect the product to arrive within several months, but as with the new crypto tokens, Schwab has not committed to an official launch date. Taken together, the two initiatives point to a brokerage testing how far it can stretch into speculative products without straying from its core identity as a full-service financial institution.
Why does any of this matter beyond Schwab’s own balance sheet? Because a firm managing $13.04 trillion in assets moving into crypto and prediction markets — even cautiously — puts pressure on both crypto-native exchanges and other legacy brokerages to decide how aggressively they want to compete for the same retail dollars. Schwab’s approach so far favors trust and familiarity over breadth, betting that investors would rather trade five well-known tokens inside a bank-grade platform than chase dozens of coins on an exchange built purely for crypto.
FAQ
Which new cryptocurrencies will Charles Schwab add to its Schwab Crypto platform?
Charles Schwab plans to add Solana, Avalanche, and Chainlink to Schwab Crypto in the coming months, expanding beyond its current Bitcoin and Ethereum offering.
How can users access Schwab Crypto trading services?
Users can access Schwab Crypto through Schwab’s web portal, its smartphone app, and the thinkorswim trading platform.
What are the transaction fees on the Schwab Crypto platform?
The platform charges transaction fees of 0.75% per trade, equivalent to 75 basis points on the dollar value of each transaction.
Is Schwab Crypto available in all US states?
No. Schwab Crypto is available in most US states but excludes New York and Louisiana, and it is not offered in US territories or foreign markets.
What new product is Charles Schwab developing in partnership with Cboe Global Markets?
Charles Schwab is developing prediction contracts linked to S&P 500 performance in partnership with Cboe Global Markets, though no official launch date has been announced.
Article produced with the assistance of artificial intelligence and reviewed by the editorial team.
131
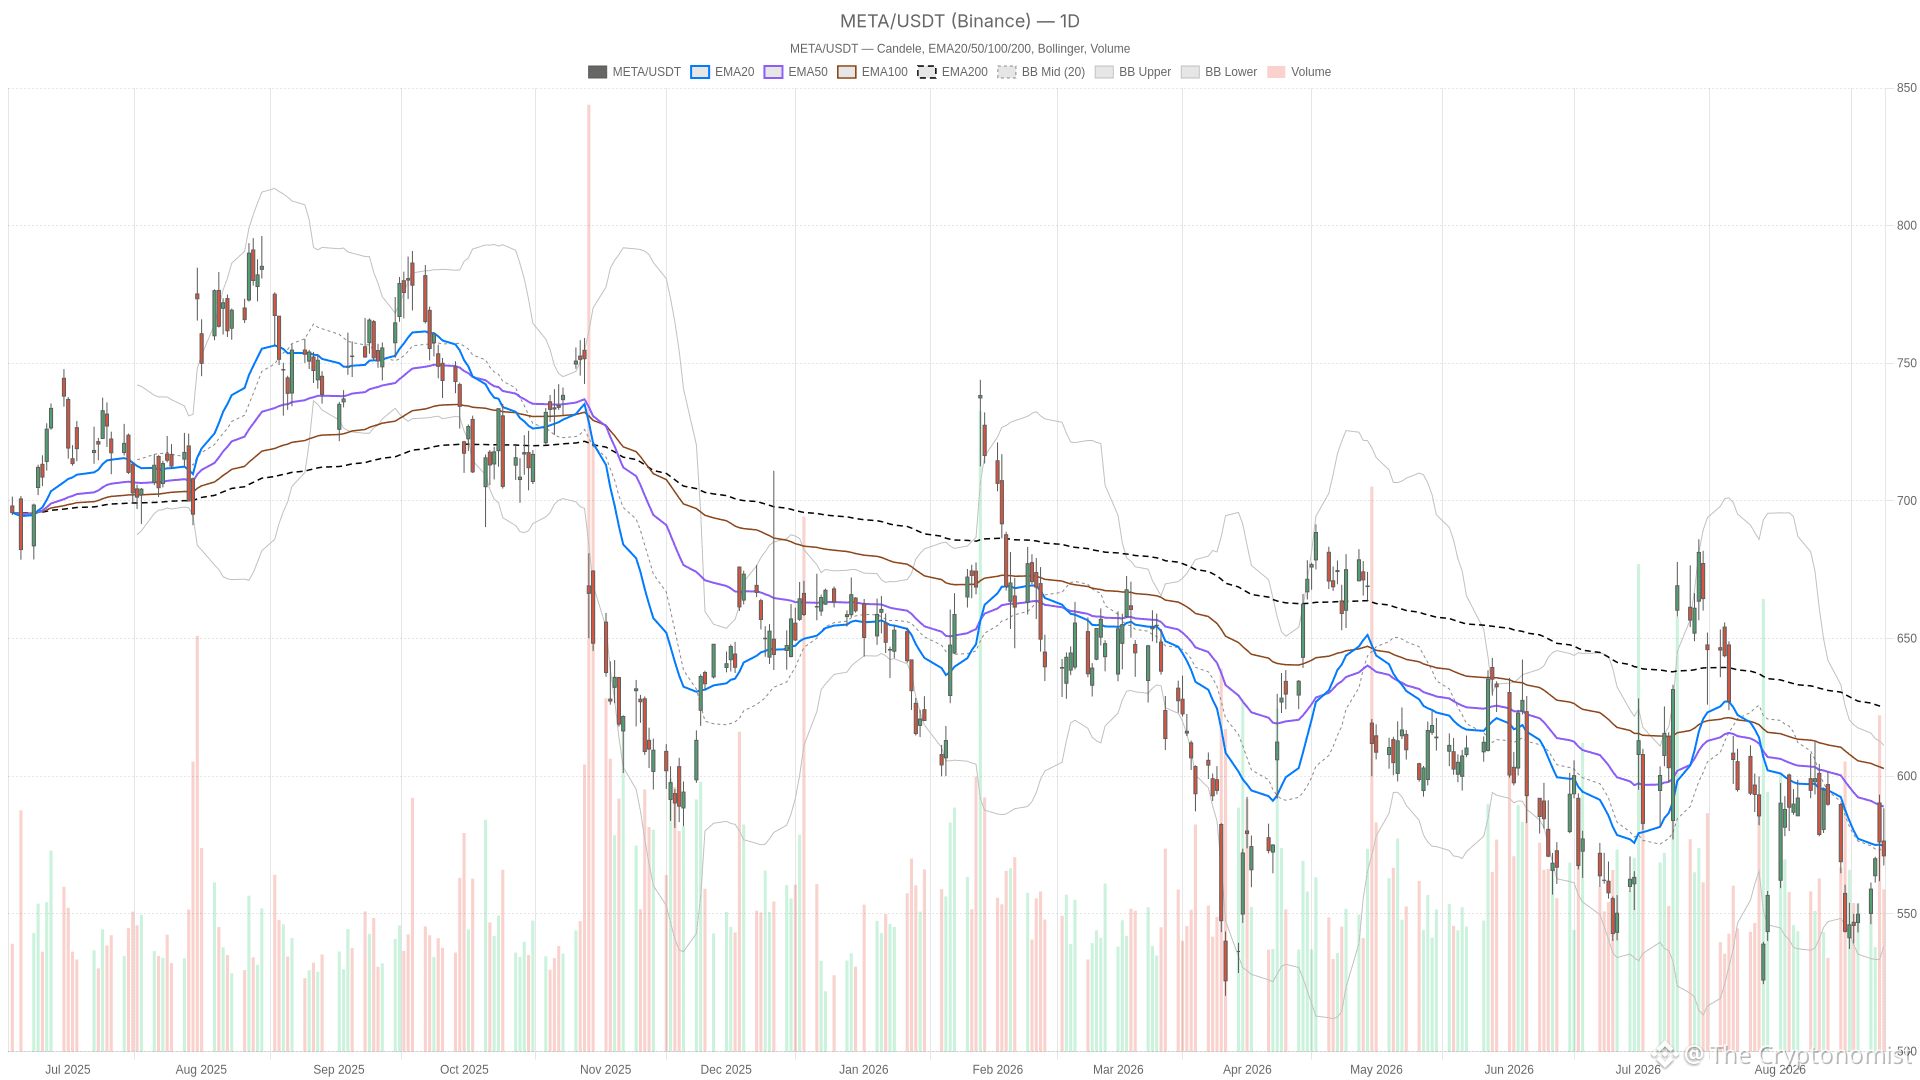
Article
Meta stock remains bearish below $571 despite $18B settlement reliefMeta stock sits at a crossroads. The daily chart still points lower, while the hourly tape tries to stabilize after a major legal overhang was removed. That tension between structure and headlines defines the current setup.
META — daily chart with candlesticks, EMA20/EMA50 and volume.
Key takeaways
META closed at 571.10, below the 20-day EMA (574.78), the 50-day EMA (588.96), and the 200-day EMA (625.00).
Daily RSI14 at 46.93 and a MACD line below zero keep the daily trend bearish, though momentum is decelerating.
Meta reached an $18 billion child-safety settlement with U.S. states, easing a key legal overhang.
Hourly charts show a mild recovery attempt, but price remains below the 200-hour EMA at 579.37.
Daily ATR14 near 18.54 signals elevated volatility, requiring disciplined positioning around key levels.
Meta Stock Price Action: Daily Trend Still Bearish
The daily trend in Meta stock remains bearish. Price still sits below all three key moving averages, and sellers stayed active into the close.
On the daily timeframe, META closed at 571.10 after printing a session high of 588.39 and a low of 567.62. The close near the lower half of that wide range shows sellers were active late. Price trades below the 20-day EMA at 574.78, the 50-day EMA at 588.96, and the 200-day EMA at 625.00. That stacked alignment, all above spot price, is a textbook bearish structure.
Momentum Signals on the Daily Chart
Momentum indicators confirm the bearish read, but they also show early signs of exhaustion. Daily RSI14 at 46.93 is neutral-to-soft rather than oversold. The MACD line sits at -9.81, with the signal at -10.75.
The MACD histogram is small and positive at 0.94. In practice, the bearish momentum of recent weeks is still in control, but it is decelerating slightly. That is an early hint of exhaustion, not a reversal signal.
Volatility and Pivot Levels
Meanwhile, daily Bollinger Bands have the midline at 574.70, the upper band at 611.27, and the lower band at 538.14. Price closing near the midline means the stock is not stretched in either direction. ATR14 at 18.54 confirms daily volatility remains elevated.
Still, swings of this size can trigger stops that would otherwise look premature. The daily pivot sits at 575.70, with resistance at 583.79 (R1) and support at 563.02 (S1). Meta stock trades below that pivot, which keeps the near-term bias tilted to sellers until the level is reclaimed.
Intraday Charts: A Fragile Recovery Attempt
Intraday charts show a fragile and incomplete recovery. The hourly tape is more constructive than the daily read, but it has not yet cleared the levels that matter.
Hourly Momentum Is Fading
On the hourly chart, price closed at 571.07, above the 20-hour EMA at 570.17 and the 50-hour EMA at 566.70. It remains below the 200-hour EMA at 579.37. Hourly RSI14 at 54.30 is mildly bullish, while the regime tag reads neutral rather than bearish. That is a meaningful divergence from the daily read.
However, the hourly MACD adds nuance rather than confirmation. The MACD line is at 3.01, above zero, but the signal sits higher at 4.24. That leaves a negative histogram of -1.23. In plain terms, upward momentum is present but fading, not accelerating.
At the same time, the hourly Bollinger midline is at 572.10, with bands at 582.64 and 561.57. Hourly ATR14 of 8.39 shows volatility has calmed compared with the daily range.
15-Minute Tape Is Consolidating
In contrast, the 15-minute tape is essentially flat. Price at 571.07 is boxed between the 20-period EMA at 571.34 and the 50-period EMA at 571.78. The 200-period EMA sits underneath at 566.35.
RSI14 at 47.23 and a nearly zero MACD histogram of 0.04 point to indecision. ATR14 has compressed to just 1.75, confirming consolidation rather than a directional move. The 15-minute pivot at 570.69, with resistance at 572.57 and support at 569.18, frames the tight execution range.
Legal Settlement Lifts a Key Overhang
The fundamental backdrop improved after Meta’s $18 billion child-safety settlement with U.S. states. In turn, that eased a significant legal overhang on the shares.
CNBC framed the settlement as a clear win for Meta Platforms. Jim Cramer went further, calling it a “big break” and describing the muted stock reaction as “ridiculous.” He argued the market underappreciated the removal of that risk.
Attention is turning toward Meta’s upcoming consumer AI agent, reportedly called Hatch. Yahoo Finance coverage suggests it could serve as a fresh catalyst for the shares. Separately, Motley Fool noted the outcome of this most recent case “was not as bad as feared.”
Bullish Scenario for Meta Stock
The bullish case requires Meta stock to reclaim the daily pivot at 575.70 and push through the 20-day EMA at 574.78. A close back above the 50-day EMA near 588.96 would be a stronger signal.
That would open the path toward R1 resistance at 583.79 and eventually higher levels. Confirmation would come from the daily MACD histogram shrinking toward a bullish crossover, alongside RSI14 pushing sustainably above 50.
On the hourly chart, a decisive close above the 200-hour EMA at 579.37 would validate the recovery. That would confirm the intraday stabilization is turning durable. The settlement news and the Hatch AI narrative offer plausible fundamental support, provided price action confirms it technically.
Bearish Scenario and What Would Invalidate the Recovery
On the other hand, the bearish case remains intact as long as Meta stock stays capped below the 20-day EMA at 574.78. It also stays capped below the pivot at 575.70. A failure to reclaim those levels would keep sellers in control.
Therefore, that risk grows if the MACD line stays below both zero and the signal line. A break below daily S1 support at 563.02 would open room toward the lower Bollinger Band at 538.14. That would confirm the broader downtrend remains dominant.
Meanwhile, on the hourly chart, losing the 569.14 pivot support would signal that the stabilization attempt has failed. A move below the lower band at 561.57 would reinforce that read. The distance between spot price and the 200-day EMA at 625.00 is a reminder that the longer-term trend has room to reassert itself.
Overall, the setup in Meta stock is one of conflicting signals rather than a clean trend. The daily chart still says bearish, while the hourly chart is attempting a mild recovery. The 15-minute tape is consolidating as the market digests the settlement news.
Daily ATR14 near 18.54 keeps volatility elevated, so positioning should account for sharp moves in either direction. The technical picture is mixed, and fresh catalysts surround the settlement and the Hatch AI launch. In that context, patience around key levels, rather than conviction in either direction, looks like the more disciplined approach.
FAQ
What is the key level Meta stock needs to reclaim for a bullish turn?
Meta stock would need to reclaim the daily pivot at 575.70 and push through the 20-day EMA at 574.78. A close back above the 50-day EMA near 588.96 would be a stronger bullish signal.
Is Meta stock’s daily trend bearish?
Yes. META closed at 571.10, below the 20-day EMA (574.78), the 50-day EMA (588.96), and the 200-day EMA (625.00). That keeps the daily structure bearish.
What legal development affected Meta stock?
Meta reached an $18 billion child-safety settlement with U.S. states, which eased a significant legal overhang. Jim Cramer called it a “big break” and described the muted stock reaction as “ridiculous.”
What support levels matter in the bearish case?
Daily S1 support at 563.02 is the first key level. A break below it would open room toward the lower Bollinger Band at 538.14.
Disclaimer: This article is for informational purposes only and does not constitute financial advice, an investment recommendation, or a solicitation to buy or sell any financial instrument or cryptocurrency. The analysis provided is not indicative of future results. Investing in crypto assets and financial markets carries a high risk of capital loss. Always do your own research (DYOR) and consult a qualified financial advisor before making any decision.
Article produced with the assistance of artificial intelligence and reviewed by the editorial team.
Meta stock remains bearish below $571 despite $18B settlement relief
Meta stock sits at a crossroads. The daily chart still points lower, while the hourly tape tries to stabilize after a major legal overhang was removed. That tension between structure and headlines defines the current setup.
META — daily chart with candlesticks, EMA20/EMA50 and volume.
Key takeaways
META closed at 571.10, below the 20-day EMA (574.78), the 50-day EMA (588.96), and the 200-day EMA (625.00).
Daily RSI14 at 46.93 and a MACD line below zero keep the daily trend bearish, though momentum is decelerating.
Meta reached an $18 billion child-safety settlement with U.S. states, easing a key legal overhang.
Hourly charts show a mild recovery attempt, but price remains below the 200-hour EMA at 579.37.
Daily ATR14 near 18.54 signals elevated volatility, requiring disciplined positioning around key levels.
Meta Stock Price Action: Daily Trend Still Bearish
The daily trend in Meta stock remains bearish. Price still sits below all three key moving averages, and sellers stayed active into the close.
On the daily timeframe, META closed at 571.10 after printing a session high of 588.39 and a low of 567.62. The close near the lower half of that wide range shows sellers were active late. Price trades below the 20-day EMA at 574.78, the 50-day EMA at 588.96, and the 200-day EMA at 625.00. That stacked alignment, all above spot price, is a textbook bearish structure.
Momentum Signals on the Daily Chart
Momentum indicators confirm the bearish read, but they also show early signs of exhaustion. Daily RSI14 at 46.93 is neutral-to-soft rather than oversold. The MACD line sits at -9.81, with the signal at -10.75.
The MACD histogram is small and positive at 0.94. In practice, the bearish momentum of recent weeks is still in control, but it is decelerating slightly. That is an early hint of exhaustion, not a reversal signal.
Volatility and Pivot Levels
Meanwhile, daily Bollinger Bands have the midline at 574.70, the upper band at 611.27, and the lower band at 538.14. Price closing near the midline means the stock is not stretched in either direction. ATR14 at 18.54 confirms daily volatility remains elevated.
Still, swings of this size can trigger stops that would otherwise look premature. The daily pivot sits at 575.70, with resistance at 583.79 (R1) and support at 563.02 (S1). Meta stock trades below that pivot, which keeps the near-term bias tilted to sellers until the level is reclaimed.
Intraday Charts: A Fragile Recovery Attempt
Intraday charts show a fragile and incomplete recovery. The hourly tape is more constructive than the daily read, but it has not yet cleared the levels that matter.
Hourly Momentum Is Fading
On the hourly chart, price closed at 571.07, above the 20-hour EMA at 570.17 and the 50-hour EMA at 566.70. It remains below the 200-hour EMA at 579.37. Hourly RSI14 at 54.30 is mildly bullish, while the regime tag reads neutral rather than bearish. That is a meaningful divergence from the daily read.
However, the hourly MACD adds nuance rather than confirmation. The MACD line is at 3.01, above zero, but the signal sits higher at 4.24. That leaves a negative histogram of -1.23. In plain terms, upward momentum is present but fading, not accelerating.
At the same time, the hourly Bollinger midline is at 572.10, with bands at 582.64 and 561.57. Hourly ATR14 of 8.39 shows volatility has calmed compared with the daily range.
15-Minute Tape Is Consolidating
In contrast, the 15-minute tape is essentially flat. Price at 571.07 is boxed between the 20-period EMA at 571.34 and the 50-period EMA at 571.78. The 200-period EMA sits underneath at 566.35.
RSI14 at 47.23 and a nearly zero MACD histogram of 0.04 point to indecision. ATR14 has compressed to just 1.75, confirming consolidation rather than a directional move. The 15-minute pivot at 570.69, with resistance at 572.57 and support at 569.18, frames the tight execution range.
Legal Settlement Lifts a Key Overhang
The fundamental backdrop improved after Meta’s $18 billion child-safety settlement with U.S. states. In turn, that eased a significant legal overhang on the shares.
CNBC framed the settlement as a clear win for Meta Platforms. Jim Cramer went further, calling it a “big break” and describing the muted stock reaction as “ridiculous.” He argued the market underappreciated the removal of that risk.
Attention is turning toward Meta’s upcoming consumer AI agent, reportedly called Hatch. Yahoo Finance coverage suggests it could serve as a fresh catalyst for the shares. Separately, Motley Fool noted the outcome of this most recent case “was not as bad as feared.”
Bullish Scenario for Meta Stock
The bullish case requires Meta stock to reclaim the daily pivot at 575.70 and push through the 20-day EMA at 574.78. A close back above the 50-day EMA near 588.96 would be a stronger signal.
That would open the path toward R1 resistance at 583.79 and eventually higher levels. Confirmation would come from the daily MACD histogram shrinking toward a bullish crossover, alongside RSI14 pushing sustainably above 50.
On the hourly chart, a decisive close above the 200-hour EMA at 579.37 would validate the recovery. That would confirm the intraday stabilization is turning durable. The settlement news and the Hatch AI narrative offer plausible fundamental support, provided price action confirms it technically.
Bearish Scenario and What Would Invalidate the Recovery
On the other hand, the bearish case remains intact as long as Meta stock stays capped below the 20-day EMA at 574.78. It also stays capped below the pivot at 575.70. A failure to reclaim those levels would keep sellers in control.
Therefore, that risk grows if the MACD line stays below both zero and the signal line. A break below daily S1 support at 563.02 would open room toward the lower Bollinger Band at 538.14. That would confirm the broader downtrend remains dominant.
Meanwhile, on the hourly chart, losing the 569.14 pivot support would signal that the stabilization attempt has failed. A move below the lower band at 561.57 would reinforce that read. The distance between spot price and the 200-day EMA at 625.00 is a reminder that the longer-term trend has room to reassert itself.
Overall, the setup in Meta stock is one of conflicting signals rather than a clean trend. The daily chart still says bearish, while the hourly chart is attempting a mild recovery. The 15-minute tape is consolidating as the market digests the settlement news.
Daily ATR14 near 18.54 keeps volatility elevated, so positioning should account for sharp moves in either direction. The technical picture is mixed, and fresh catalysts surround the settlement and the Hatch AI launch. In that context, patience around key levels, rather than conviction in either direction, looks like the more disciplined approach.
FAQ
What is the key level Meta stock needs to reclaim for a bullish turn?
Meta stock would need to reclaim the daily pivot at 575.70 and push through the 20-day EMA at 574.78. A close back above the 50-day EMA near 588.96 would be a stronger bullish signal.
Is Meta stock’s daily trend bearish?
Yes. META closed at 571.10, below the 20-day EMA (574.78), the 50-day EMA (588.96), and the 200-day EMA (625.00). That keeps the daily structure bearish.
What legal development affected Meta stock?
Meta reached an $18 billion child-safety settlement with U.S. states, which eased a significant legal overhang. Jim Cramer called it a “big break” and described the muted stock reaction as “ridiculous.”
What support levels matter in the bearish case?
Daily S1 support at 563.02 is the first key level. A break below it would open room toward the lower Bollinger Band at 538.14.
Disclaimer: This article is for informational purposes only and does not constitute financial advice, an investment recommendation, or a solicitation to buy or sell any financial instrument or cryptocurrency. The analysis provided is not indicative of future results. Investing in crypto assets and financial markets carries a high risk of capital loss. Always do your own research (DYOR) and consult a qualified financial advisor before making any decision.
Article produced with the assistance of artificial intelligence and reviewed by the editorial team.
META — daily chart with candlesticks, EMA20/EMA50 and volume.
Key takeaways
META closed at 571.10, below the 20-day EMA (574.78), the 50-day EMA (588.96), and the 200-day EMA (625.00).
Daily RSI14 at 46.93 and a MACD line below zero keep the daily trend bearish, though momentum is decelerating.
Meta reached an $18 billion child-safety settlement with U.S. states, easing a key legal overhang.
Hourly charts show a mild recovery attempt, but price remains below the 200-hour EMA at 579.37.
Daily ATR14 near 18.54 signals elevated volatility, requiring disciplined positioning around key levels.
Meta Stock Price Action: Daily Trend Still Bearish
The daily trend in Meta stock remains bearish. Price still sits below all three key moving averages, and sellers stayed active into the close.
On the daily timeframe, META closed at 571.10 after printing a session high of 588.39 and a low of 567.62. The close near the lower half of that wide range shows sellers were active late. Price trades below the 20-day EMA at 574.78, the 50-day EMA at 588.96, and the 200-day EMA at 625.00. That stacked alignment, all above spot price, is a textbook bearish structure.
Momentum Signals on the Daily Chart
Momentum indicators confirm the bearish read, but they also show early signs of exhaustion. Daily RSI14 at 46.93 is neutral-to-soft rather than oversold. The MACD line sits at -9.81, with the signal at -10.75.
The MACD histogram is small and positive at 0.94. In practice, the bearish momentum of recent weeks is still in control, but it is decelerating slightly. That is an early hint of exhaustion, not a reversal signal.
Volatility and Pivot Levels
Meanwhile, daily Bollinger Bands have the midline at 574.70, the upper band at 611.27, and the lower band at 538.14. Price closing near the midline means the stock is not stretched in either direction. ATR14 at 18.54 confirms daily volatility remains elevated.
Still, swings of this size can trigger stops that would otherwise look premature. The daily pivot sits at 575.70, with resistance at 583.79 (R1) and support at 563.02 (S1). Meta stock trades below that pivot, which keeps the near-term bias tilted to sellers until the level is reclaimed.
Intraday Charts: A Fragile Recovery Attempt
Intraday charts show a fragile and incomplete recovery. The hourly tape is more constructive than the daily read, but it has not yet cleared the levels that matter.
Hourly Momentum Is Fading
On the hourly chart, price closed at 571.07, above the 20-hour EMA at 570.17 and the 50-hour EMA at 566.70. It remains below the 200-hour EMA at 579.37. Hourly RSI14 at 54.30 is mildly bullish, while the regime tag reads neutral rather than bearish. That is a meaningful divergence from the daily read.
However, the hourly MACD adds nuance rather than confirmation. The MACD line is at 3.01, above zero, but the signal sits higher at 4.24. That leaves a negative histogram of -1.23. In plain terms, upward momentum is present but fading, not accelerating.
At the same time, the hourly Bollinger midline is at 572.10, with bands at 582.64 and 561.57. Hourly ATR14 of 8.39 shows volatility has calmed compared with the daily range.
15-Minute Tape Is Consolidating
In contrast, the 15-minute tape is essentially flat. Price at 571.07 is boxed between the 20-period EMA at 571.34 and the 50-period EMA at 571.78. The 200-period EMA sits underneath at 566.35.
RSI14 at 47.23 and a nearly zero MACD histogram of 0.04 point to indecision. ATR14 has compressed to just 1.75, confirming consolidation rather than a directional move. The 15-minute pivot at 570.69, with resistance at 572.57 and support at 569.18, frames the tight execution range.
Legal Settlement Lifts a Key Overhang
The fundamental backdrop improved after Meta’s $18 billion child-safety settlement with U.S. states. In turn, that eased a significant legal overhang on the shares.
CNBC framed the settlement as a clear win for Meta Platforms. Jim Cramer went further, calling it a “big break” and describing the muted stock reaction as “ridiculous.” He argued the market underappreciated the removal of that risk.
Attention is turning toward Meta’s upcoming consumer AI agent, reportedly called Hatch. Yahoo Finance coverage suggests it could serve as a fresh catalyst for the shares. Separately, Motley Fool noted the outcome of this most recent case “was not as bad as feared.”
Bullish Scenario for Meta Stock
The bullish case requires Meta stock to reclaim the daily pivot at 575.70 and push through the 20-day EMA at 574.78. A close back above the 50-day EMA near 588.96 would be a stronger signal.
That would open the path toward R1 resistance at 583.79 and eventually higher levels. Confirmation would come from the daily MACD histogram shrinking toward a bullish crossover, alongside RSI14 pushing sustainably above 50.
On the hourly chart, a decisive close above the 200-hour EMA at 579.37 would validate the recovery. That would confirm the intraday stabilization is turning durable. The settlement news and the Hatch AI narrative offer plausible fundamental support, provided price action confirms it technically.
Bearish Scenario and What Would Invalidate the Recovery
On the other hand, the bearish case remains intact as long as Meta stock stays capped below the 20-day EMA at 574.78. It also stays capped below the pivot at 575.70. A failure to reclaim those levels would keep sellers in control.
Therefore, that risk grows if the MACD line stays below both zero and the signal line. A break below daily S1 support at 563.02 would open room toward the lower Bollinger Band at 538.14. That would confirm the broader downtrend remains dominant.
Meanwhile, on the hourly chart, losing the 569.14 pivot support would signal that the stabilization attempt has failed. A move below the lower band at 561.57 would reinforce that read. The distance between spot price and the 200-day EMA at 625.00 is a reminder that the longer-term trend has room to reassert itself.
Overall, the setup in Meta stock is one of conflicting signals rather than a clean trend. The daily chart still says bearish, while the hourly chart is attempting a mild recovery. The 15-minute tape is consolidating as the market digests the settlement news.
Daily ATR14 near 18.54 keeps volatility elevated, so positioning should account for sharp moves in either direction. The technical picture is mixed, and fresh catalysts surround the settlement and the Hatch AI launch. In that context, patience around key levels, rather than conviction in either direction, looks like the more disciplined approach.
FAQ
What is the key level Meta stock needs to reclaim for a bullish turn?
Meta stock would need to reclaim the daily pivot at 575.70 and push through the 20-day EMA at 574.78. A close back above the 50-day EMA near 588.96 would be a stronger bullish signal.
Is Meta stock’s daily trend bearish?
Yes. META closed at 571.10, below the 20-day EMA (574.78), the 50-day EMA (588.96), and the 200-day EMA (625.00). That keeps the daily structure bearish.
What legal development affected Meta stock?
Meta reached an $18 billion child-safety settlement with U.S. states, which eased a significant legal overhang. Jim Cramer called it a “big break” and described the muted stock reaction as “ridiculous.”
What support levels matter in the bearish case?
Daily S1 support at 563.02 is the first key level. A break below it would open room toward the lower Bollinger Band at 538.14.
Disclaimer: This article is for informational purposes only and does not constitute financial advice, an investment recommendation, or a solicitation to buy or sell any financial instrument or cryptocurrency. The analysis provided is not indicative of future results. Investing in crypto assets and financial markets carries a high risk of capital loss. Always do your own research (DYOR) and consult a qualified financial advisor before making any decision.
Article produced with the assistance of artificial intelligence and reviewed by the editorial team.
12

Article
Circle Stock Nears Key Resistance at $94.57 as RSI Signals OverboughtCircle Stock is having a moment. CRCL closed at $94.24 after a crypto rally tied to a White House summit lifted sentiment. Yet price is now pressing into a major daily resistance zone. The technical picture across timeframes is not as unanimous as the headlines suggest.
CRCL — daily chart with candlesticks, EMA20/EMA50 and volume.
Key takeaways
CRCL closed at $94.24, up from a $90.36 intraday low, after a crypto rally lifted sector sentiment.
The daily RSI14 at 71.64 signals overbought conditions as price tests the 94.57–96.87 resistance cluster.
Hourly and 15-minute momentum is fading, with the 15-minute MACD histogram negative at -0.22.
Daily ATR14 at 5.98 points to nearly $6 average swings, keeping volatility elevated.
CRCL remains down more than 70% from its all-time high and 33% over the past year.
Circle Stock Daily Trend: Overbought Strength Meets a Wall
The daily trend is steeply bullish, yet price has run straight into a major resistance wall. CRCL’s 20-day EMA sits at 78.66 and the 50-day EMA at 76.51. That means price is trading well above both, signaling a fast, aggressive move rather than a slow grind higher. The real battleground is the 200-day EMA at 94.57. Wednesday’s close of $94.24 landed just beneath it. As a result, the stock is knocking on the door of a long-term resistance level it has not yet reclaimed on a closing basis.
Momentum and Volatility Readings
Momentum backs the bullish case, at least for now. The daily RSI14 reads 71.64, comfortably in overbought territory. MACD is firmly positive, with the line at 6.18 versus a signal of 3.6 and a histogram of 2.58. That is a strong bullish reading. However, an RSI above 70 also flags stretched conditions. These are the levels where rallies often pause or digest sideways before continuing.
The Bollinger setup tells a similar story. The mid-band sits at 74.82, the upper band at 96.1, and price is riding right near that upper boundary. Combined with a daily pivot resistance (R1) at 96.87, there is a tight cluster of resistance between roughly 94.57 and 96.87. That 94.57–96.87 resistance cluster is the level bulls need to clear convincingly. Daily ATR14 stands at 5.98. That means average daily swings of nearly six dollars, so this is a genuinely volatile name right now. Notably, the system still tags the daily regime as “neutral.” That likely reflects the fact that price has not yet closed above the 200-EMA, leaving the broader trend context unresolved.
Hourly Chart Confirms the Uptrend, But Momentum Is Fading
The 1-hour chart still confirms an uptrend, but momentum is fading right at resistance. Price at 94.23 sits above all three EMAs: 91.91 (20-period), 87.44 (50-period), and 75.75 (200-period). That clean bullish alignment confirms the intraday uptrend. RSI14 at 62.61 is bullish without being overextended, leaving room before hourly conditions get stretched.
At the same time, MACD on the hourly is telling a more cautious story. The line sits at 1.95 versus a signal of 1.92, with a histogram of just 0.03 — essentially flat. That is a sign of decelerating momentum right at the resistance zone identified on the daily chart. In other words, the trend structure is intact, but the fuel behind it is thinning exactly where it matters most. The hourly pivot point at 94.25 is basically where price is trading, underscoring a market in indecision at this exact level.
15-Minute View: Short-Term Pullback Inside the Bigger Trend
The 15-minute chart shows a short-term pullback within a still-bullish bigger trend. Price at 94.23 sits just above its 20-period EMA of 94.13. It also holds above the 50-period EMA of 92.9. That is still a bullish short-term structure, but a tight one. RSI14 at 53.68 is neutral, offering no clear directional edge on this timeframe.
More notably, the 15-minute MACD histogram has flipped negative at -0.22, conflicting with the bullish readings on the daily and hourly charts. This points to a short-term pullback or consolidation phase within the broader uptrend rather than a trend reversal. Price is also trading below the 15-minute Bollinger mid-band of 94.7, closer to the lower portion of the range near 93.32. For execution purposes, the intraday pivot support at 94.07 is the level to watch for signs of the pullback stabilizing.
Bullish Scenario for Circle Stock
The bullish case depends on a clean break above the 94.57–96.87 resistance cluster. That is where the 200-day EMA, the upper Bollinger Band, and the daily R1 pivot all converge. A confirmed close above that zone, ideally on strong volume, would represent meaningful technical validation of the recent rally. This would align with the more optimistic analyst calls in the news flow. Bernstein has flagged 60% upside potential, while another analyst has pointed to as much as 75% surge potential. Cathie Wood has also continued to call Circle a “disrupter”. She argues the stock’s recent weakness reflects short-term market inefficiency rather than a broken thesis. For the bullish scenario to hold on lower timeframes, hourly price needs to stay above its 20-EMA at 91.91. Losing that level would undercut the intraday bullish regime even if the daily trend stays intact.
Bearish Scenario and What Would Invalidate the Rally
On the other hand, the bearish case rests on a rejection at resistance while momentum fades. The overbought daily RSI at 71.64 is a legitimate warning sign. It combines with a fading hourly MACD and an already-negative 15-minute MACD histogram. A rejection at the 94.57–96.87 resistance zone could trigger a retreat toward the daily S1 pivot at 90.99. That level lines up closely with the prior session’s low of 90.36. A deeper pullback would put the daily EMA20 near 78.66 back into focus over a longer horizon. The bigger picture also matters. CRCL is still down more than 70% from its all-time high and down 33% over the past year, according to recent reporting. That context matters. This rally needs to prove itself as a genuine trend shift, not simply be assumed as one.
Closing Take on Circle Stock
Circle Stock is at a genuine inflection point between overbought strength and fading momentum. The daily trend is strong and momentum has been undeniably bullish. Still, price is testing serious resistance exactly where RSI is overbought and hourly momentum is flattening. Meanwhile, the 15-minute chart shows the market already digesting some of that strength through a short-term pullback. Given the daily ATR near six dollars, volatility is elevated. The reaction at the 94.57–96.87 zone in the sessions ahead should be the key tell. Positioning here calls for patience rather than conviction in either direction, given how mixed the signals are across timeframes right now.
FAQ
What is the key resistance level for Circle Stock (CRCL)?
The key resistance cluster sits between 94.57 and 96.87. It includes the 200-day EMA at 94.57, the daily upper Bollinger Band at 96.1, and the daily R1 pivot at 96.87.
Is Circle Stock overbought right now?
On the daily chart, yes. The daily RSI14 reads 71.64, above the 70 overbought threshold, while MACD remains positive with a histogram of 2.58.
What would invalidate the bullish case?
A rejection at the 94.57–96.87 zone could send price toward the daily S1 pivot at 90.99, near the prior session low of 90.36. Losing the hourly 20-period EMA at 91.91 would also undercut the intraday bullish regime.
How far is CRCL from its all-time high?
CRCL is still down more than 70% from its all-time high and down 33% over the past year, according to recent reporting.
Disclaimer: This article is for informational purposes only and does not constitute financial advice, an investment recommendation, or a solicitation to buy or sell any financial instrument or cryptocurrency. The analysis provided is not indicative of future results. Investing in crypto assets and financial markets carries a high risk of capital loss. Always do your own research (DYOR) and consult a qualified financial advisor before making any decision.
Article produced with the assistance of artificial intelligence and reviewed by the editorial team.
Circle Stock Nears Key Resistance at $94.57 as RSI Signals Overbought
Circle Stock is having a moment. CRCL closed at $94.24 after a crypto rally tied to a White House summit lifted sentiment. Yet price is now pressing into a major daily resistance zone. The technical picture across timeframes is not as unanimous as the headlines suggest.
CRCL — daily chart with candlesticks, EMA20/EMA50 and volume.
Key takeaways
CRCL closed at $94.24, up from a $90.36 intraday low, after a crypto rally lifted sector sentiment.
The daily RSI14 at 71.64 signals overbought conditions as price tests the 94.57–96.87 resistance cluster.
Hourly and 15-minute momentum is fading, with the 15-minute MACD histogram negative at -0.22.
Daily ATR14 at 5.98 points to nearly $6 average swings, keeping volatility elevated.
CRCL remains down more than 70% from its all-time high and 33% over the past year.
Circle Stock Daily Trend: Overbought Strength Meets a Wall
The daily trend is steeply bullish, yet price has run straight into a major resistance wall. CRCL’s 20-day EMA sits at 78.66 and the 50-day EMA at 76.51. That means price is trading well above both, signaling a fast, aggressive move rather than a slow grind higher. The real battleground is the 200-day EMA at 94.57. Wednesday’s close of $94.24 landed just beneath it. As a result, the stock is knocking on the door of a long-term resistance level it has not yet reclaimed on a closing basis.
Momentum and Volatility Readings
Momentum backs the bullish case, at least for now. The daily RSI14 reads 71.64, comfortably in overbought territory. MACD is firmly positive, with the line at 6.18 versus a signal of 3.6 and a histogram of 2.58. That is a strong bullish reading. However, an RSI above 70 also flags stretched conditions. These are the levels where rallies often pause or digest sideways before continuing.
The Bollinger setup tells a similar story. The mid-band sits at 74.82, the upper band at 96.1, and price is riding right near that upper boundary. Combined with a daily pivot resistance (R1) at 96.87, there is a tight cluster of resistance between roughly 94.57 and 96.87. That 94.57–96.87 resistance cluster is the level bulls need to clear convincingly. Daily ATR14 stands at 5.98. That means average daily swings of nearly six dollars, so this is a genuinely volatile name right now. Notably, the system still tags the daily regime as “neutral.” That likely reflects the fact that price has not yet closed above the 200-EMA, leaving the broader trend context unresolved.
Hourly Chart Confirms the Uptrend, But Momentum Is Fading
The 1-hour chart still confirms an uptrend, but momentum is fading right at resistance. Price at 94.23 sits above all three EMAs: 91.91 (20-period), 87.44 (50-period), and 75.75 (200-period). That clean bullish alignment confirms the intraday uptrend. RSI14 at 62.61 is bullish without being overextended, leaving room before hourly conditions get stretched.
At the same time, MACD on the hourly is telling a more cautious story. The line sits at 1.95 versus a signal of 1.92, with a histogram of just 0.03 — essentially flat. That is a sign of decelerating momentum right at the resistance zone identified on the daily chart. In other words, the trend structure is intact, but the fuel behind it is thinning exactly where it matters most. The hourly pivot point at 94.25 is basically where price is trading, underscoring a market in indecision at this exact level.
15-Minute View: Short-Term Pullback Inside the Bigger Trend
The 15-minute chart shows a short-term pullback within a still-bullish bigger trend. Price at 94.23 sits just above its 20-period EMA of 94.13. It also holds above the 50-period EMA of 92.9. That is still a bullish short-term structure, but a tight one. RSI14 at 53.68 is neutral, offering no clear directional edge on this timeframe.
More notably, the 15-minute MACD histogram has flipped negative at -0.22, conflicting with the bullish readings on the daily and hourly charts. This points to a short-term pullback or consolidation phase within the broader uptrend rather than a trend reversal. Price is also trading below the 15-minute Bollinger mid-band of 94.7, closer to the lower portion of the range near 93.32. For execution purposes, the intraday pivot support at 94.07 is the level to watch for signs of the pullback stabilizing.
Bullish Scenario for Circle Stock
The bullish case depends on a clean break above the 94.57–96.87 resistance cluster. That is where the 200-day EMA, the upper Bollinger Band, and the daily R1 pivot all converge. A confirmed close above that zone, ideally on strong volume, would represent meaningful technical validation of the recent rally. This would align with the more optimistic analyst calls in the news flow. Bernstein has flagged 60% upside potential, while another analyst has pointed to as much as 75% surge potential. Cathie Wood has also continued to call Circle a “disrupter”. She argues the stock’s recent weakness reflects short-term market inefficiency rather than a broken thesis. For the bullish scenario to hold on lower timeframes, hourly price needs to stay above its 20-EMA at 91.91. Losing that level would undercut the intraday bullish regime even if the daily trend stays intact.
Bearish Scenario and What Would Invalidate the Rally
On the other hand, the bearish case rests on a rejection at resistance while momentum fades. The overbought daily RSI at 71.64 is a legitimate warning sign. It combines with a fading hourly MACD and an already-negative 15-minute MACD histogram. A rejection at the 94.57–96.87 resistance zone could trigger a retreat toward the daily S1 pivot at 90.99. That level lines up closely with the prior session’s low of 90.36. A deeper pullback would put the daily EMA20 near 78.66 back into focus over a longer horizon. The bigger picture also matters. CRCL is still down more than 70% from its all-time high and down 33% over the past year, according to recent reporting. That context matters. This rally needs to prove itself as a genuine trend shift, not simply be assumed as one.
Closing Take on Circle Stock
Circle Stock is at a genuine inflection point between overbought strength and fading momentum. The daily trend is strong and momentum has been undeniably bullish. Still, price is testing serious resistance exactly where RSI is overbought and hourly momentum is flattening. Meanwhile, the 15-minute chart shows the market already digesting some of that strength through a short-term pullback. Given the daily ATR near six dollars, volatility is elevated. The reaction at the 94.57–96.87 zone in the sessions ahead should be the key tell. Positioning here calls for patience rather than conviction in either direction, given how mixed the signals are across timeframes right now.
FAQ
What is the key resistance level for Circle Stock (CRCL)?
The key resistance cluster sits between 94.57 and 96.87. It includes the 200-day EMA at 94.57, the daily upper Bollinger Band at 96.1, and the daily R1 pivot at 96.87.
Is Circle Stock overbought right now?
On the daily chart, yes. The daily RSI14 reads 71.64, above the 70 overbought threshold, while MACD remains positive with a histogram of 2.58.
What would invalidate the bullish case?
A rejection at the 94.57–96.87 zone could send price toward the daily S1 pivot at 90.99, near the prior session low of 90.36. Losing the hourly 20-period EMA at 91.91 would also undercut the intraday bullish regime.
How far is CRCL from its all-time high?
CRCL is still down more than 70% from its all-time high and down 33% over the past year, according to recent reporting.
Disclaimer: This article is for informational purposes only and does not constitute financial advice, an investment recommendation, or a solicitation to buy or sell any financial instrument or cryptocurrency. The analysis provided is not indicative of future results. Investing in crypto assets and financial markets carries a high risk of capital loss. Always do your own research (DYOR) and consult a qualified financial advisor before making any decision.
Article produced with the assistance of artificial intelligence and reviewed by the editorial team.
CRCL — daily chart with candlesticks, EMA20/EMA50 and volume.
Key takeaways
CRCL closed at $94.24, up from a $90.36 intraday low, after a crypto rally lifted sector sentiment.
The daily RSI14 at 71.64 signals overbought conditions as price tests the 94.57–96.87 resistance cluster.
Hourly and 15-minute momentum is fading, with the 15-minute MACD histogram negative at -0.22.
Daily ATR14 at 5.98 points to nearly $6 average swings, keeping volatility elevated.
CRCL remains down more than 70% from its all-time high and 33% over the past year.
Circle Stock Daily Trend: Overbought Strength Meets a Wall
The daily trend is steeply bullish, yet price has run straight into a major resistance wall. CRCL’s 20-day EMA sits at 78.66 and the 50-day EMA at 76.51. That means price is trading well above both, signaling a fast, aggressive move rather than a slow grind higher. The real battleground is the 200-day EMA at 94.57. Wednesday’s close of $94.24 landed just beneath it. As a result, the stock is knocking on the door of a long-term resistance level it has not yet reclaimed on a closing basis.
Momentum and Volatility Readings
Momentum backs the bullish case, at least for now. The daily RSI14 reads 71.64, comfortably in overbought territory. MACD is firmly positive, with the line at 6.18 versus a signal of 3.6 and a histogram of 2.58. That is a strong bullish reading. However, an RSI above 70 also flags stretched conditions. These are the levels where rallies often pause or digest sideways before continuing.
The Bollinger setup tells a similar story. The mid-band sits at 74.82, the upper band at 96.1, and price is riding right near that upper boundary. Combined with a daily pivot resistance (R1) at 96.87, there is a tight cluster of resistance between roughly 94.57 and 96.87. That 94.57–96.87 resistance cluster is the level bulls need to clear convincingly. Daily ATR14 stands at 5.98. That means average daily swings of nearly six dollars, so this is a genuinely volatile name right now. Notably, the system still tags the daily regime as “neutral.” That likely reflects the fact that price has not yet closed above the 200-EMA, leaving the broader trend context unresolved.
Hourly Chart Confirms the Uptrend, But Momentum Is Fading
The 1-hour chart still confirms an uptrend, but momentum is fading right at resistance. Price at 94.23 sits above all three EMAs: 91.91 (20-period), 87.44 (50-period), and 75.75 (200-period). That clean bullish alignment confirms the intraday uptrend. RSI14 at 62.61 is bullish without being overextended, leaving room before hourly conditions get stretched.
At the same time, MACD on the hourly is telling a more cautious story. The line sits at 1.95 versus a signal of 1.92, with a histogram of just 0.03 — essentially flat. That is a sign of decelerating momentum right at the resistance zone identified on the daily chart. In other words, the trend structure is intact, but the fuel behind it is thinning exactly where it matters most. The hourly pivot point at 94.25 is basically where price is trading, underscoring a market in indecision at this exact level.
15-Minute View: Short-Term Pullback Inside the Bigger Trend
The 15-minute chart shows a short-term pullback within a still-bullish bigger trend. Price at 94.23 sits just above its 20-period EMA of 94.13. It also holds above the 50-period EMA of 92.9. That is still a bullish short-term structure, but a tight one. RSI14 at 53.68 is neutral, offering no clear directional edge on this timeframe.
More notably, the 15-minute MACD histogram has flipped negative at -0.22, conflicting with the bullish readings on the daily and hourly charts. This points to a short-term pullback or consolidation phase within the broader uptrend rather than a trend reversal. Price is also trading below the 15-minute Bollinger mid-band of 94.7, closer to the lower portion of the range near 93.32. For execution purposes, the intraday pivot support at 94.07 is the level to watch for signs of the pullback stabilizing.
Bullish Scenario for Circle Stock
The bullish case depends on a clean break above the 94.57–96.87 resistance cluster. That is where the 200-day EMA, the upper Bollinger Band, and the daily R1 pivot all converge. A confirmed close above that zone, ideally on strong volume, would represent meaningful technical validation of the recent rally. This would align with the more optimistic analyst calls in the news flow. Bernstein has flagged 60% upside potential, while another analyst has pointed to as much as 75% surge potential. Cathie Wood has also continued to call Circle a “disrupter”. She argues the stock’s recent weakness reflects short-term market inefficiency rather than a broken thesis. For the bullish scenario to hold on lower timeframes, hourly price needs to stay above its 20-EMA at 91.91. Losing that level would undercut the intraday bullish regime even if the daily trend stays intact.
Bearish Scenario and What Would Invalidate the Rally
On the other hand, the bearish case rests on a rejection at resistance while momentum fades. The overbought daily RSI at 71.64 is a legitimate warning sign. It combines with a fading hourly MACD and an already-negative 15-minute MACD histogram. A rejection at the 94.57–96.87 resistance zone could trigger a retreat toward the daily S1 pivot at 90.99. That level lines up closely with the prior session’s low of 90.36. A deeper pullback would put the daily EMA20 near 78.66 back into focus over a longer horizon. The bigger picture also matters. CRCL is still down more than 70% from its all-time high and down 33% over the past year, according to recent reporting. That context matters. This rally needs to prove itself as a genuine trend shift, not simply be assumed as one.
Closing Take on Circle Stock
Circle Stock is at a genuine inflection point between overbought strength and fading momentum. The daily trend is strong and momentum has been undeniably bullish. Still, price is testing serious resistance exactly where RSI is overbought and hourly momentum is flattening. Meanwhile, the 15-minute chart shows the market already digesting some of that strength through a short-term pullback. Given the daily ATR near six dollars, volatility is elevated. The reaction at the 94.57–96.87 zone in the sessions ahead should be the key tell. Positioning here calls for patience rather than conviction in either direction, given how mixed the signals are across timeframes right now.
FAQ
What is the key resistance level for Circle Stock (CRCL)?
The key resistance cluster sits between 94.57 and 96.87. It includes the 200-day EMA at 94.57, the daily upper Bollinger Band at 96.1, and the daily R1 pivot at 96.87.
Is Circle Stock overbought right now?
On the daily chart, yes. The daily RSI14 reads 71.64, above the 70 overbought threshold, while MACD remains positive with a histogram of 2.58.
What would invalidate the bullish case?
A rejection at the 94.57–96.87 zone could send price toward the daily S1 pivot at 90.99, near the prior session low of 90.36. Losing the hourly 20-period EMA at 91.91 would also undercut the intraday bullish regime.
How far is CRCL from its all-time high?
CRCL is still down more than 70% from its all-time high and down 33% over the past year, according to recent reporting.
Disclaimer: This article is for informational purposes only and does not constitute financial advice, an investment recommendation, or a solicitation to buy or sell any financial instrument or cryptocurrency. The analysis provided is not indicative of future results. Investing in crypto assets and financial markets carries a high risk of capital loss. Always do your own research (DYOR) and consult a qualified financial advisor before making any decision.
Article produced with the assistance of artificial intelligence and reviewed by the editorial team.
32

Article
Ethereum price today: ETH holds near $2,500 despite overbought RSI signalAs of August 28, 2026, Ethereum price today sits at $2,496.23, caught between a bullish daily chart and short-term charts losing steam. Total market capitalization slipped 1.59% over 24 hours to roughly $2.69 trillion, according to CoinGecko, while Bitcoin dominance climbed to 59.22%.
ETH/USDT — daily chart with candlesticks, EMA20/EMA50 and volume.
Key takeaways
ETH trades at $2,496.23 on August 28, 2026, above its daily EMA20, EMA50, and EMA200.
The daily RSI sits at 75.79 in overbought territory, while the Fear & Greed Index reads 73.
Total crypto market capitalization fell 1.59% in 24 hours to about $2.69 trillion, and Bitcoin dominance rose to 59.22%.
Hourly and 15-minute charts show consolidation, with ETH holding near the 2502.92 daily pivot.
Uniswap V4 fees jumped 127.54% in a day, while Curve DEX fees dropped 72.6% in 24 hours.
Daily Trend Still Points Up, But Momentum Is Overheating
The daily trend remains bullish: ETH trades above all three major EMAs — 2249.06 (EMA20), 2061.16 (EMA50) and 2169.34 (EMA200). That clean bullish stack shows price climbing steadily above every layer of trend support for weeks.
The RSI at 75.79 is the number that should make anyone chasing this move pause. That is deep into overbought territory, meaning the move is stretched and vulnerable to a sharp pullback. However, the MACD does not confirm exhaustion yet. The line sits at 169.21, above the signal at 134.5, while the histogram is positive and widening at 34.71.
The Bollinger Bands add nuance. With the mid-band at 2166.27, the upper band at 2730.70 and the lower band at 1601.85, ETH trades in the upper half without touching the top band. So there is still room to run toward 2730.70 before the daily chart would be considered fully extended.
Moreover, daily ATR sits at 116.48, meaning the average daily range is wide. On the pivot structure, ETH trades just under the daily pivot at 2502.92, with resistance at 2528.36 and support at 2470.80. Reclaiming that pivot is the first test bulls must pass; losing 2470.80 would flip the near-term tone bearish fast.
Hourly and 15-Minute Charts Show Consolidation, Not Confirmation
The hourly and 15-minute charts show consolidation, not confirmation, with short-term momentum flattened near neutral. On the hourly chart, EMA20 (2501.01) and EMA50 (2493.15) sit almost on top of each other, while EMA200 at 2390.34 keeps the broader intraday uptrend base intact.
However, the hourly RSI at 48.24 is dead neutral, and the MACD histogram has turned slightly negative at -2.71. That suggests short-term sellers have been nudging price below the EMA20 cluster rather than bulls pushing higher. The hourly Bollinger Bands are notably narrow — mid at 2505.15, upper at 2527.06, lower at 2483.24 — pointing to a volatility squeeze.
Price is testing the lower half of that range and sits just below the hourly pivot at 2497.92, with resistance at 2501.73 and support at 2492.41. Nothing dramatic, but it is a tight, indecisive tape.
On the 15-minute chart, the picture is similarly muted. EMA20 (2497.66) has slipped just under EMA50 (2501.29), a minor bearish cross matching the soft RSI at 47.29. Notably, the MACD histogram is positive at 1.2 even though both the MACD line (-1.25) and signal (-2.44) sit below zero.
That hints downside momentum may be fading on the very short timeframe, though it is far from a reversal confirmation. Price is pinned between the 15-minute pivot at 2497.00 and support at 2495.07, which is more execution-level noise than a change in the broader read.
The tension across timeframes is worth stating plainly: the daily chart is bullish and stretched, the hourly chart is flat-to-soft, and the 15-minute chart is chopping sideways in a narrow band. That is a market waiting for a trigger, not one confirming its own trend.
On-Chain Activity and Market Backdrop
On-chain activity is mixed, with some Ethereum-based exchanges surging while others bleed fees. Uniswap V4 fees jumped 127.54% in a single day and are up 97.07% over 30 days. Fluid DEX fees rose 101.07% daily and an eye-catching 240.9% over the month.
Moreover, that kind of fee growth usually reflects real usage increases on Ethereum-based decentralized exchanges, a healthy underlying signal for the network. Curve DEX tells the opposite story, with fees down 72.6% in 24 hours and 80.09% over seven days. That looks more like liquidity rotating away from a specific venue than a broader slowdown.
Meanwhile, the Fear & Greed Index reads 73, firmly in Greed territory, which lines up with an overbought daily RSI. A CNBC report on August 25 tied continued Bitcoin gains to parallel moves in ether and US Treasurys, while Fortune ran a dedicated Ethereum price tracker on August 24.
That media attention underscores how closely ETH’s price action is still being watched. The broader macro backdrop shows total market cap down 1.59% in a day, Bitcoin dominance climbing to 59.22%, and sentiment running hot. That combination of greed-driven positioning and a stretched daily RSI tends to catch late longs offside if momentum stalls.
Bullish and Bearish Scenarios for ETH
ETH’s next move hinges on two scenarios: reclaiming 2502.92 for bulls or losing 2470.80 for bears. The bullish case rests on ETH reclaiming and holding above the daily pivot at 2502.92, then clearing resistance at 2528.36.
If the hourly chart regains that 2501–2505 EMA and Bollinger cluster with conviction, the daily uptrend has room to extend toward the upper daily Bollinger band near 2730.70. That uptrend stays supported by a widening MACD histogram and price above all major EMAs. A rejection at 2528.36, or a break of the hourly EMA200 near 2390.34, would invalidate this view.
On the other hand, the bearish case builds around the daily RSI’s overbought reading of 75.79 combined with a Fear & Greed score of 73. Both point to a market that is sentiment-stretched while total market cap contracts and Bitcoin dominance rises. A break below daily support at 2470.80, confirmed by an hourly close under the 2493.15 EMA50 and a 15-minute break of 2495.07, would open the door to a deeper mean-reversion move.
Conversely, a quick reclaim of the EMA clusters on both the hourly and 15-minute charts would argue this is just consolidation rather than the start of a real reversal.
Where This Leaves Traders
Ethereum price today is a genuine study in mixed signals rather than a clean trend continuation or reversal setup. The daily chart says bulls are still in control but running into overbought territory, while the hourly and 15-minute charts say short-term momentum has stalled into a tight range.
Daily ATR at 116.48 reminds traders that whichever direction this resolves, the swings will not be small. With sentiment reading Greed at 73 and broader market cap already pulling back, this looks like a market that needs a catalyst. Until then, ETH is digesting recent gains rather than confirming the next leg, so traders should weigh both scenarios instead of assuming the daily trend settles the question.
FAQ
What is Ethereum’s price today?
As of August 28, 2026, ETH trades at $2,496.23, holding just below the daily pivot at 2502.92.
Is Ethereum’s daily trend bullish or bearish?
The daily trend is bullish, with ETH above its EMA20, EMA50 and EMA200, although the RSI at 75.79 signals overbought conditions.
What are the key levels to watch for ETH?
Bulls need to reclaim the daily pivot at 2502.92 and resistance at 2528.36, while bears want a break below support at 2470.80.
Disclaimer: This article is for informational purposes only and does not constitute financial advice, an investment recommendation, or a solicitation to buy or sell any financial instrument or cryptocurrency. The analysis provided is not indicative of future results. Investing in crypto assets and financial markets carries a high risk of capital loss. Always do your own research (DYOR) and consult a qualified financial advisor before making any decision.
Article produced with the assistance of artificial intelligence and reviewed by the editorial team.
Ethereum price today: ETH holds near $2,500 despite overbought RSI signal
As of August 28, 2026, Ethereum price today sits at $2,496.23, caught between a bullish daily chart and short-term charts losing steam. Total market capitalization slipped 1.59% over 24 hours to roughly $2.69 trillion, according to CoinGecko, while Bitcoin dominance climbed to 59.22%.
ETH/USDT — daily chart with candlesticks, EMA20/EMA50 and volume.
Key takeaways
ETH trades at $2,496.23 on August 28, 2026, above its daily EMA20, EMA50, and EMA200.
The daily RSI sits at 75.79 in overbought territory, while the Fear & Greed Index reads 73.
Total crypto market capitalization fell 1.59% in 24 hours to about $2.69 trillion, and Bitcoin dominance rose to 59.22%.
Hourly and 15-minute charts show consolidation, with ETH holding near the 2502.92 daily pivot.
Uniswap V4 fees jumped 127.54% in a day, while Curve DEX fees dropped 72.6% in 24 hours.
Daily Trend Still Points Up, But Momentum Is Overheating
The daily trend remains bullish: ETH trades above all three major EMAs — 2249.06 (EMA20), 2061.16 (EMA50) and 2169.34 (EMA200). That clean bullish stack shows price climbing steadily above every layer of trend support for weeks.
The RSI at 75.79 is the number that should make anyone chasing this move pause. That is deep into overbought territory, meaning the move is stretched and vulnerable to a sharp pullback. However, the MACD does not confirm exhaustion yet. The line sits at 169.21, above the signal at 134.5, while the histogram is positive and widening at 34.71.
The Bollinger Bands add nuance. With the mid-band at 2166.27, the upper band at 2730.70 and the lower band at 1601.85, ETH trades in the upper half without touching the top band. So there is still room to run toward 2730.70 before the daily chart would be considered fully extended.
Moreover, daily ATR sits at 116.48, meaning the average daily range is wide. On the pivot structure, ETH trades just under the daily pivot at 2502.92, with resistance at 2528.36 and support at 2470.80. Reclaiming that pivot is the first test bulls must pass; losing 2470.80 would flip the near-term tone bearish fast.
Hourly and 15-Minute Charts Show Consolidation, Not Confirmation
The hourly and 15-minute charts show consolidation, not confirmation, with short-term momentum flattened near neutral. On the hourly chart, EMA20 (2501.01) and EMA50 (2493.15) sit almost on top of each other, while EMA200 at 2390.34 keeps the broader intraday uptrend base intact.
However, the hourly RSI at 48.24 is dead neutral, and the MACD histogram has turned slightly negative at -2.71. That suggests short-term sellers have been nudging price below the EMA20 cluster rather than bulls pushing higher. The hourly Bollinger Bands are notably narrow — mid at 2505.15, upper at 2527.06, lower at 2483.24 — pointing to a volatility squeeze.
Price is testing the lower half of that range and sits just below the hourly pivot at 2497.92, with resistance at 2501.73 and support at 2492.41. Nothing dramatic, but it is a tight, indecisive tape.
On the 15-minute chart, the picture is similarly muted. EMA20 (2497.66) has slipped just under EMA50 (2501.29), a minor bearish cross matching the soft RSI at 47.29. Notably, the MACD histogram is positive at 1.2 even though both the MACD line (-1.25) and signal (-2.44) sit below zero.
That hints downside momentum may be fading on the very short timeframe, though it is far from a reversal confirmation. Price is pinned between the 15-minute pivot at 2497.00 and support at 2495.07, which is more execution-level noise than a change in the broader read.
The tension across timeframes is worth stating plainly: the daily chart is bullish and stretched, the hourly chart is flat-to-soft, and the 15-minute chart is chopping sideways in a narrow band. That is a market waiting for a trigger, not one confirming its own trend.
On-Chain Activity and Market Backdrop
On-chain activity is mixed, with some Ethereum-based exchanges surging while others bleed fees. Uniswap V4 fees jumped 127.54% in a single day and are up 97.07% over 30 days. Fluid DEX fees rose 101.07% daily and an eye-catching 240.9% over the month.
Moreover, that kind of fee growth usually reflects real usage increases on Ethereum-based decentralized exchanges, a healthy underlying signal for the network. Curve DEX tells the opposite story, with fees down 72.6% in 24 hours and 80.09% over seven days. That looks more like liquidity rotating away from a specific venue than a broader slowdown.
Meanwhile, the Fear & Greed Index reads 73, firmly in Greed territory, which lines up with an overbought daily RSI. A CNBC report on August 25 tied continued Bitcoin gains to parallel moves in ether and US Treasurys, while Fortune ran a dedicated Ethereum price tracker on August 24.
That media attention underscores how closely ETH’s price action is still being watched. The broader macro backdrop shows total market cap down 1.59% in a day, Bitcoin dominance climbing to 59.22%, and sentiment running hot. That combination of greed-driven positioning and a stretched daily RSI tends to catch late longs offside if momentum stalls.
Bullish and Bearish Scenarios for ETH
ETH’s next move hinges on two scenarios: reclaiming 2502.92 for bulls or losing 2470.80 for bears. The bullish case rests on ETH reclaiming and holding above the daily pivot at 2502.92, then clearing resistance at 2528.36.
If the hourly chart regains that 2501–2505 EMA and Bollinger cluster with conviction, the daily uptrend has room to extend toward the upper daily Bollinger band near 2730.70. That uptrend stays supported by a widening MACD histogram and price above all major EMAs. A rejection at 2528.36, or a break of the hourly EMA200 near 2390.34, would invalidate this view.
On the other hand, the bearish case builds around the daily RSI’s overbought reading of 75.79 combined with a Fear & Greed score of 73. Both point to a market that is sentiment-stretched while total market cap contracts and Bitcoin dominance rises. A break below daily support at 2470.80, confirmed by an hourly close under the 2493.15 EMA50 and a 15-minute break of 2495.07, would open the door to a deeper mean-reversion move.
Conversely, a quick reclaim of the EMA clusters on both the hourly and 15-minute charts would argue this is just consolidation rather than the start of a real reversal.
Where This Leaves Traders
Ethereum price today is a genuine study in mixed signals rather than a clean trend continuation or reversal setup. The daily chart says bulls are still in control but running into overbought territory, while the hourly and 15-minute charts say short-term momentum has stalled into a tight range.
Daily ATR at 116.48 reminds traders that whichever direction this resolves, the swings will not be small. With sentiment reading Greed at 73 and broader market cap already pulling back, this looks like a market that needs a catalyst. Until then, ETH is digesting recent gains rather than confirming the next leg, so traders should weigh both scenarios instead of assuming the daily trend settles the question.
FAQ
What is Ethereum’s price today?
As of August 28, 2026, ETH trades at $2,496.23, holding just below the daily pivot at 2502.92.
Is Ethereum’s daily trend bullish or bearish?
The daily trend is bullish, with ETH above its EMA20, EMA50 and EMA200, although the RSI at 75.79 signals overbought conditions.
What are the key levels to watch for ETH?
Bulls need to reclaim the daily pivot at 2502.92 and resistance at 2528.36, while bears want a break below support at 2470.80.
Disclaimer: This article is for informational purposes only and does not constitute financial advice, an investment recommendation, or a solicitation to buy or sell any financial instrument or cryptocurrency. The analysis provided is not indicative of future results. Investing in crypto assets and financial markets carries a high risk of capital loss. Always do your own research (DYOR) and consult a qualified financial advisor before making any decision.
Article produced with the assistance of artificial intelligence and reviewed by the editorial team.
ETH/USDT — daily chart with candlesticks, EMA20/EMA50 and volume.
Key takeaways
ETH trades at $2,496.23 on August 28, 2026, above its daily EMA20, EMA50, and EMA200.
The daily RSI sits at 75.79 in overbought territory, while the Fear & Greed Index reads 73.
Total crypto market capitalization fell 1.59% in 24 hours to about $2.69 trillion, and Bitcoin dominance rose to 59.22%.
Hourly and 15-minute charts show consolidation, with ETH holding near the 2502.92 daily pivot.
Uniswap V4 fees jumped 127.54% in a day, while Curve DEX fees dropped 72.6% in 24 hours.
Daily Trend Still Points Up, But Momentum Is Overheating
The daily trend remains bullish: ETH trades above all three major EMAs — 2249.06 (EMA20), 2061.16 (EMA50) and 2169.34 (EMA200). That clean bullish stack shows price climbing steadily above every layer of trend support for weeks.
The RSI at 75.79 is the number that should make anyone chasing this move pause. That is deep into overbought territory, meaning the move is stretched and vulnerable to a sharp pullback. However, the MACD does not confirm exhaustion yet. The line sits at 169.21, above the signal at 134.5, while the histogram is positive and widening at 34.71.
The Bollinger Bands add nuance. With the mid-band at 2166.27, the upper band at 2730.70 and the lower band at 1601.85, ETH trades in the upper half without touching the top band. So there is still room to run toward 2730.70 before the daily chart would be considered fully extended.
Moreover, daily ATR sits at 116.48, meaning the average daily range is wide. On the pivot structure, ETH trades just under the daily pivot at 2502.92, with resistance at 2528.36 and support at 2470.80. Reclaiming that pivot is the first test bulls must pass; losing 2470.80 would flip the near-term tone bearish fast.
Hourly and 15-Minute Charts Show Consolidation, Not Confirmation
The hourly and 15-minute charts show consolidation, not confirmation, with short-term momentum flattened near neutral. On the hourly chart, EMA20 (2501.01) and EMA50 (2493.15) sit almost on top of each other, while EMA200 at 2390.34 keeps the broader intraday uptrend base intact.
However, the hourly RSI at 48.24 is dead neutral, and the MACD histogram has turned slightly negative at -2.71. That suggests short-term sellers have been nudging price below the EMA20 cluster rather than bulls pushing higher. The hourly Bollinger Bands are notably narrow — mid at 2505.15, upper at 2527.06, lower at 2483.24 — pointing to a volatility squeeze.
Price is testing the lower half of that range and sits just below the hourly pivot at 2497.92, with resistance at 2501.73 and support at 2492.41. Nothing dramatic, but it is a tight, indecisive tape.
On the 15-minute chart, the picture is similarly muted. EMA20 (2497.66) has slipped just under EMA50 (2501.29), a minor bearish cross matching the soft RSI at 47.29. Notably, the MACD histogram is positive at 1.2 even though both the MACD line (-1.25) and signal (-2.44) sit below zero.
That hints downside momentum may be fading on the very short timeframe, though it is far from a reversal confirmation. Price is pinned between the 15-minute pivot at 2497.00 and support at 2495.07, which is more execution-level noise than a change in the broader read.
The tension across timeframes is worth stating plainly: the daily chart is bullish and stretched, the hourly chart is flat-to-soft, and the 15-minute chart is chopping sideways in a narrow band. That is a market waiting for a trigger, not one confirming its own trend.
On-Chain Activity and Market Backdrop
On-chain activity is mixed, with some Ethereum-based exchanges surging while others bleed fees. Uniswap V4 fees jumped 127.54% in a single day and are up 97.07% over 30 days. Fluid DEX fees rose 101.07% daily and an eye-catching 240.9% over the month.
Moreover, that kind of fee growth usually reflects real usage increases on Ethereum-based decentralized exchanges, a healthy underlying signal for the network. Curve DEX tells the opposite story, with fees down 72.6% in 24 hours and 80.09% over seven days. That looks more like liquidity rotating away from a specific venue than a broader slowdown.
Meanwhile, the Fear & Greed Index reads 73, firmly in Greed territory, which lines up with an overbought daily RSI. A CNBC report on August 25 tied continued Bitcoin gains to parallel moves in ether and US Treasurys, while Fortune ran a dedicated Ethereum price tracker on August 24.
That media attention underscores how closely ETH’s price action is still being watched. The broader macro backdrop shows total market cap down 1.59% in a day, Bitcoin dominance climbing to 59.22%, and sentiment running hot. That combination of greed-driven positioning and a stretched daily RSI tends to catch late longs offside if momentum stalls.
Bullish and Bearish Scenarios for ETH
ETH’s next move hinges on two scenarios: reclaiming 2502.92 for bulls or losing 2470.80 for bears. The bullish case rests on ETH reclaiming and holding above the daily pivot at 2502.92, then clearing resistance at 2528.36.
If the hourly chart regains that 2501–2505 EMA and Bollinger cluster with conviction, the daily uptrend has room to extend toward the upper daily Bollinger band near 2730.70. That uptrend stays supported by a widening MACD histogram and price above all major EMAs. A rejection at 2528.36, or a break of the hourly EMA200 near 2390.34, would invalidate this view.
On the other hand, the bearish case builds around the daily RSI’s overbought reading of 75.79 combined with a Fear & Greed score of 73. Both point to a market that is sentiment-stretched while total market cap contracts and Bitcoin dominance rises. A break below daily support at 2470.80, confirmed by an hourly close under the 2493.15 EMA50 and a 15-minute break of 2495.07, would open the door to a deeper mean-reversion move.
Conversely, a quick reclaim of the EMA clusters on both the hourly and 15-minute charts would argue this is just consolidation rather than the start of a real reversal.
Where This Leaves Traders
Ethereum price today is a genuine study in mixed signals rather than a clean trend continuation or reversal setup. The daily chart says bulls are still in control but running into overbought territory, while the hourly and 15-minute charts say short-term momentum has stalled into a tight range.
Daily ATR at 116.48 reminds traders that whichever direction this resolves, the swings will not be small. With sentiment reading Greed at 73 and broader market cap already pulling back, this looks like a market that needs a catalyst. Until then, ETH is digesting recent gains rather than confirming the next leg, so traders should weigh both scenarios instead of assuming the daily trend settles the question.
FAQ
What is Ethereum’s price today?
As of August 28, 2026, ETH trades at $2,496.23, holding just below the daily pivot at 2502.92.
Is Ethereum’s daily trend bullish or bearish?
The daily trend is bullish, with ETH above its EMA20, EMA50 and EMA200, although the RSI at 75.79 signals overbought conditions.
What are the key levels to watch for ETH?
Bulls need to reclaim the daily pivot at 2502.92 and resistance at 2528.36, while bears want a break below support at 2470.80.
Disclaimer: This article is for informational purposes only and does not constitute financial advice, an investment recommendation, or a solicitation to buy or sell any financial instrument or cryptocurrency. The analysis provided is not indicative of future results. Investing in crypto assets and financial markets carries a high risk of capital loss. Always do your own research (DYOR) and consult a qualified financial advisor before making any decision.
Article produced with the assistance of artificial intelligence and reviewed by the editorial team.
7
Log in to explore more content
Join global crypto users on Binance Square
⚡️ Get latest and useful information about crypto.
💬 Trusted by the world’s largest crypto exchange.
👍 Discover real insights from verified creators.
Email / Phone number
Trending Topics
YenPasses160PerDollarToOneMonthLow
5,687 views
171 Discussing
#yenpasses160perdollartoonemonthlow 🚨 YEN PASSES ¥160 PER DOLLAR — 1-MONTH LOW! 🇯🇵💴
USD/JPY has moved above the 160 level, putting the Japanese yen under renewed pressure. The move comes as the U.S. dollar strengthened after fresh Fed rate-hike expectations.
📊 Current Setup
• USD/JPY: around 160.15–160.20
• Resistance: 160.30–160.50
• Support: 159.70 → 159.50
• Momentum: Short-term bullish, but the pair is becoming overbought.
🎯 Possible Scenarios
🟢 Above 160.30 → potential move toward 161.00–163.00
🔴 Rejection below 160 → possible pullback toward 159.50–158.00
⏱️ Trade timing: Better to wait for confirmation around 160 rather than chase the breakout. The 160+ area carries significant BOJ intervention risk, so volatility can spike quickly. Japan has already spent a record amount supporting the yen.
💰 Profit: It depends on your position size and entry. For example, a move from 160.00 → 161.00 = 100 pips on USD/JPY. Your actual profit depends on your lot size.
⚠️ Not financial advice. Use a stop-loss and manage risk.
#USDJPY #JPY #Yen #Forex
$USDC $JPY.ETF
MR TALHA King
·4 Likes
·173 views
NYSilverFuturesDrop3%
21,700 views
493 Discussing
SchwabPlansToAddSOLAVAXLINKTrading
24,509 views
578 Discussing