A key indicator of the market's preference for ETH and BTC is the proportion of capital inflow and outflow for both on major exchanges. Recent data shows that the capital flow for ETH on exchanges rose to 48% on August 15 (red line), which is the highest level in this cycle, indicating that nearly half of the capital in the market is flowing towards ETH, nearly on par with BTC. This phenomenon fully demonstrates that the current interest in ETH has reached a quite high intensity.
If we compare the capital flow ratio with the ETH/BTC exchange rate over the long term (blue line), we can see that the two are highly synchronized: the stronger the capital inclination, the better ETH performs against BTC. The historical average we calculated is 26% (green line), and whenever the capital ratio breaks through this long-term average, the ETH/BTC exchange rate often strengthens accordingly.
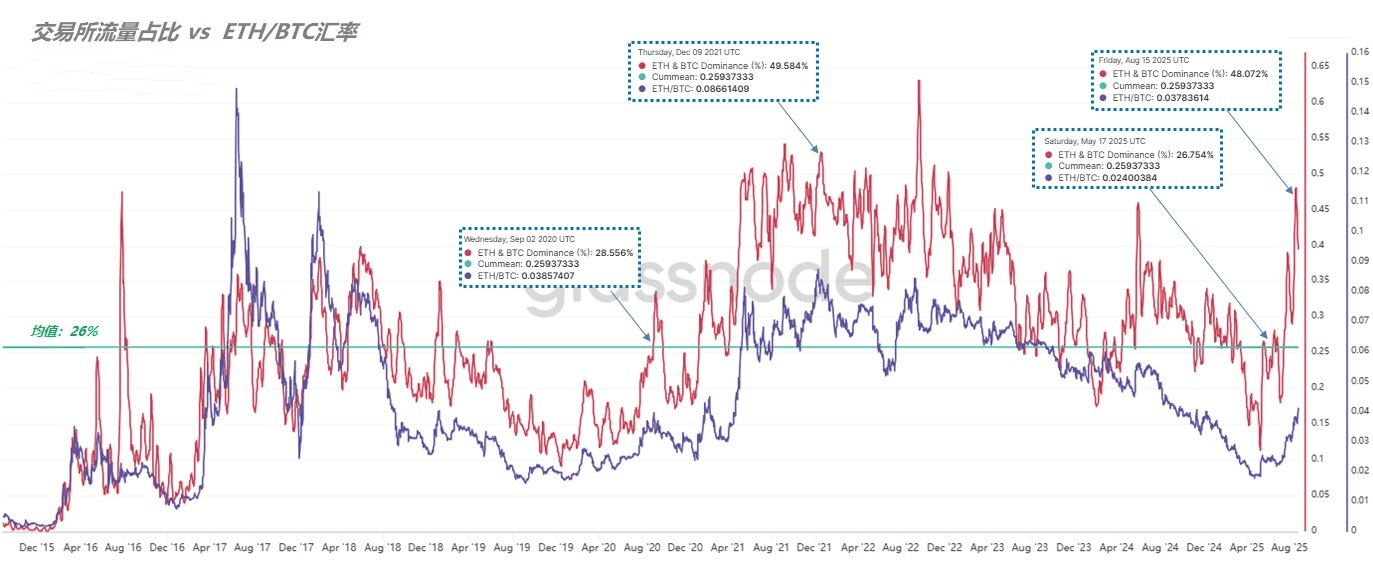
(Figure 1)
Taking 2020 as an example, when the capital flow ratio just broke to 28% on September 2, the ETH/BTC exchange rate was 0.038; as the ratio climbed to 49.5%, the exchange rate also rose to 0.086. In this cycle, the flow ratio of ETH returned above the historical average on May 17, with the exchange rate around 0.024; as traditional capital continued to enter, the ratio further increased, reaching 48% on August 15.
It is worth noting that this level is close to the peak in December 2021, but the current ETH/BTC exchange rate is only around 0.04, still significantly below the high of 0.08 from that year. From a historical perspective, the current exchange rate may still be undervalued, and as long as capital attention remains high, there is still room for ETH to rise relative to BTC.

