The core logic of Bitcoin's current market (from 2022 to present) lies in the strong rebound triggered by the monthly MACD returning to the zero axis, driving the price from $15,479 to $123,236.
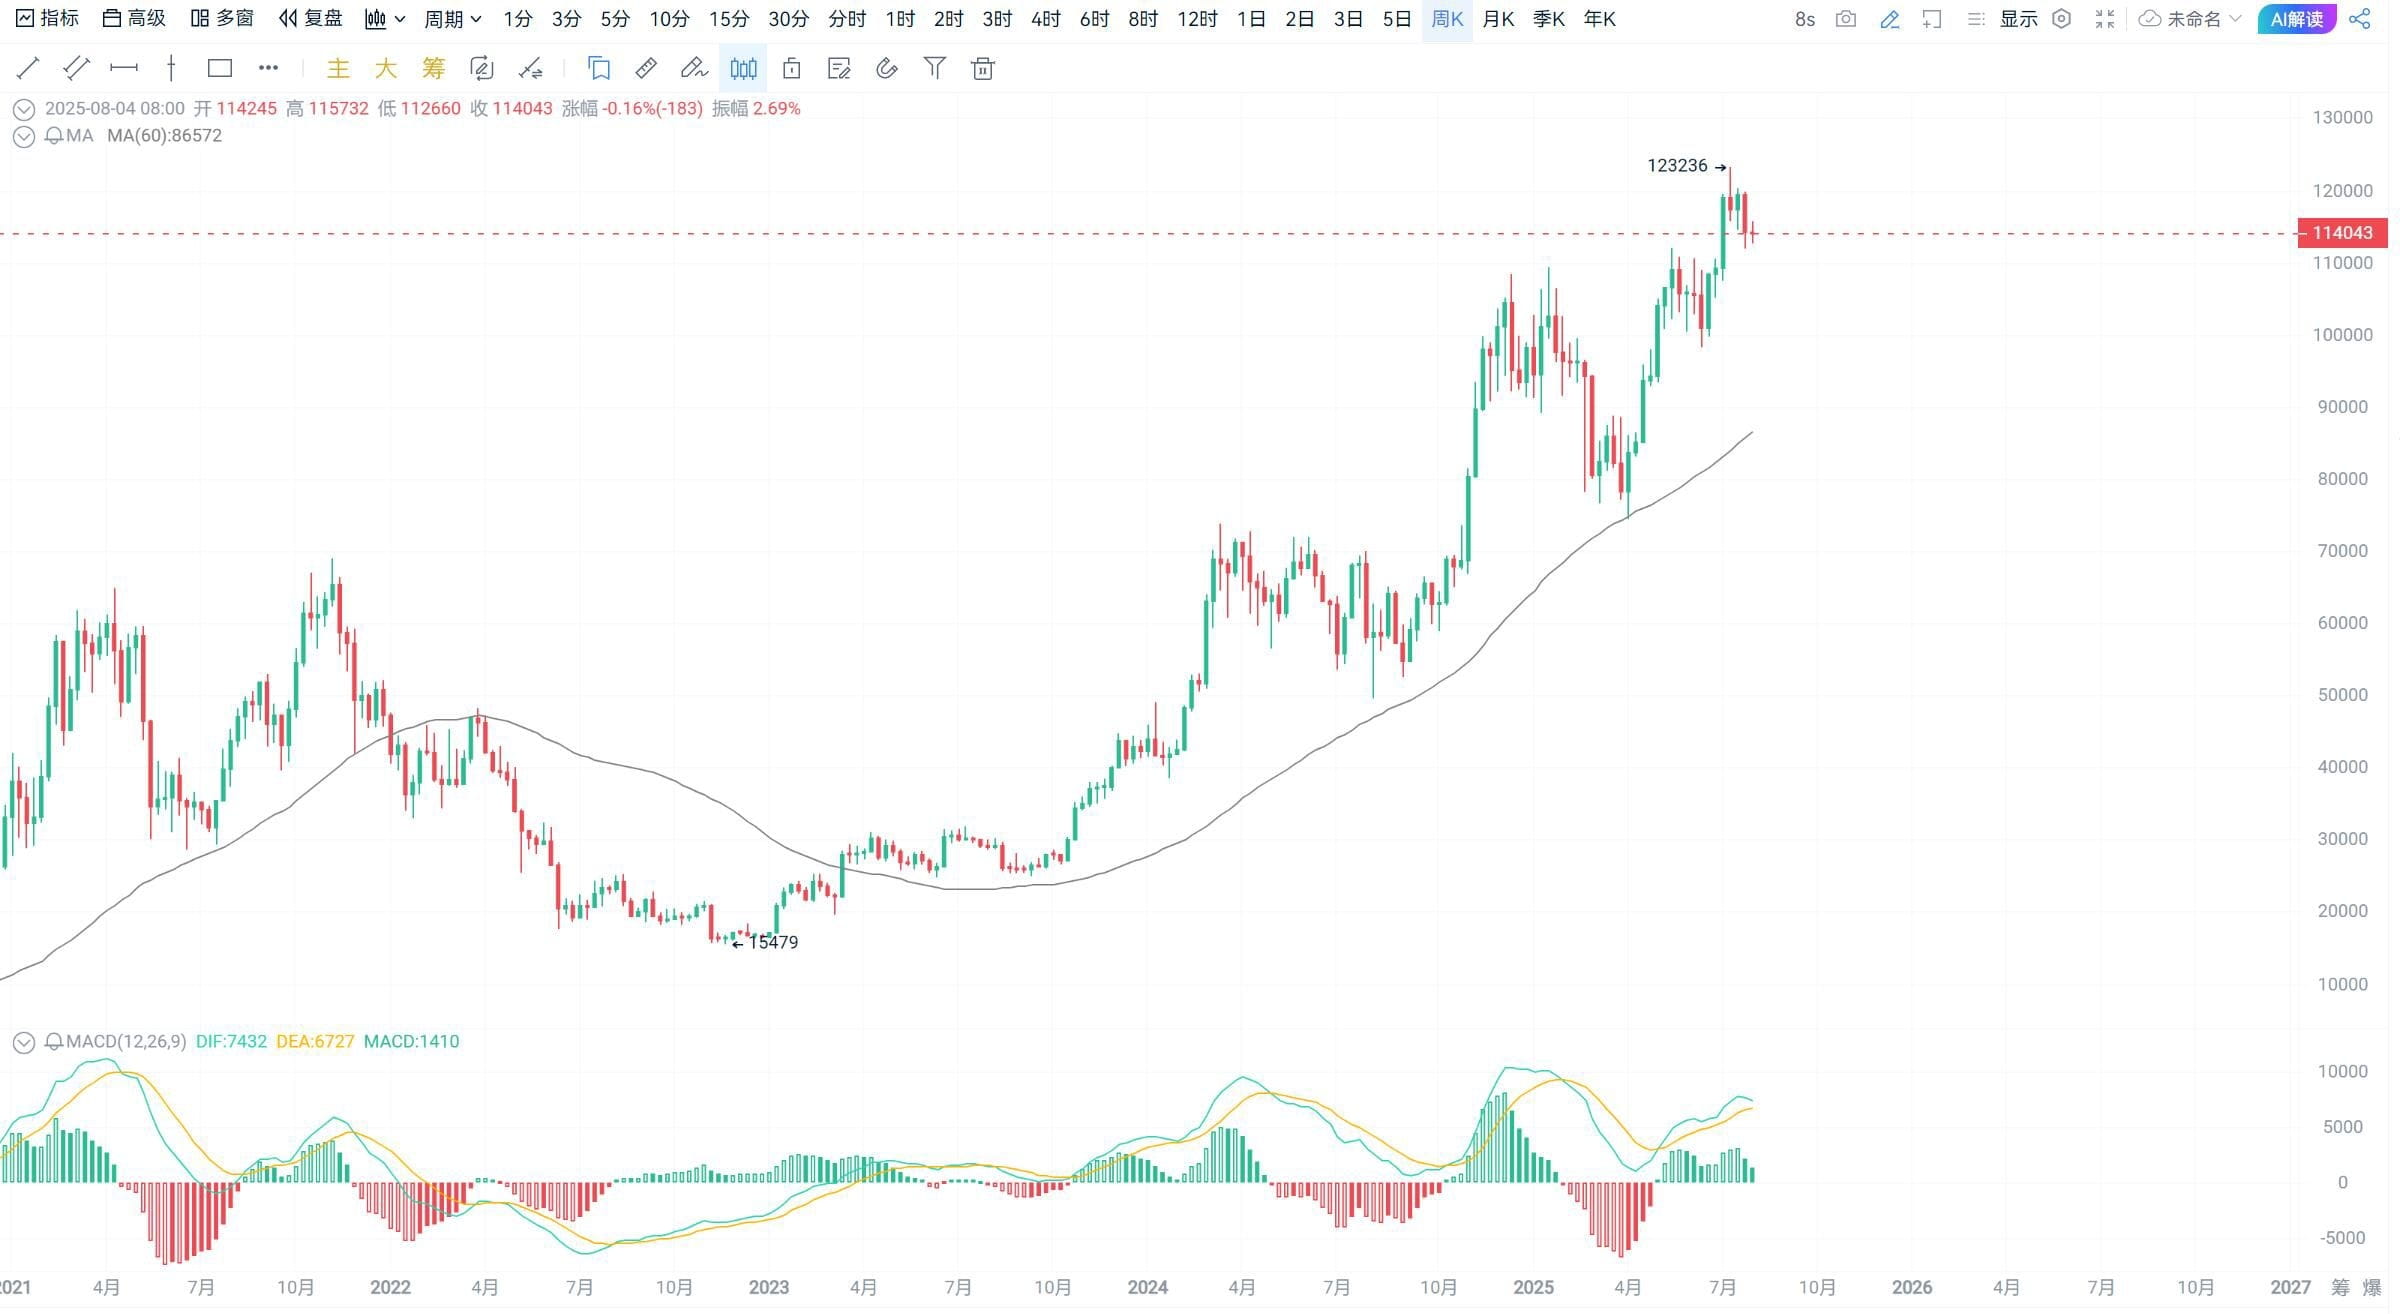
. Observing from the dominant weekly level, this round of market has clearly experienced four complete unit adjustment cycles:
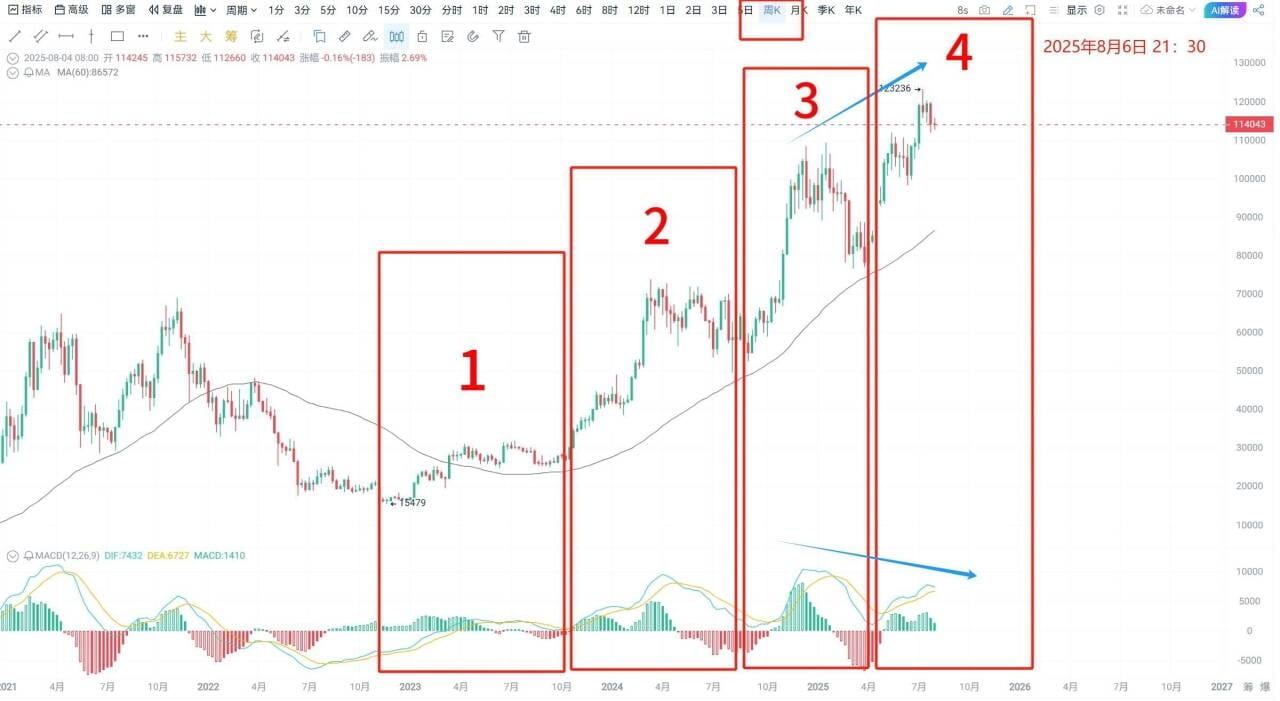
1. First wave rise (bottom formation): Initiated in November 2022, after more than half a year of weekly adjustment and bottoming out, the MACD crossed the zero axis, driving the price from $15,479 to $31,818. [First unit adjustment cycle]
2. Second wave rise (first return to zero axis): After more than five months of strong adjustment, the weekly MACD completed its first return to the zero axis in September 2023, followed by a significant price increase from $24,920 to $73,794. [Second unit adjustment cycle]
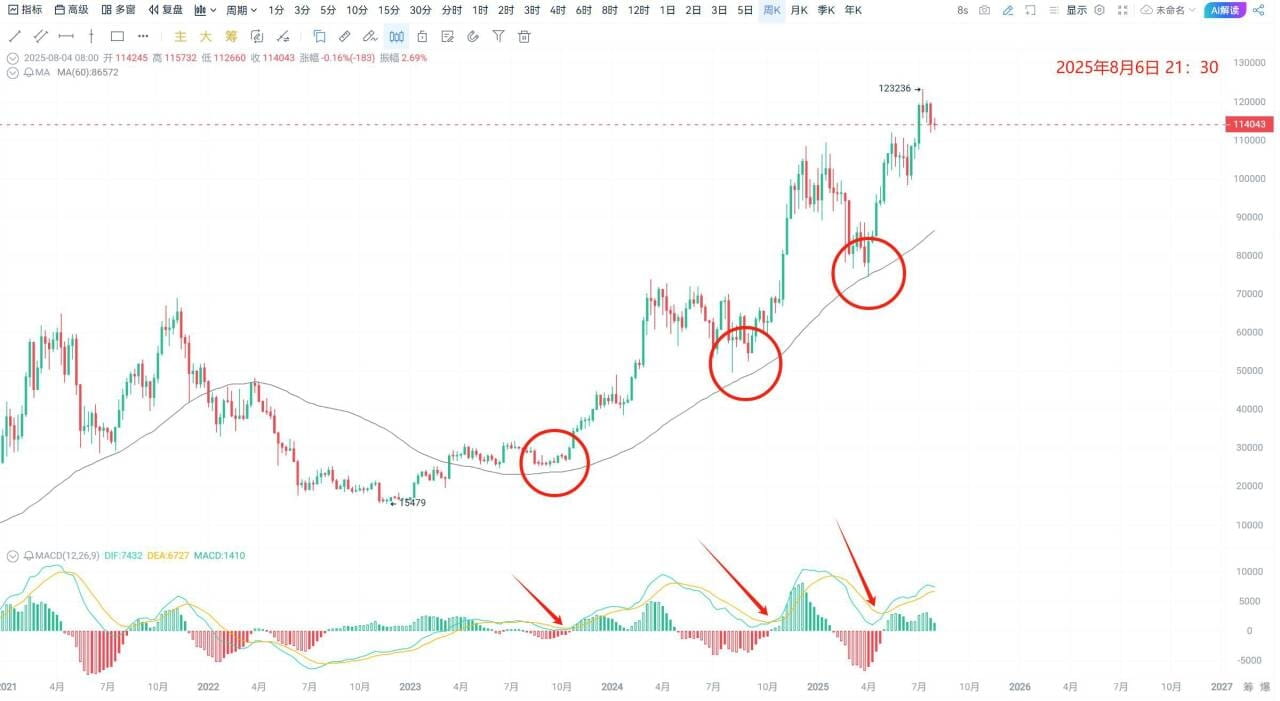
3. Third wave rise returns to the zero axis again: After five months of adjustment, by August 2024, the weekly MACD returns to the zero axis, with the price soaring from $49,577 to $109,356. [Third unit adjustment cycle] It is worth noting that after this adjustment, the market strength has clearly shifted from strong to weak.
4. Fourth wave rise (current stage): After the adjustment is completed, the MACD returns to the zero axis, initiating the current surge, with the price rising from $74,434 to the current $123,236. [Currently in the fourth unit adjustment cycle]
Current market reflections:
The current fourth unit adjustment cycle has formed a static divergence with the third unit adjustment cycle. This is a clear danger signal, indicating that the upward momentum at the weekly level may be exhausted, with the risk of MACD crossing below the zero axis ending the weekly upward trend.
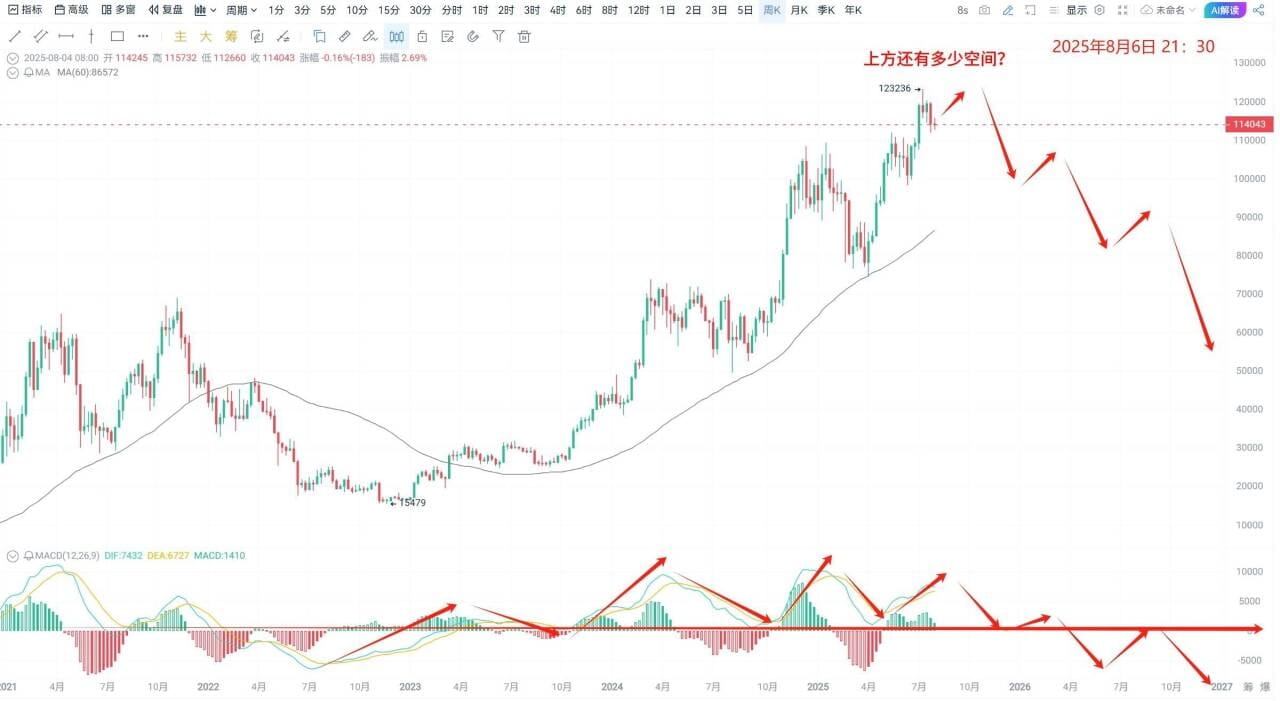
Is there a need to worry excessively?
The overall pattern is still dominated by bulls, with the key being to observe the smaller level within the weekly—3-day line. [Heavily significant]
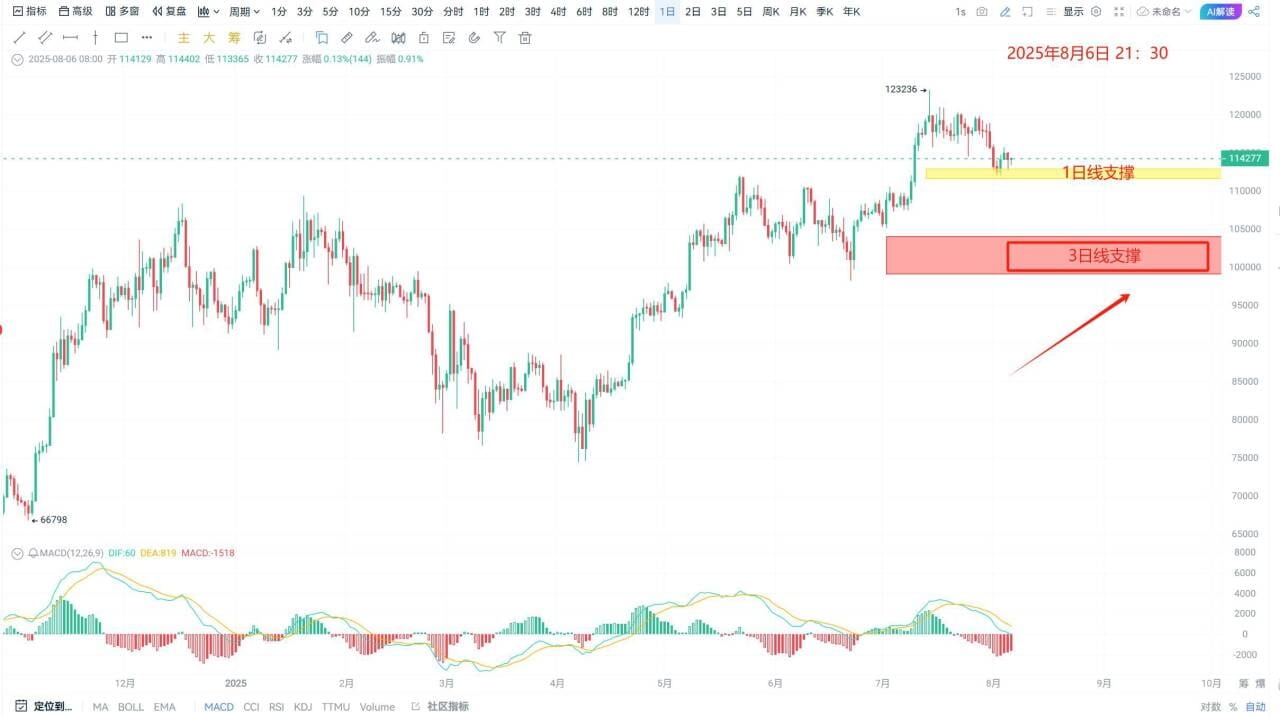
The 3-day line is the last line of defense for the weekly trend. Currently, it has not adjusted to the 3-day line level.
Key focus:
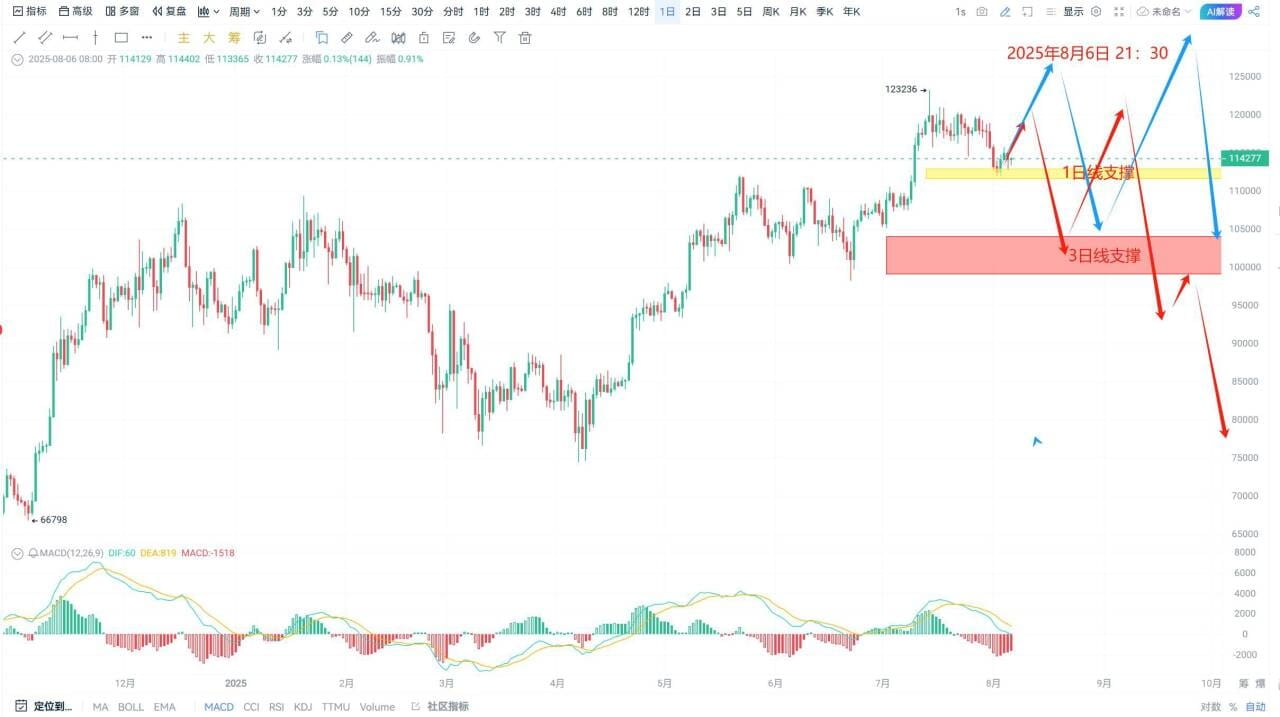
If the price finds support at the 3-day line and rebounds, attention should be paid to whether it can form a top structure afterwards. Alternatively, the 3-day line level may directly break through key support.
Only when the rebound at the 3-day line level is confirmed to have ended (forming a top) or directly breaks down is it truly a key position that requires high vigilance and confirmation that the weekly trend may be ending!
BTC

