Despite Bitcoin reaching a new historical peak of $124,400, its capital inflow continues to decline. This period of relatively weak capital inflow highlights a significant decrease in investor demand willingness at this stage.
As Bitcoin's price reached its historical peak, the total open interest of mainstream altcoins also hit a historical high of $60 billion, underscoring the high level of market leverage. However, this situation was short-lived, as the price retraced downwards, reducing open interest by $2.6 billion, marking the tenth largest drop on record.
Ethereum is often viewed as a bellwether asset, with its strong performance periods typically correlating with the broader 'altcoin season' in the digital asset market. Notably, Ethereum's open interest dominance has reached the fourth highest level on record, while its perpetual futures trading volume dominance has soared to a new all-time high of 67%.
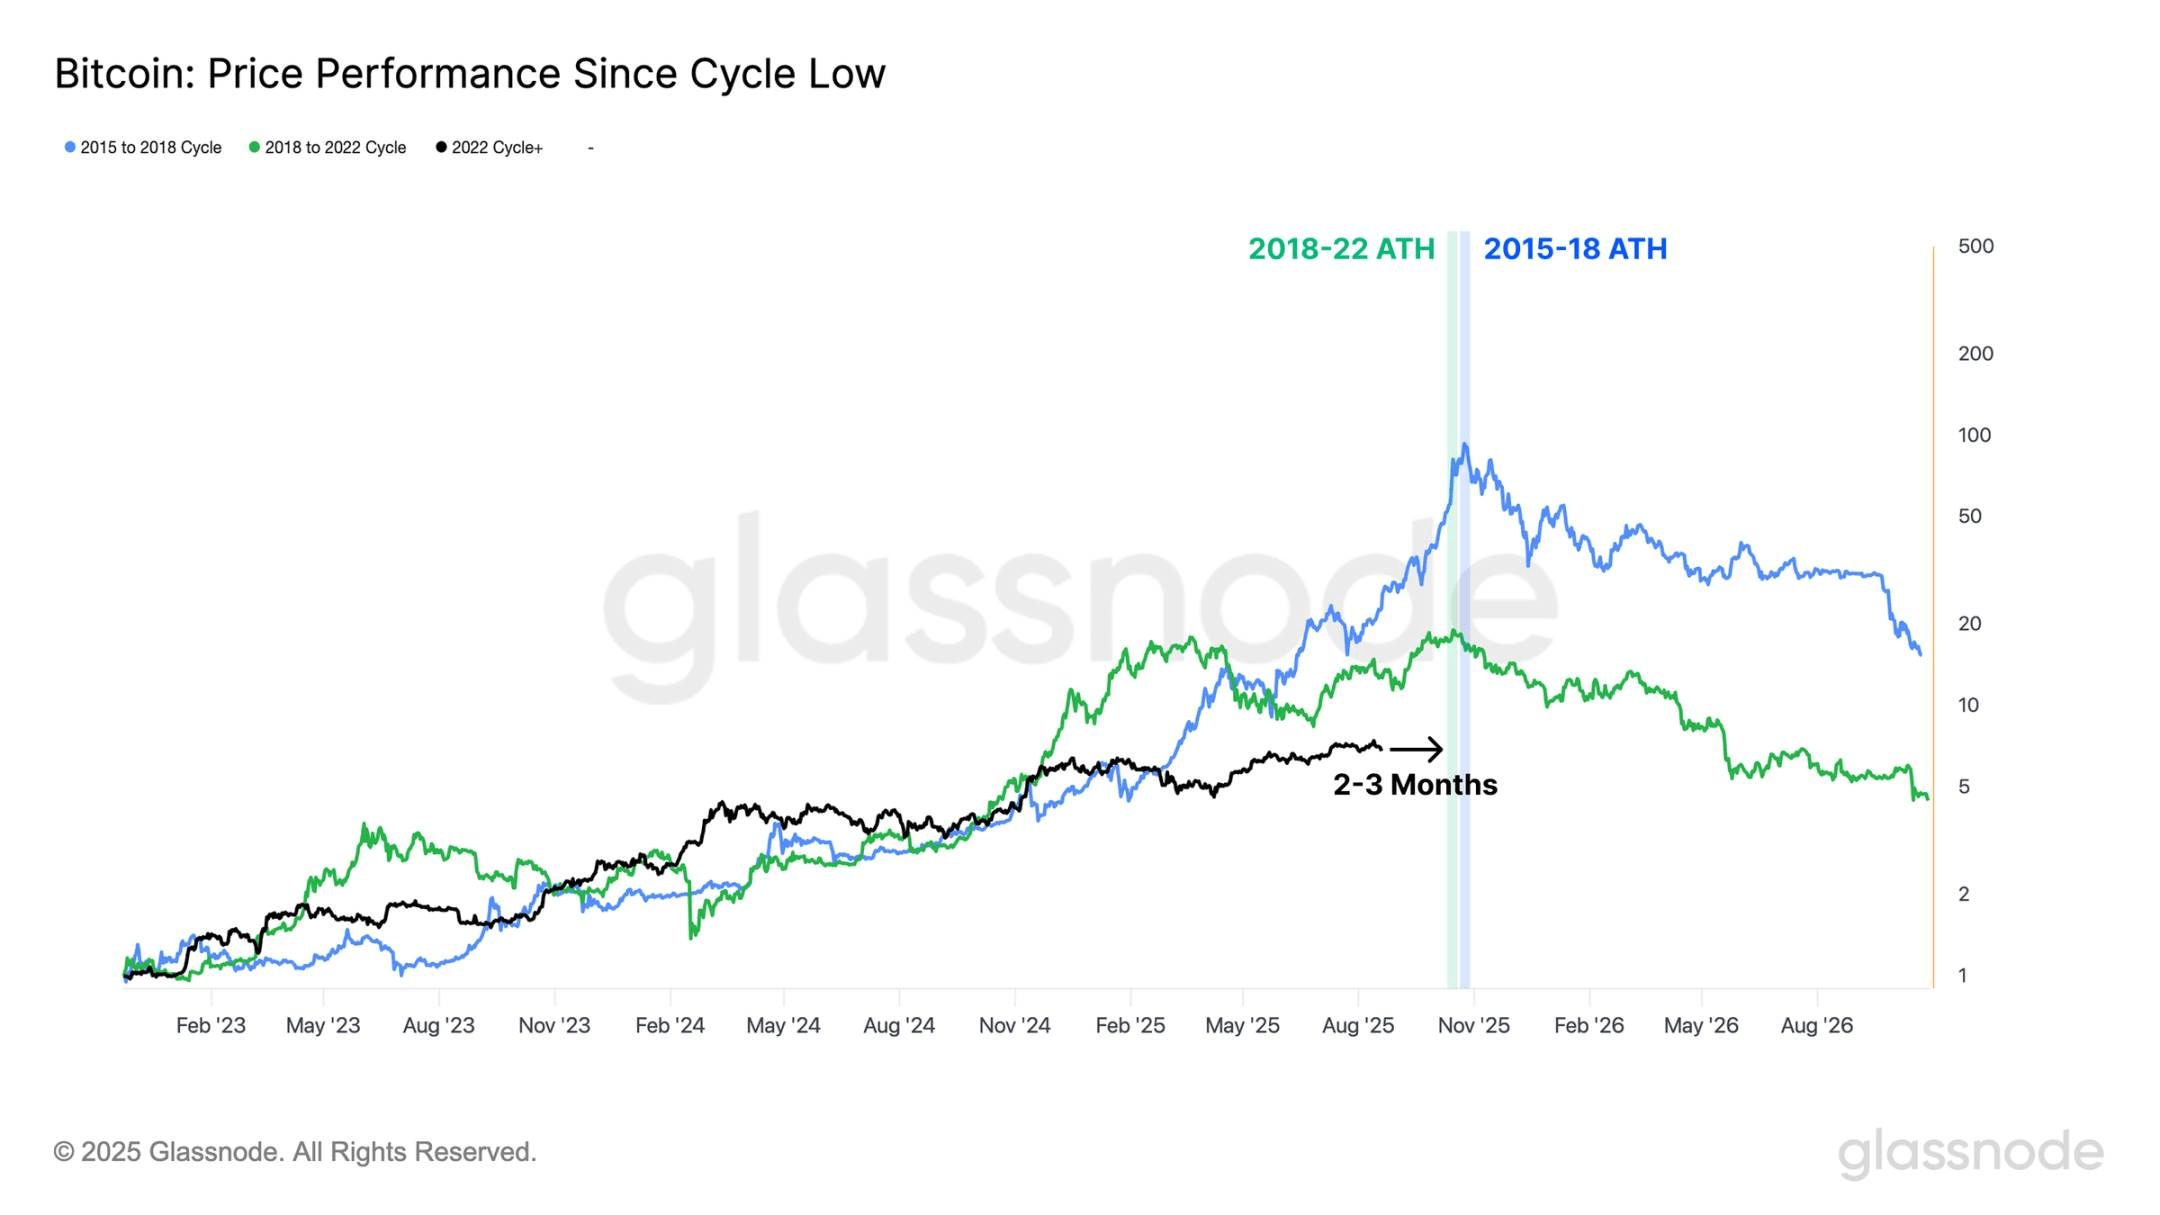
When we observe Bitcoin's performance from each cycle's low point, we can see that in the two periods of 2015-2018 and 2018-2022, the time to reach the historical peak was approximately 2-3 months later than the current point in time we are in.
Slowing capital flows
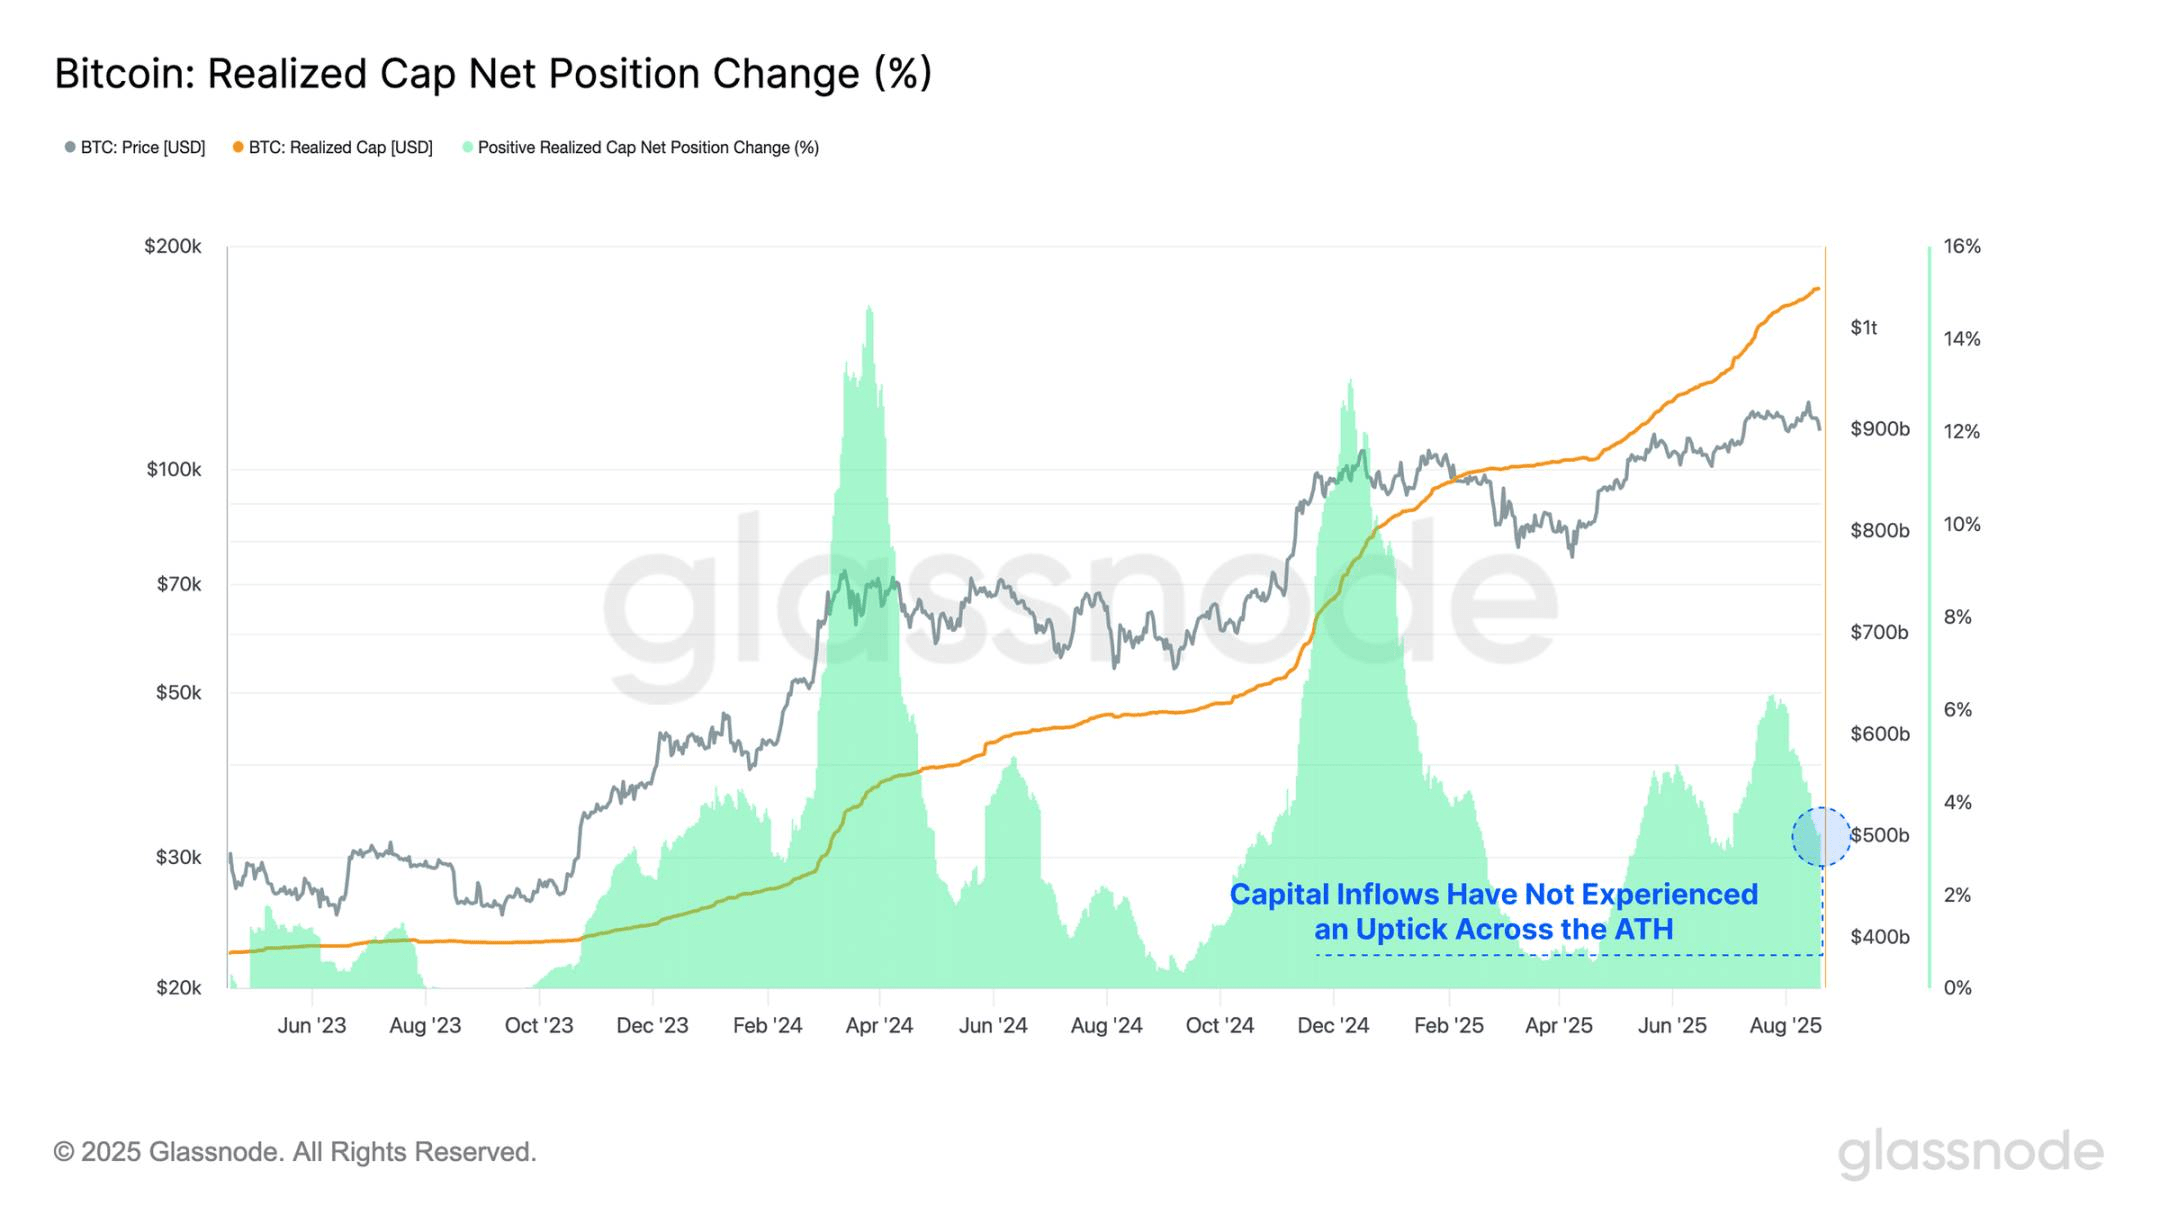
Following last week's peak of $124,400, Bitcoin's upward momentum has stalled, with prices retreating to a low of $112,900, a retracement of nearly 9.2%. This decline is accompanied by a noticeable weakness in capital inflow in recent weeks, indicating investor reluctance to inject new funds at these high price levels.
When we compare the current capital inflow rate to instances of prior historical peaks, we find that the percentage growth in realized market capitalization is far below the levels seen during the historical peak breakthroughs in March and December 2024. When first breaking through $100,000 at the end of 2024, the monthly growth rate of realized market capitalization reached +13%, whereas the peak in the current environment is much lower at only +6%/month.
This period of relatively weak capital inflow highlights a significant decrease in investor demand willingness at this stage.
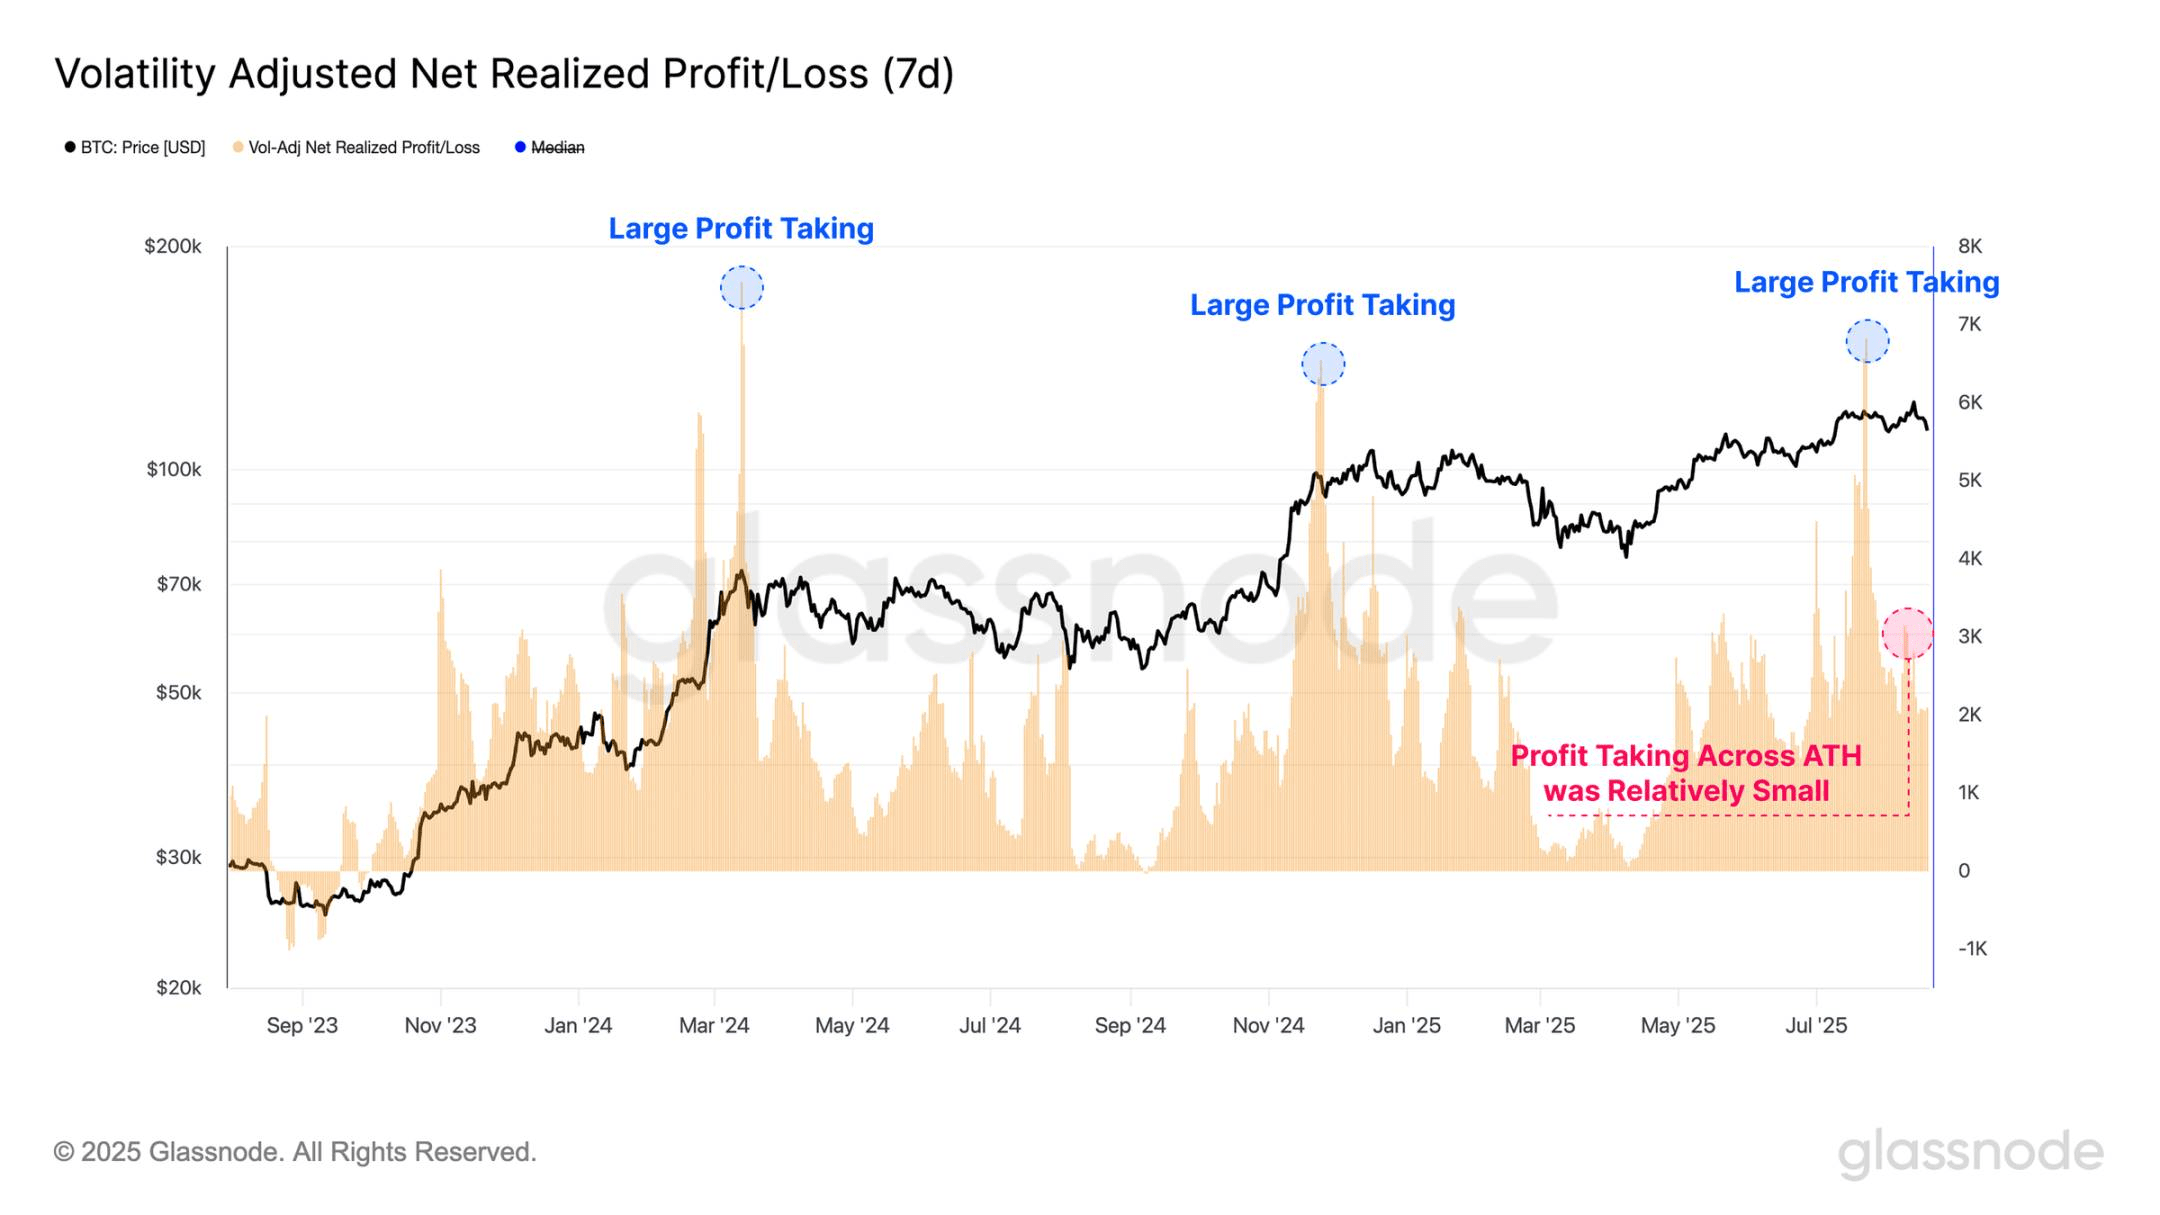
Profit-taking activity has also decreased in recent weeks, which can be observed through the volatility-adjusted net realized profit/loss metric. This tool measures realized profits and losses in Bitcoin (BTC) and is normalized against the increasing market value of Bitcoin over different cycles. It is further refined by adjusting for the 7-day realized volatility to account for the diminishing returns and slowing growth rates of Bitcoin as the asset matures.
It is noteworthy that we can observe three major profit-taking events around the breakthrough points of $70,000 and $100,000 in 2024, as well as the historical peak of $122,000 reached in July of this year. These events indicate a strong willingness among investors to lock in substantial profits, but the demand impulse to absorb this selling supply is equally strong.
In contrast, during this latest attempt at a historical price peak, the realized profit-taking volume has significantly decreased. One interpretation of this dynamic is that while selling pressure from existing holders is minimal, the market has failed to maintain upward momentum.
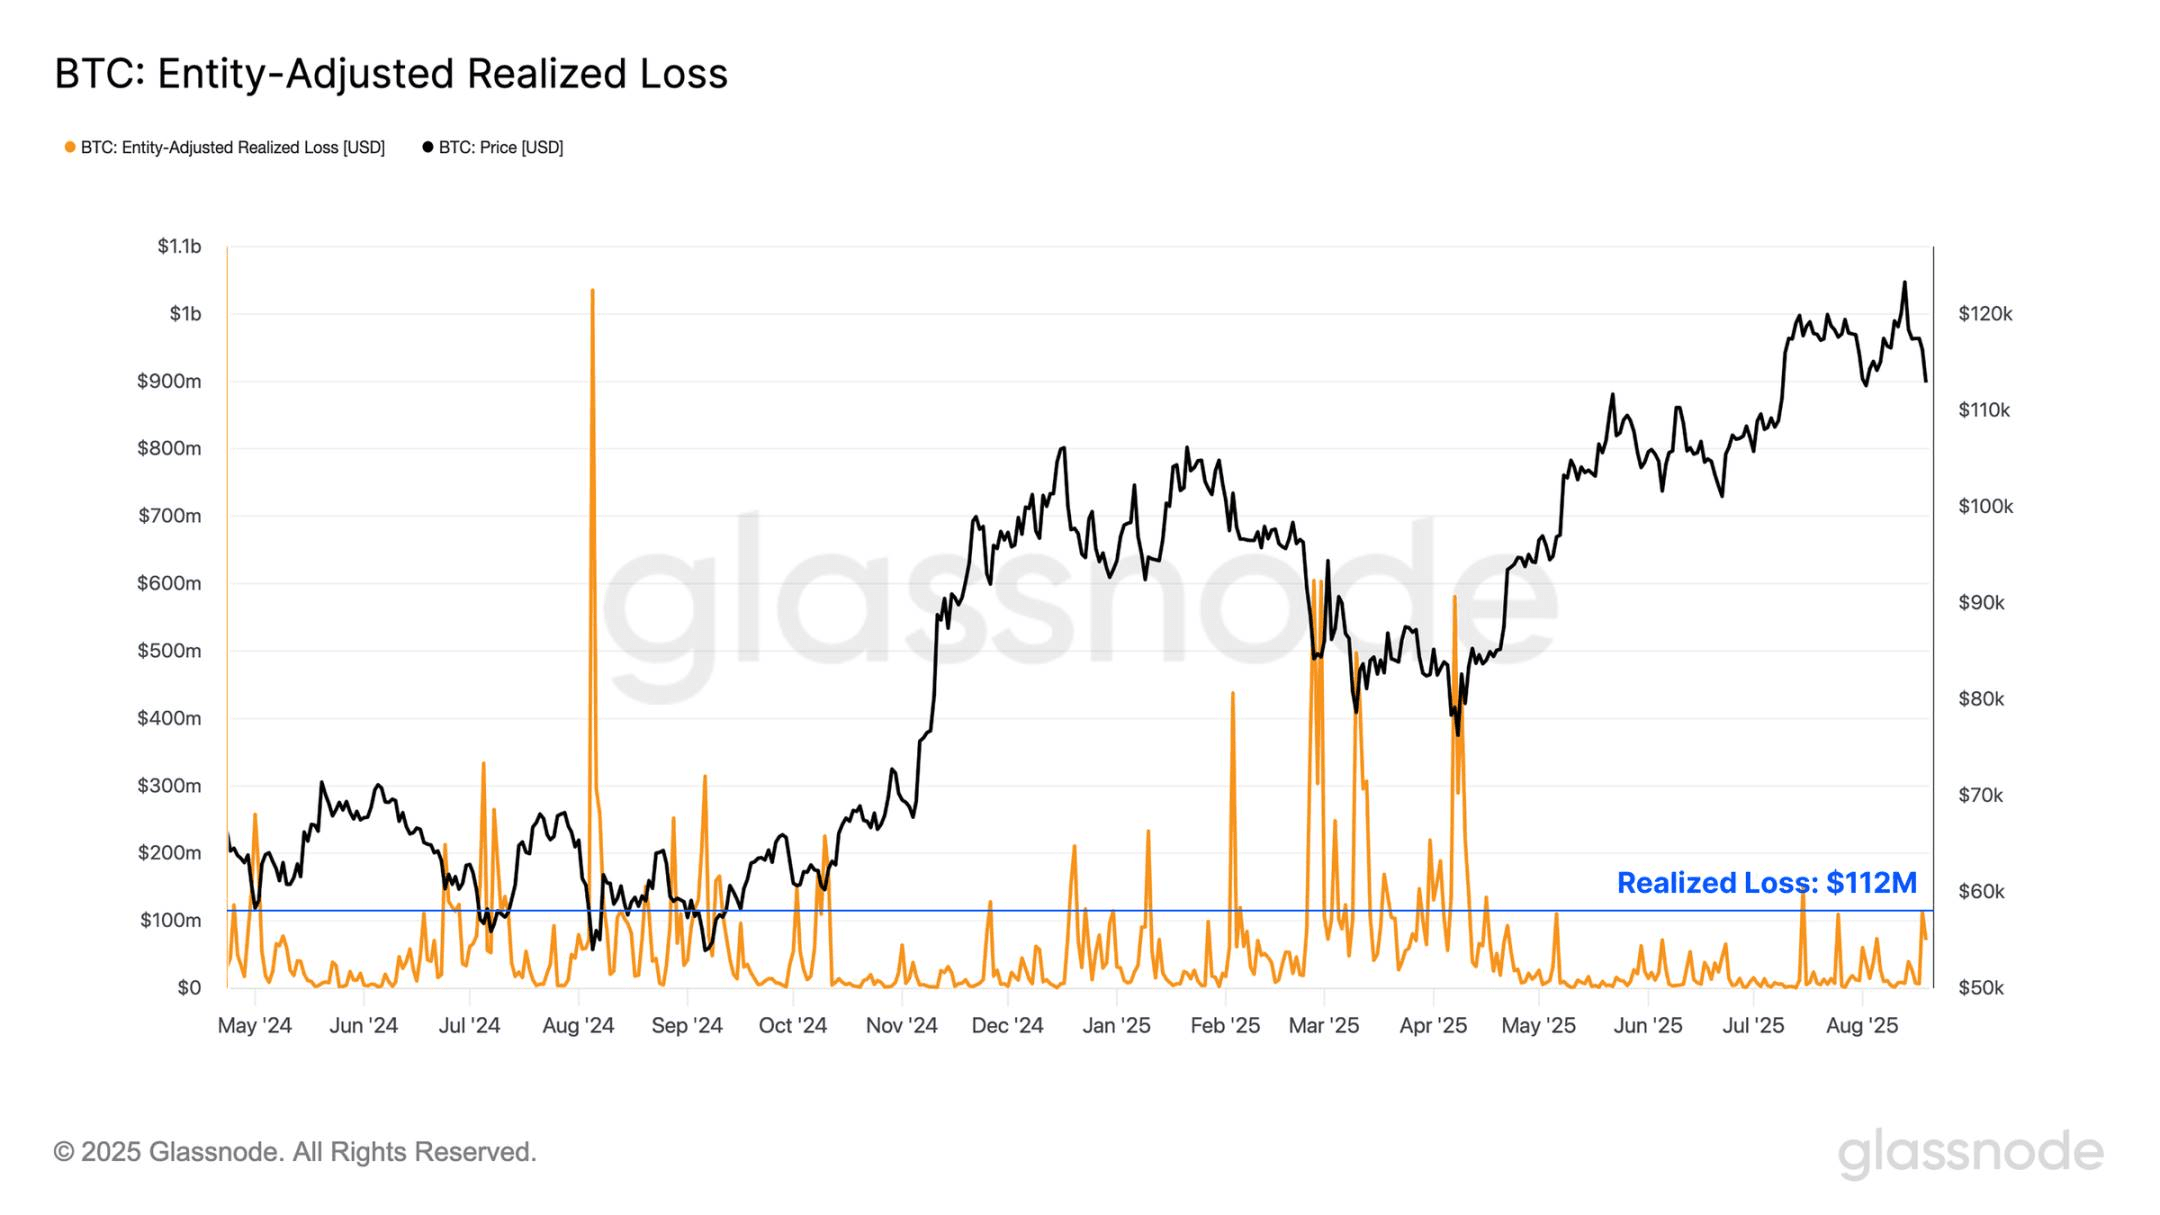
As local market momentum reverses and prices continue to decline, we turn our attention to realized loss events to assess whether there have been any significant negative changes in investor sentiment. During this local downtrend, investors' realized losses have accelerated, reaching a value of $112 million per day.
However, this is still within the typical range of a local pullback during an overall bull market cycle, with many events, such as the yen arbitrage trade liquidation in August 2024 and the 'Trump Tariff Panic' from March to April 2025, leading to significantly higher capitulation volumes.
This suggests that while increasing losses may begin to challenge this view, the current downtrend has not yet had a substantial impact on investor confidence.
Leveraged-driven decline
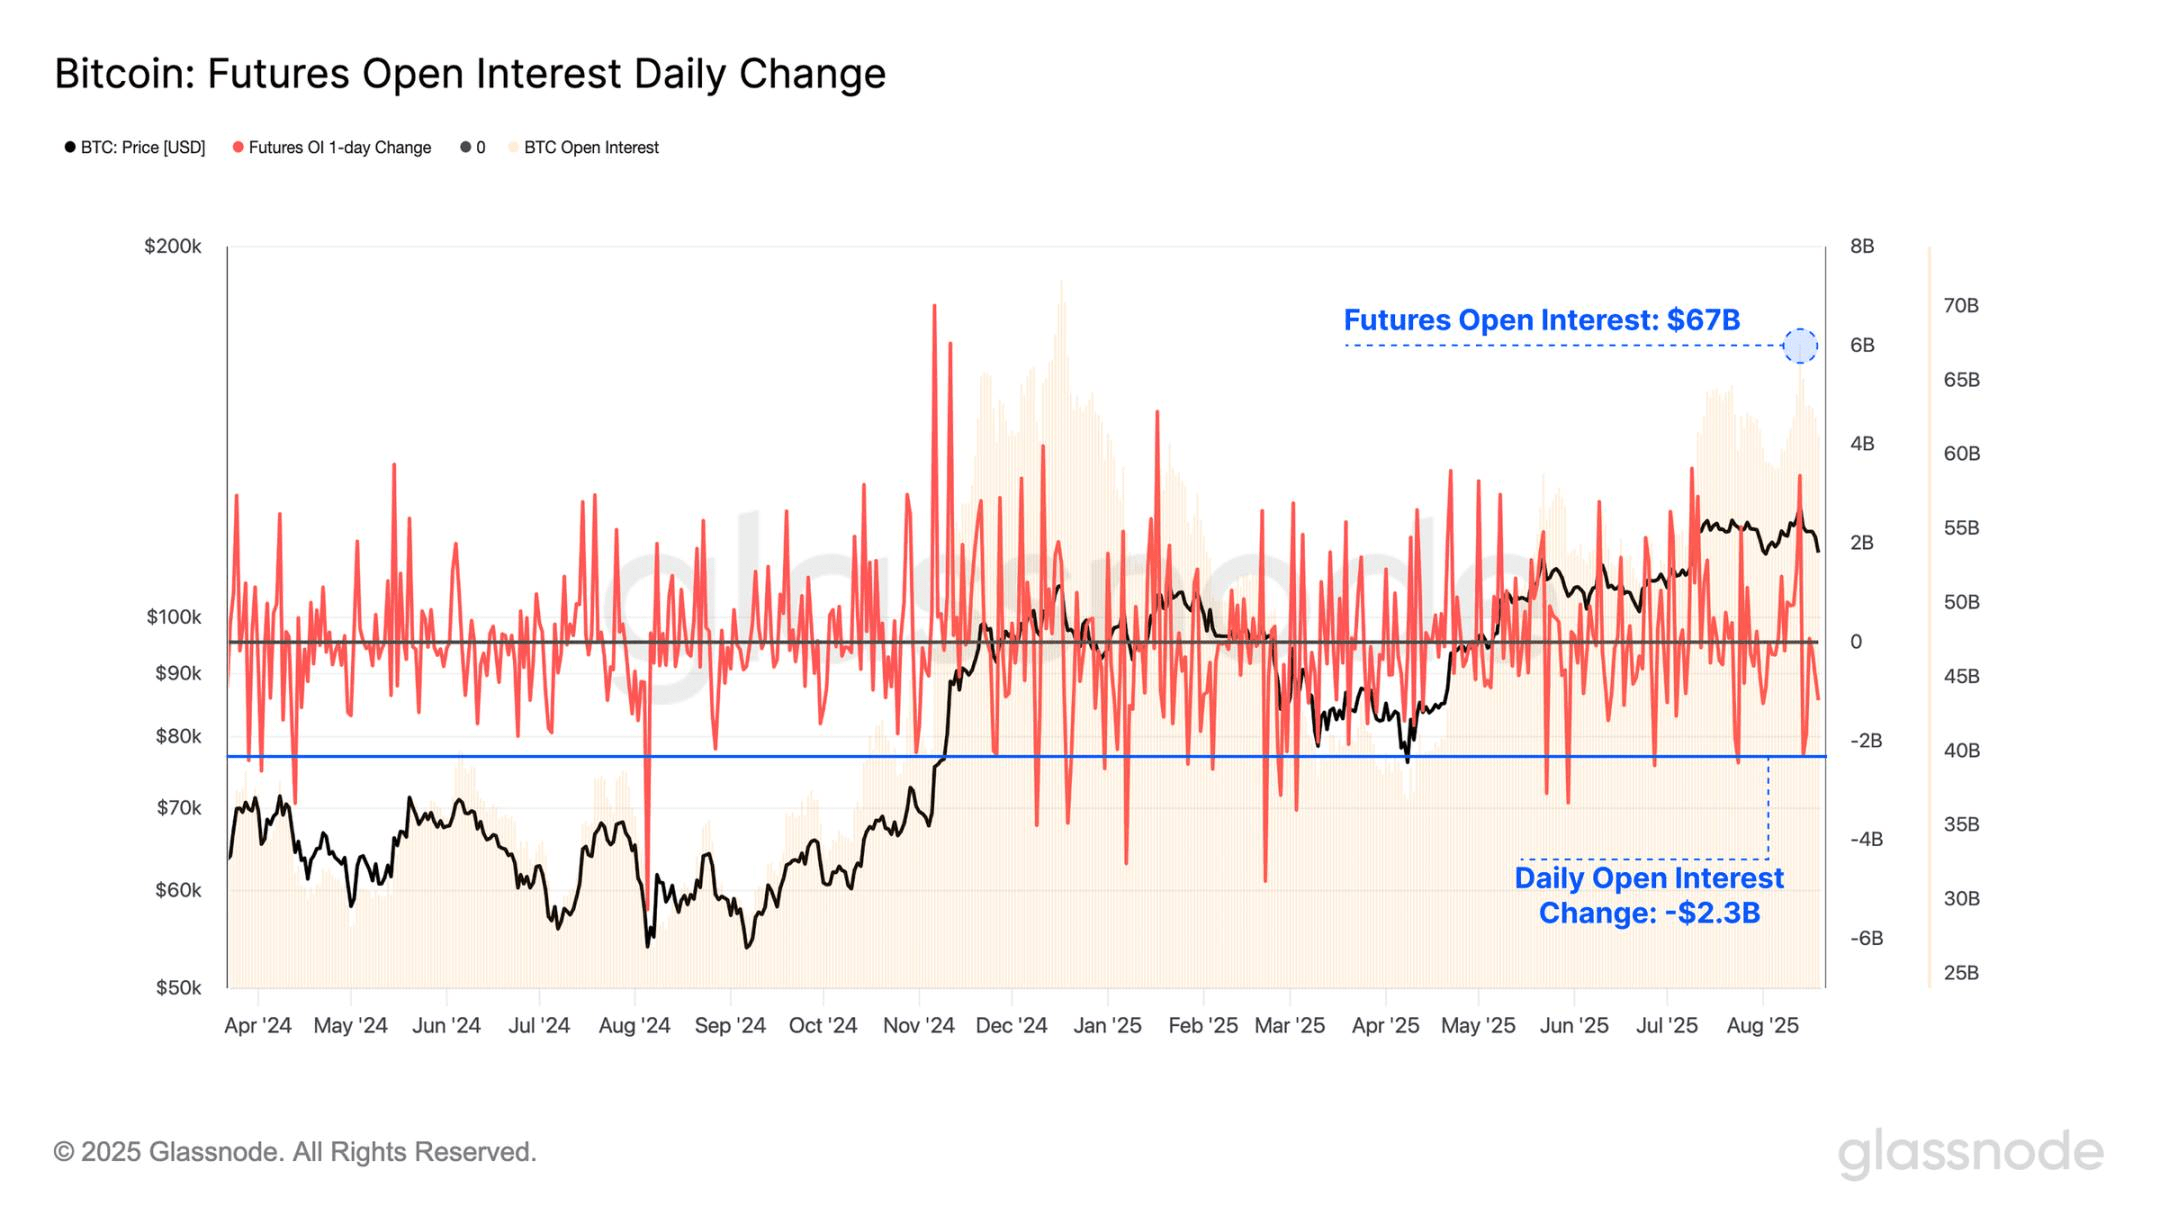
Even though realized profits and losses on-chain have been relatively muted during the recent formation of the historical peak and subsequent pullback, activity in the futures market has accelerated. The total open interest of Bitcoin futures contracts remains high at $67 billion, underscoring the high level of leverage present in the current market.
Notably, during the recent sell-off, over $2.3 billion in open interest contracts were liquidated, with only 23 trading days recording larger nominal declines. This underscores the speculative nature of the market, where even moderate price fluctuations can trigger significant contractions in leveraged positions.
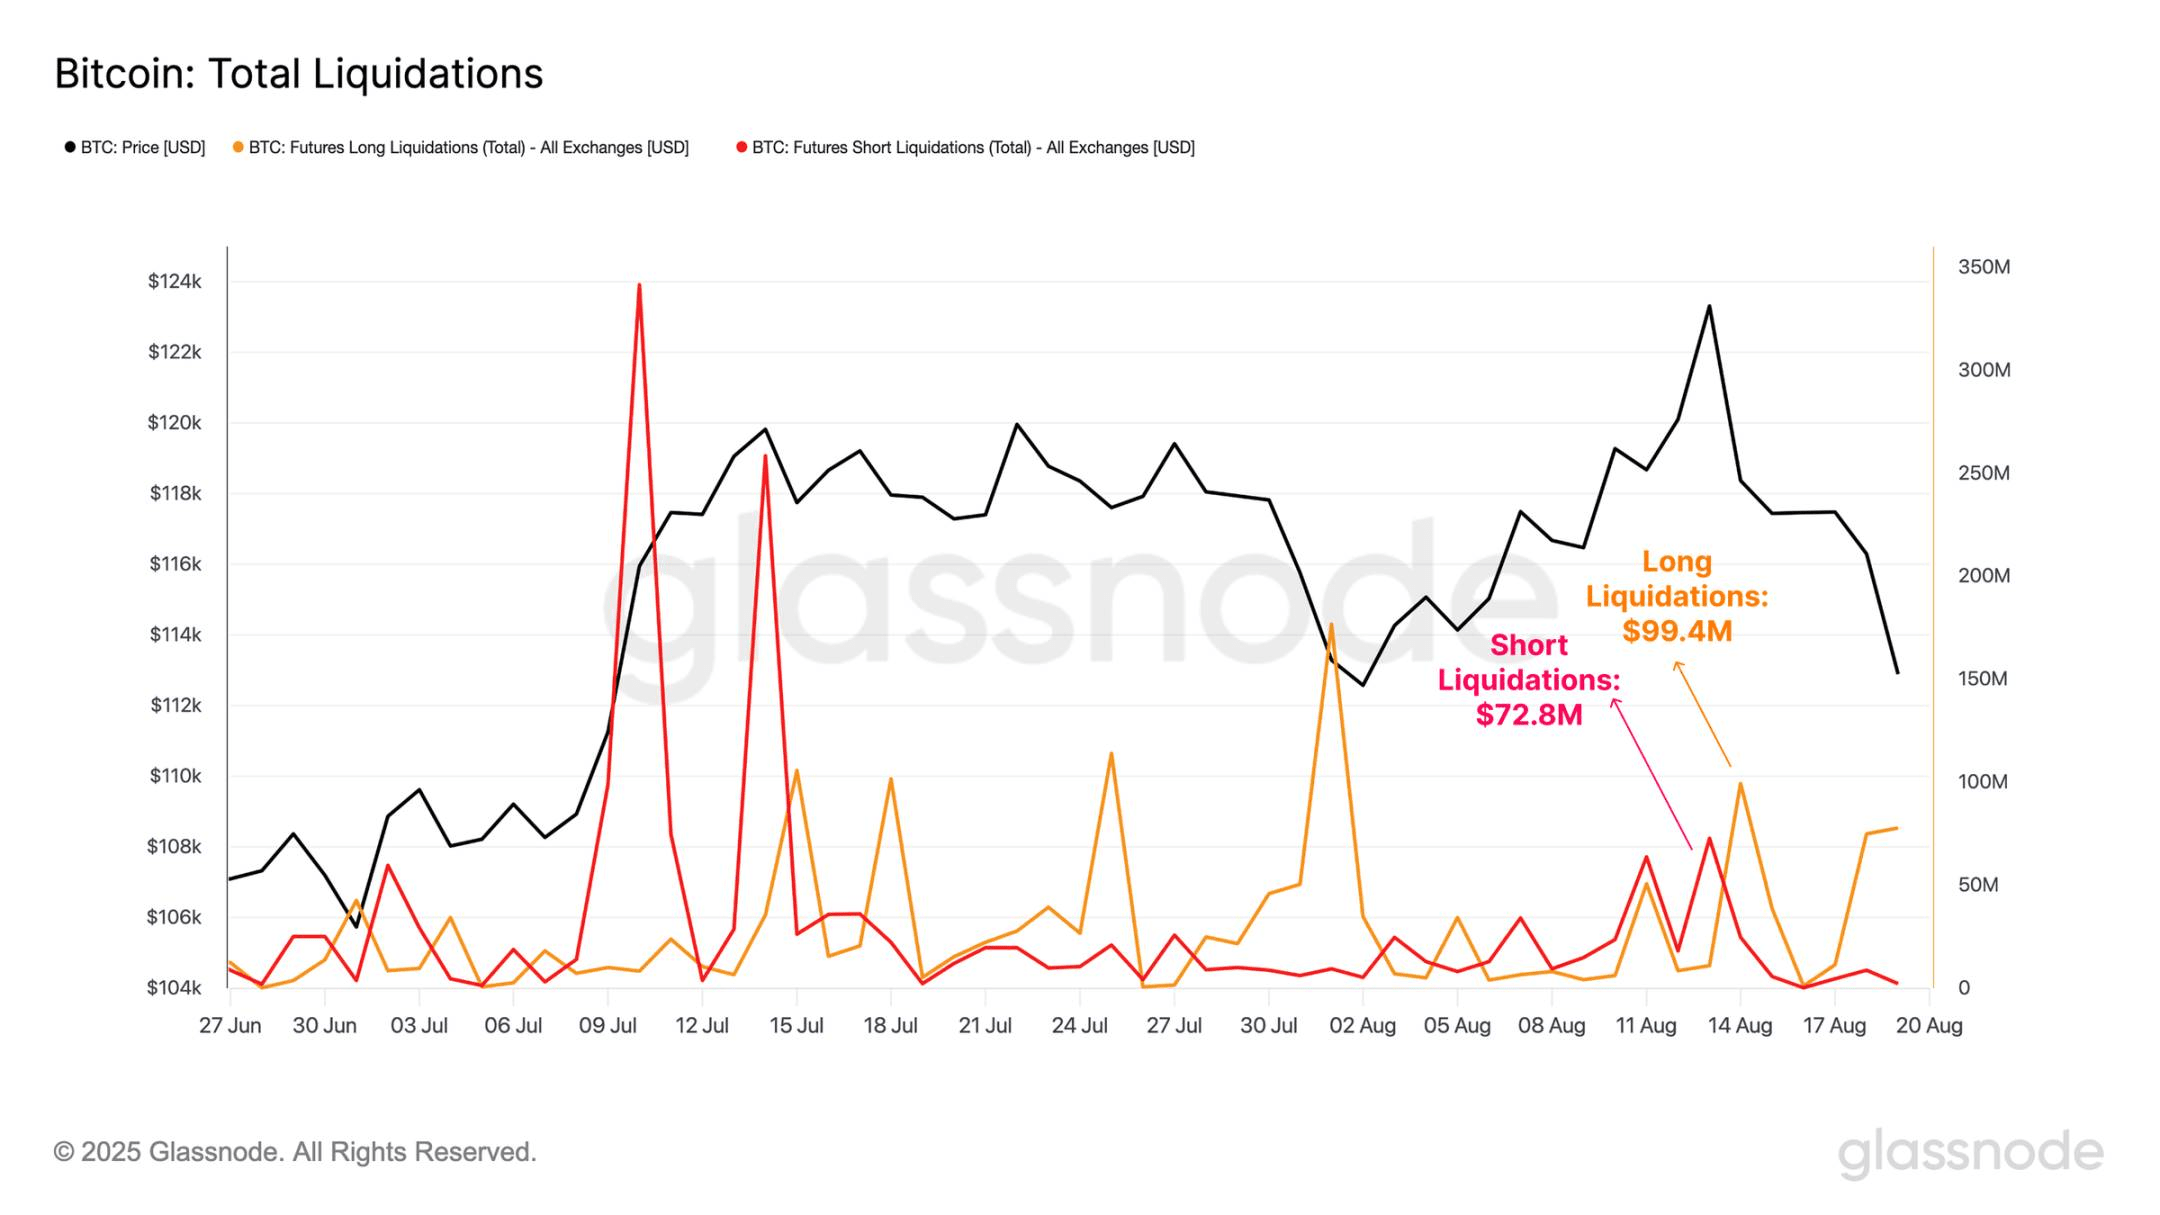
Upon further exploration, we can assess the total scale of long and short liquidations during the period of historical peak formation and the subsequent price contraction.
Although liquidation volumes did indeed rise during these events, with short liquidations reaching $74 million during the historical peak and long liquidations hitting $99 million during the downtrend, these levels are clearly lower than those observed during similarly extreme price fluctuations earlier this year. This suggests that a significant portion of recent contract liquidations may have been voluntary and thus risk-managed, rather than driven by forced liquidations due to excessive leverage.
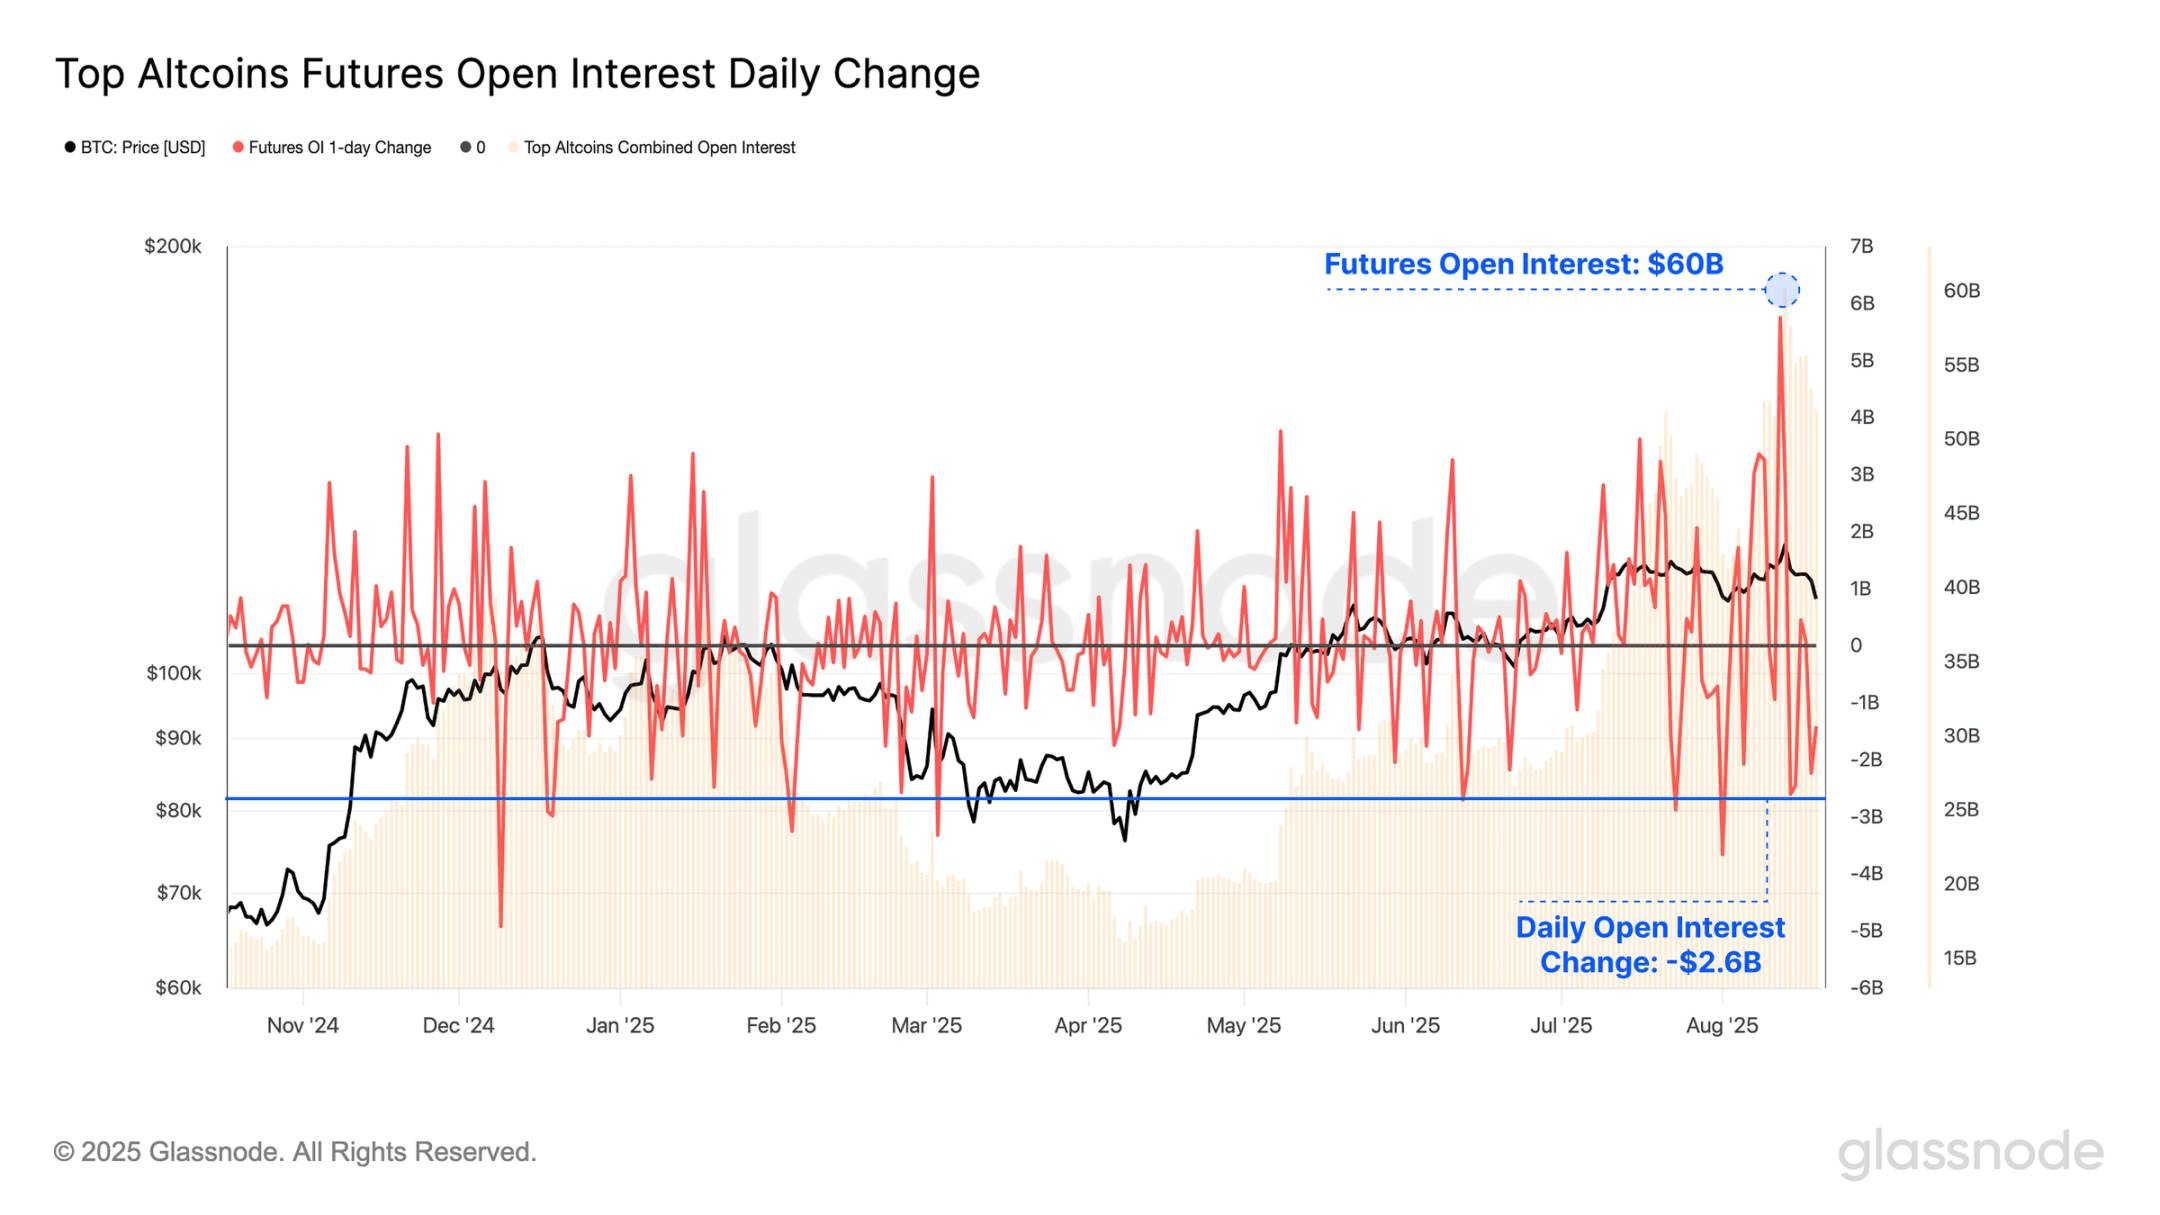
When we evaluate the futures open interest contracts of major altcoins (ETH, SOL, XRP, DOGE), we note that their total surged to a new all-time high of $60.2 billion last weekend. This is almost on par with the scale of open interest contracts for Bitcoin. However, this situation was short-lived, as the price retraced downwards, reducing open interest by $2.6 billion, marking the tenth largest drop on record.
These rapid fluctuations indicate that altcoins are currently attracting a significant amount of investor attention, significantly intensifying the reflexivity and fragility of the digital asset market.
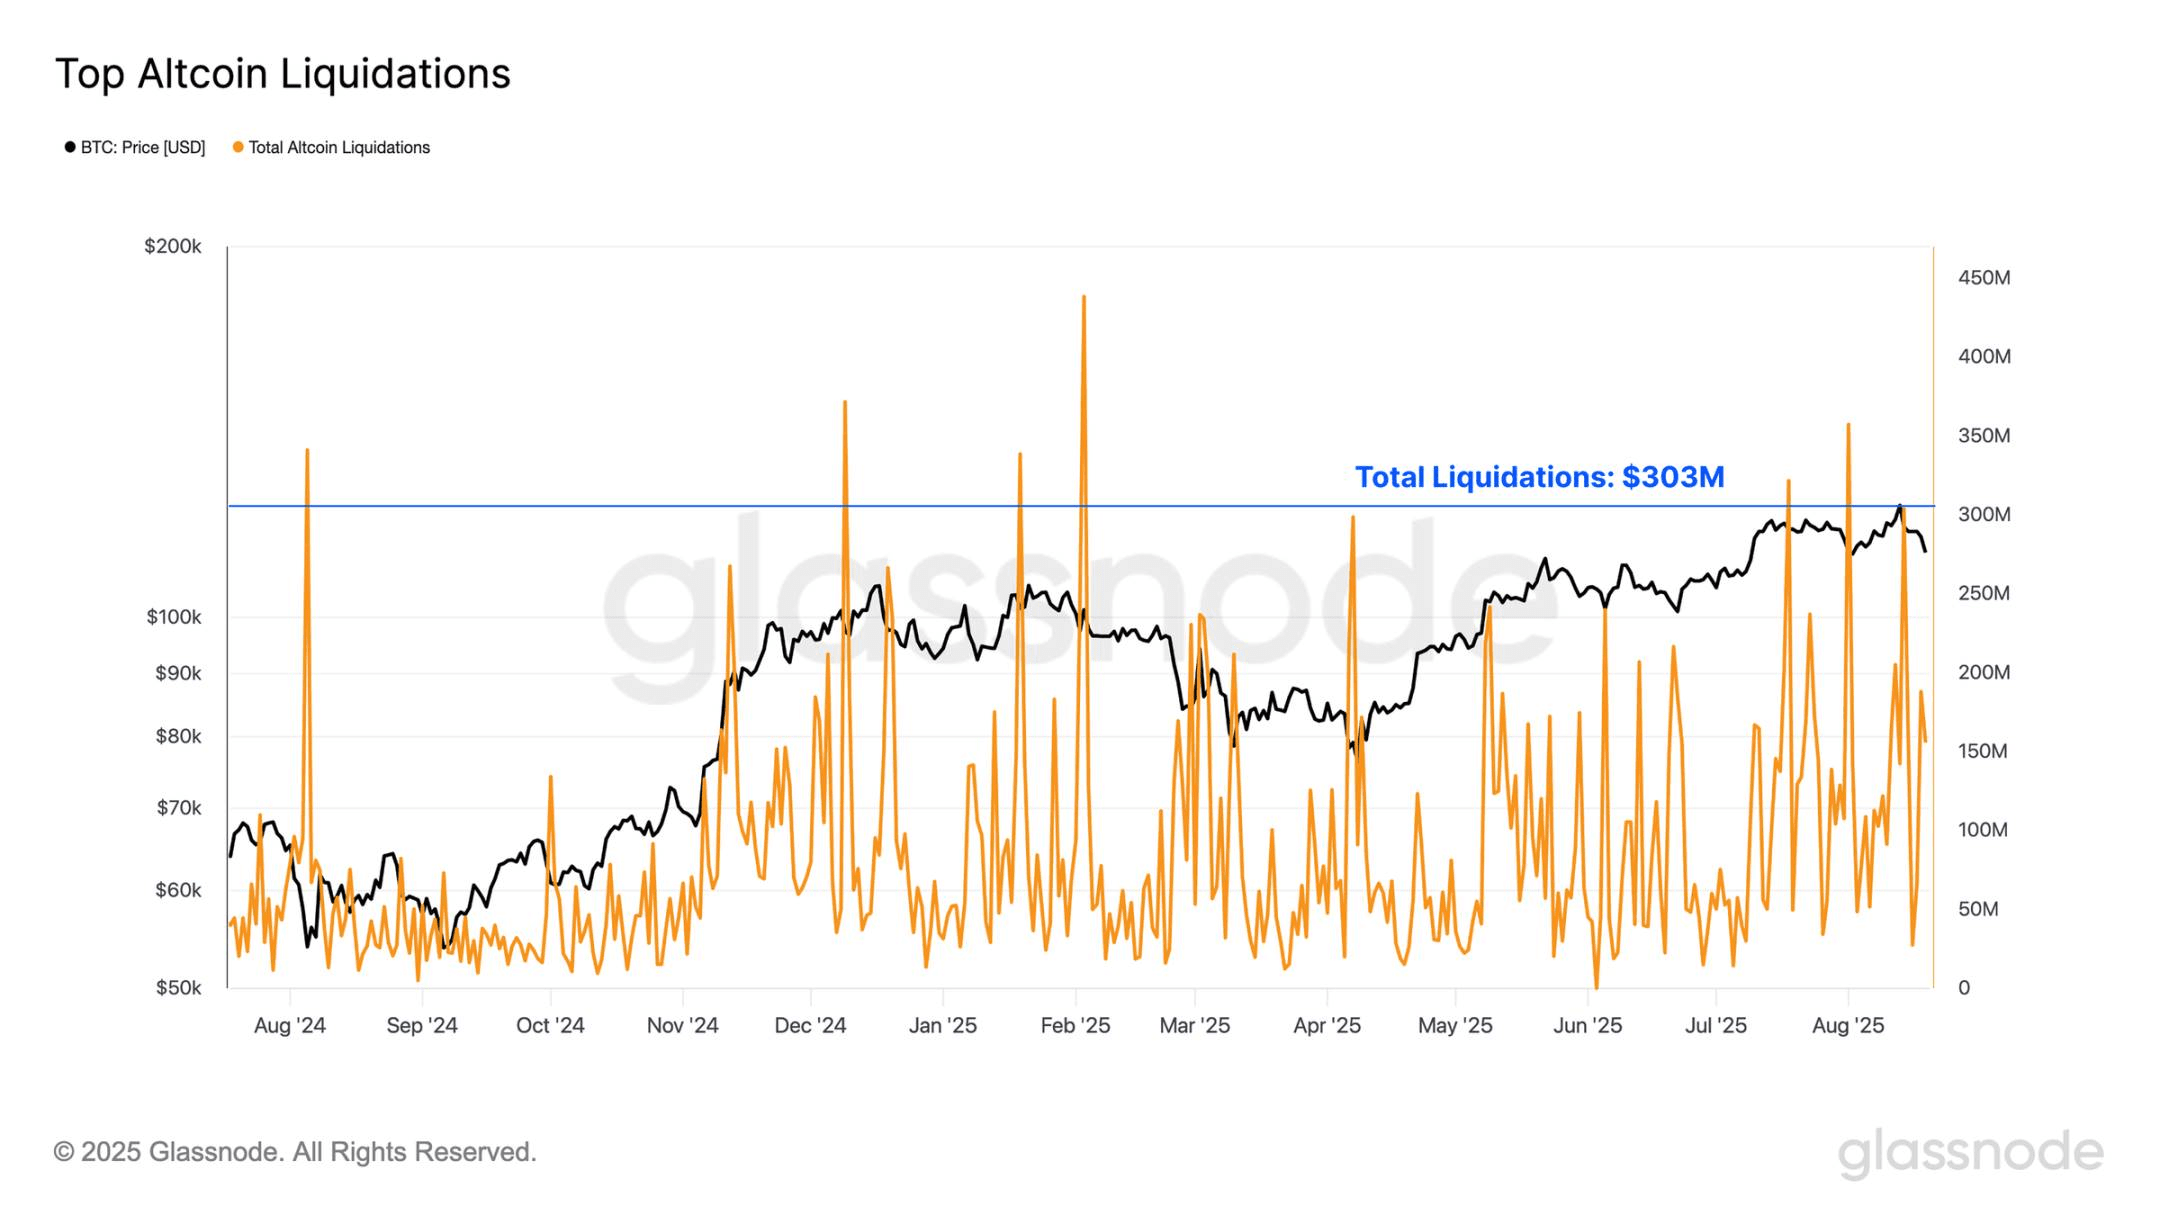
Additionally, the total liquidation volume of mainstream altcoins has recently been quite high, peaking at $303 million per day, and the liquidation volume experienced is more than twice that of the Bitcoin futures market.
Moreover, the scale of liquidations from last weekend now ranks as the 15th largest on record, indicating an increased willingness to take leveraged exposure in the altcoin space.
Increased speculation
For years, Ethereum has often been viewed as a bellwether asset, with its strong performance periods typically correlating with the broader 'altcoin season' in the digital asset market.
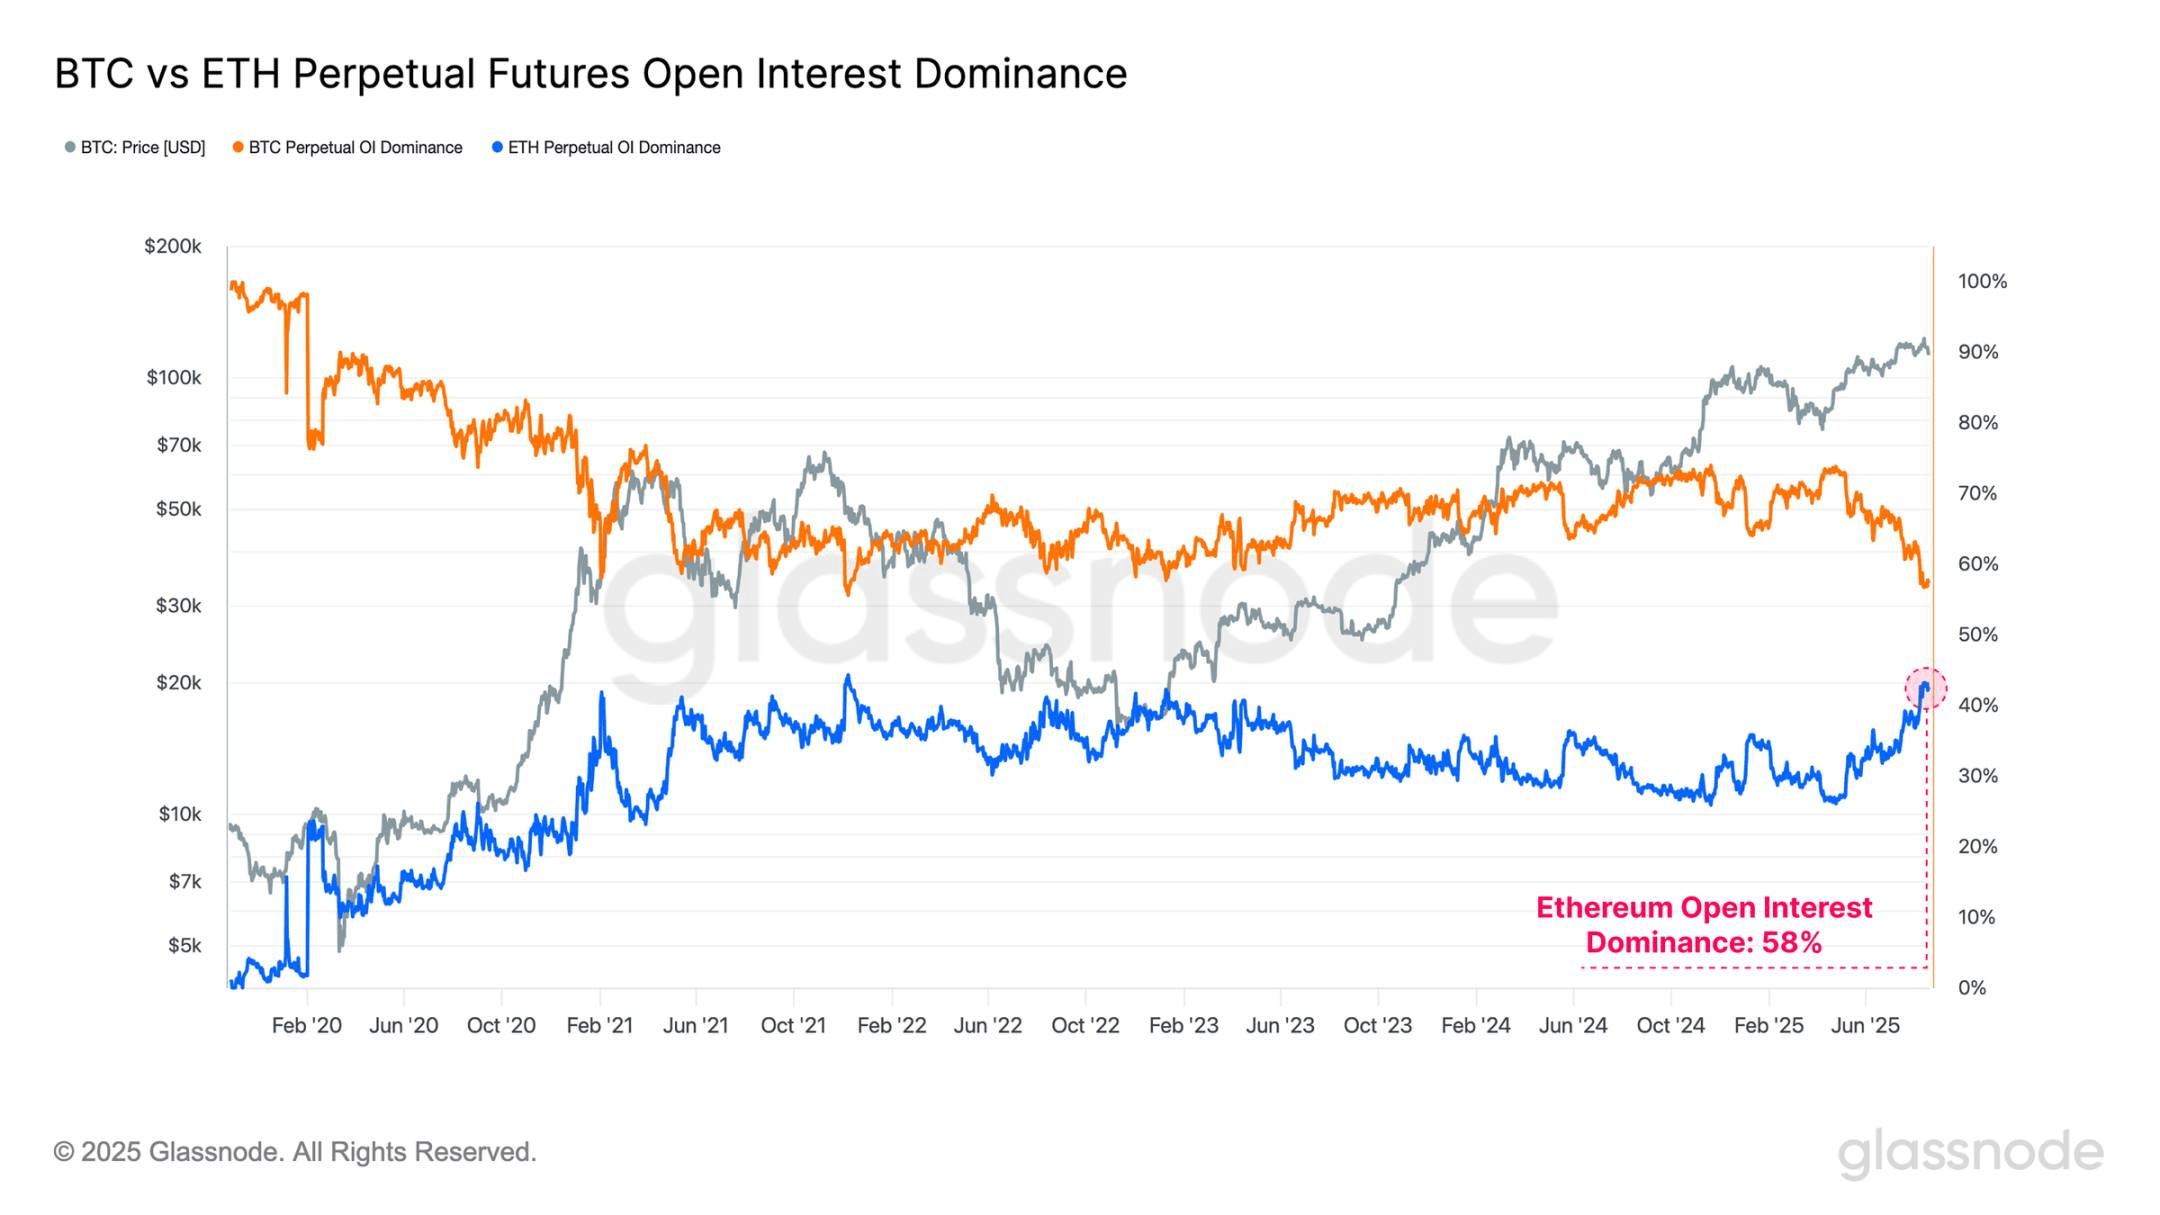
This relationship can also be observed through the open interest dominance between Bitcoin and Ethereum, reflecting changes in market participants' risk preferences. As it stands;
Bitcoin open interest dominance: 56.7%
Ethereum open interest dominance: 43.3%
Ethereum's open interest share has recently been rapidly climbing, indicating a significant shift in market attention towards the further areas of the risk curve. Notably, Ethereum's open interest dominance has reached the fourth highest level on record, highlighting a significant increase in speculative activity. It is important to note that as the second largest digital asset, Ethereum is one of the few assets capable of absorbing institutional-scale funds.
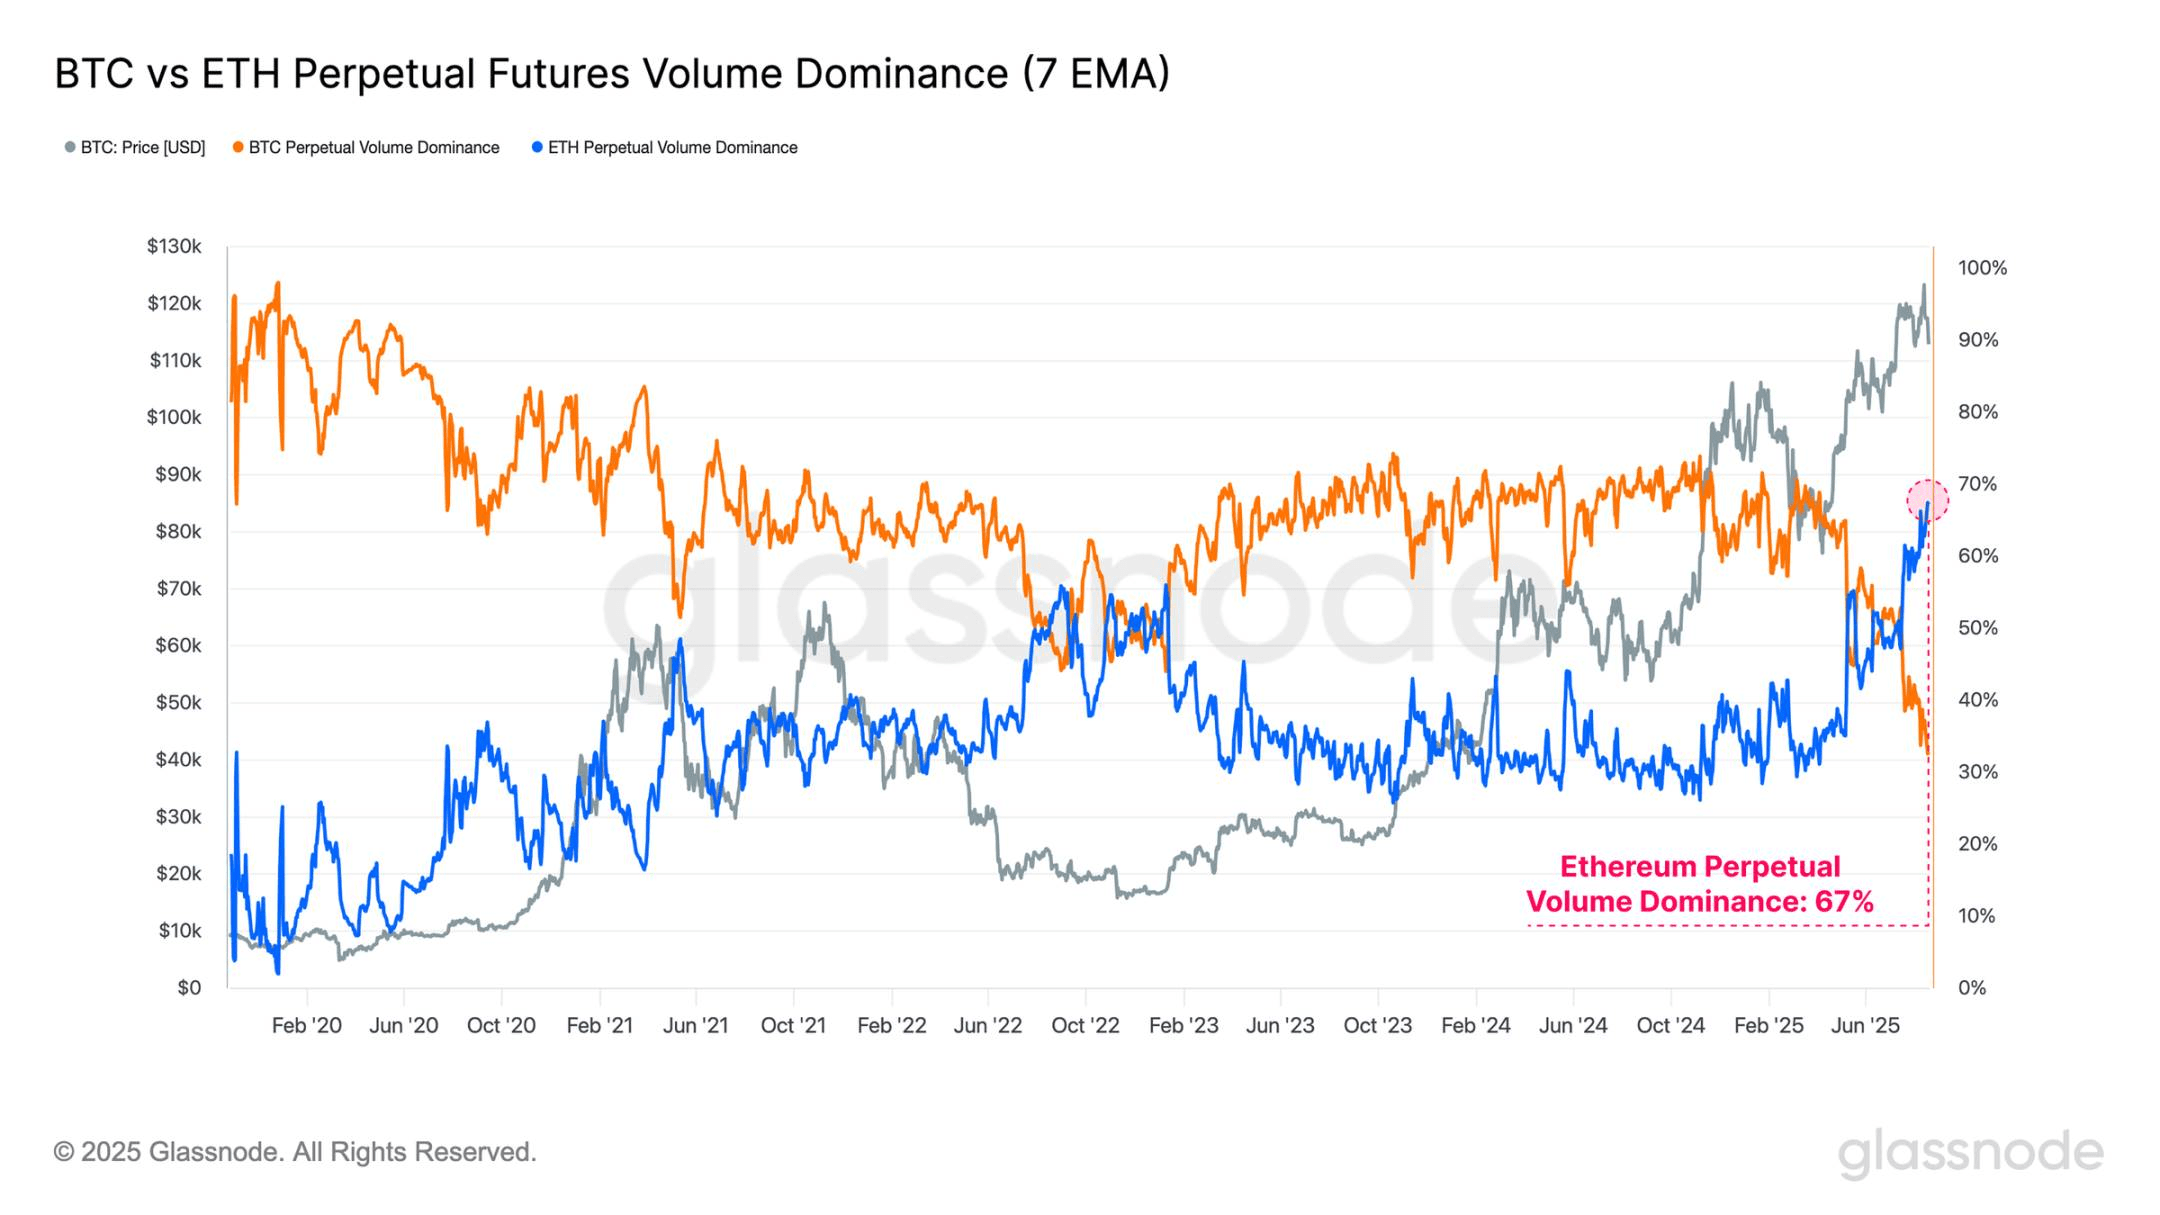
When viewed from the perspective of trading volume, this trend becomes even more astonishing. Ethereum's perpetual futures trading volume dominance has soared to a new all-time high of 67%, representing the strongest transition on record.
The significant rotation of trading activity reflects investors' growing attention towards the altcoin space and points to an acceleration of risk preferences within the current market cycle.
Crossroads
When we observe Bitcoin's performance from each cycle's low point, we can see that in the two periods of 2015-2018 and 2018-2022, the time to reach the historical peak was approximately 2-3 months later than the current point in time we are in.
While these are merely two examples preceding a mature cycle and are insufficient to assume that this synchrony will persist, they nonetheless represent noteworthy data points. This perspective is particularly relevant when considering the wave of on-chain profit-taking over the past two years, along with the high level of speculative activity visible in today's derivatives market.
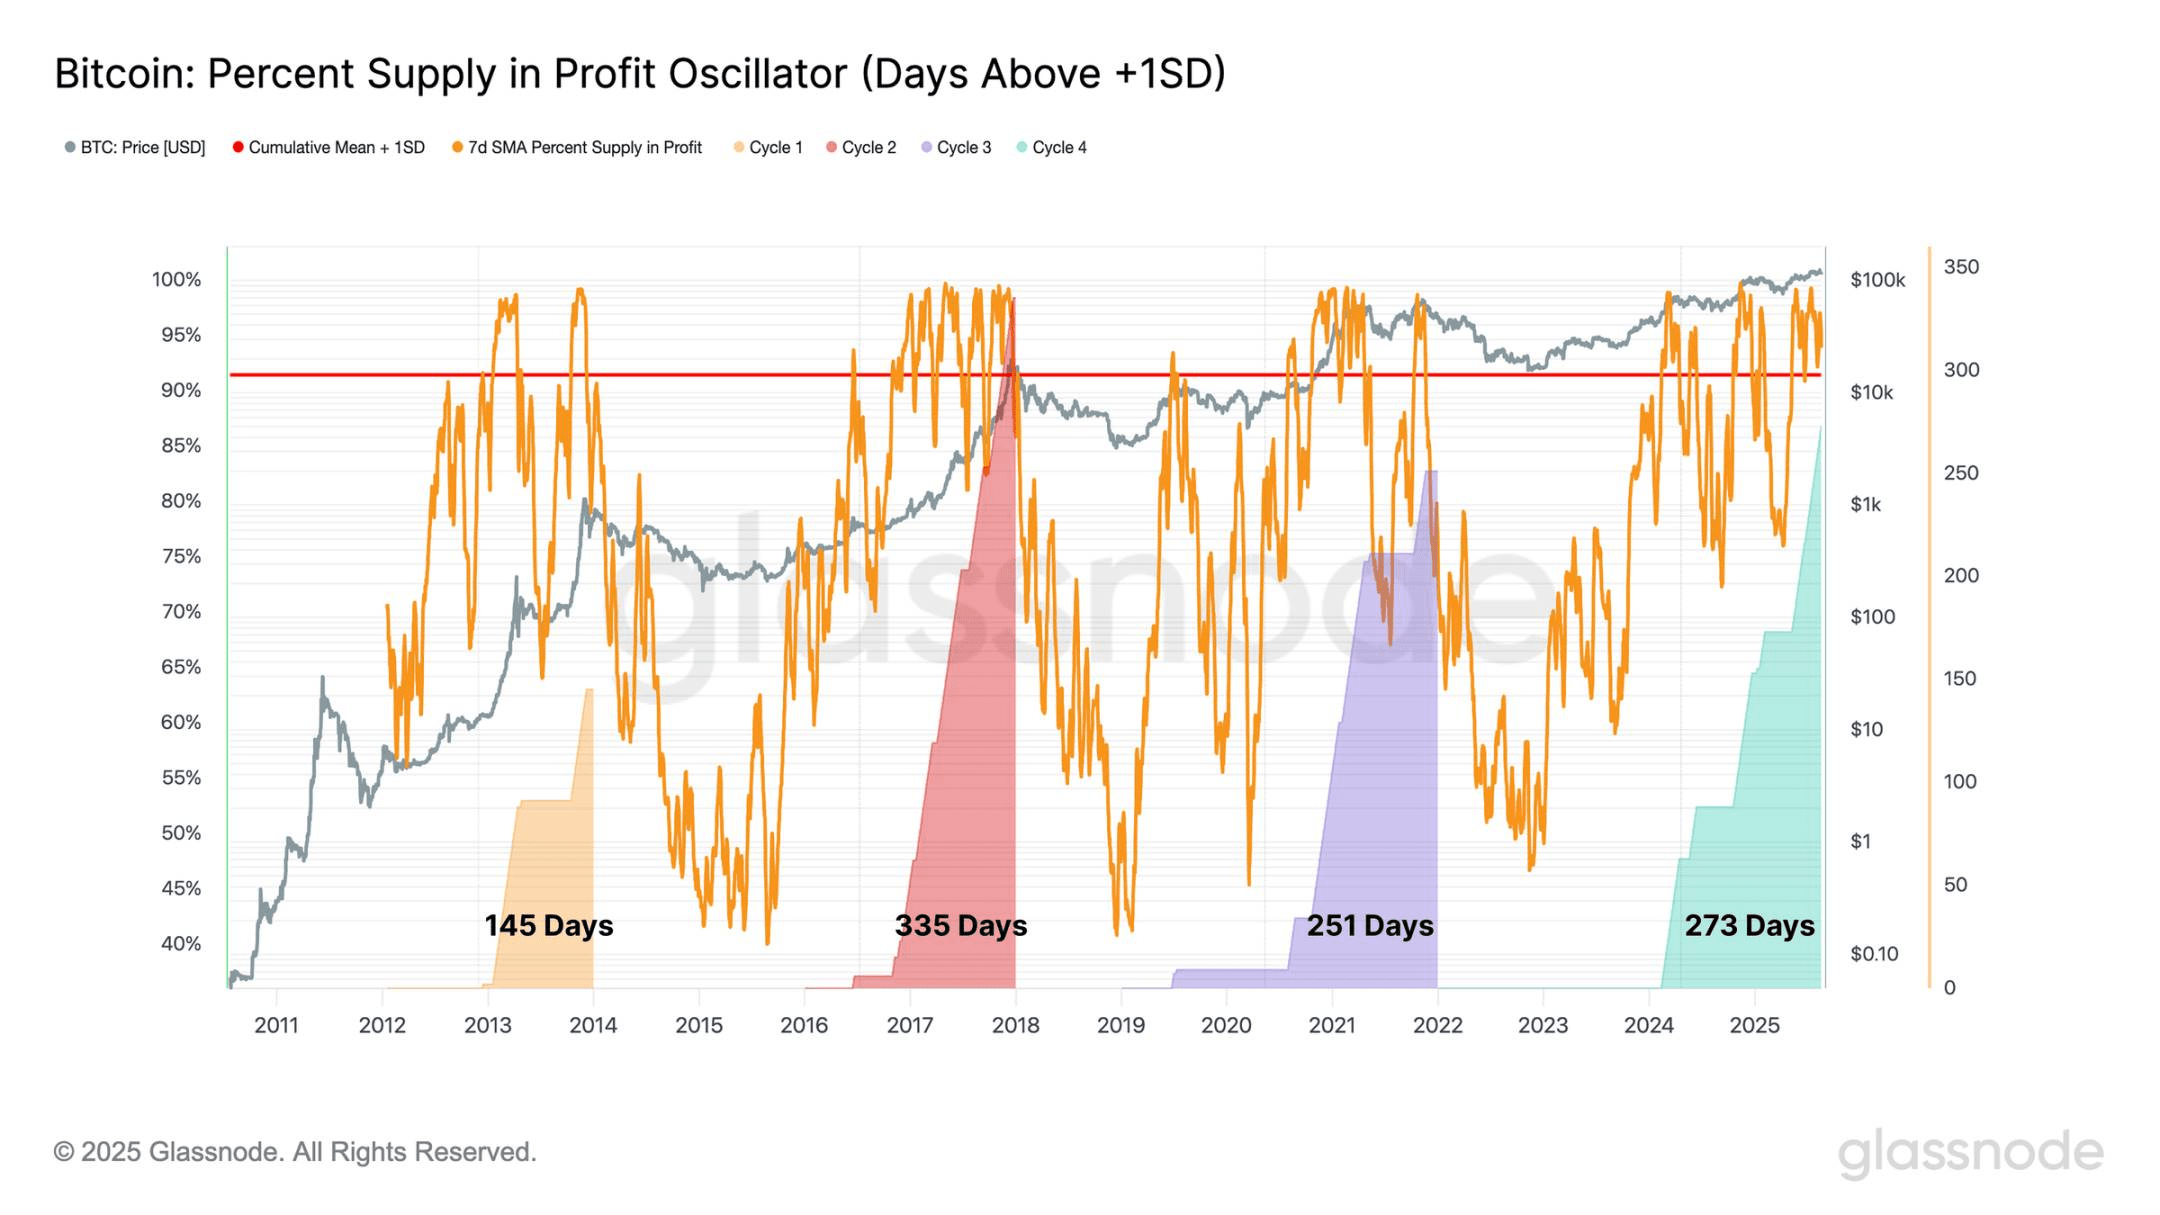
To further support this observation, we can look at the duration during which the percentage of Bitcoin's circulating supply remains above +1 standard deviation in each cycle.
In the current cycle, this period has now extended to 273 days, making it the second longest on record, only behind the 335 days of the 2015-2018 cycle. This indicates that when measured from the perspective of the majority of supply held at a profit, the duration of the current cycle is comparable to previous cycles.
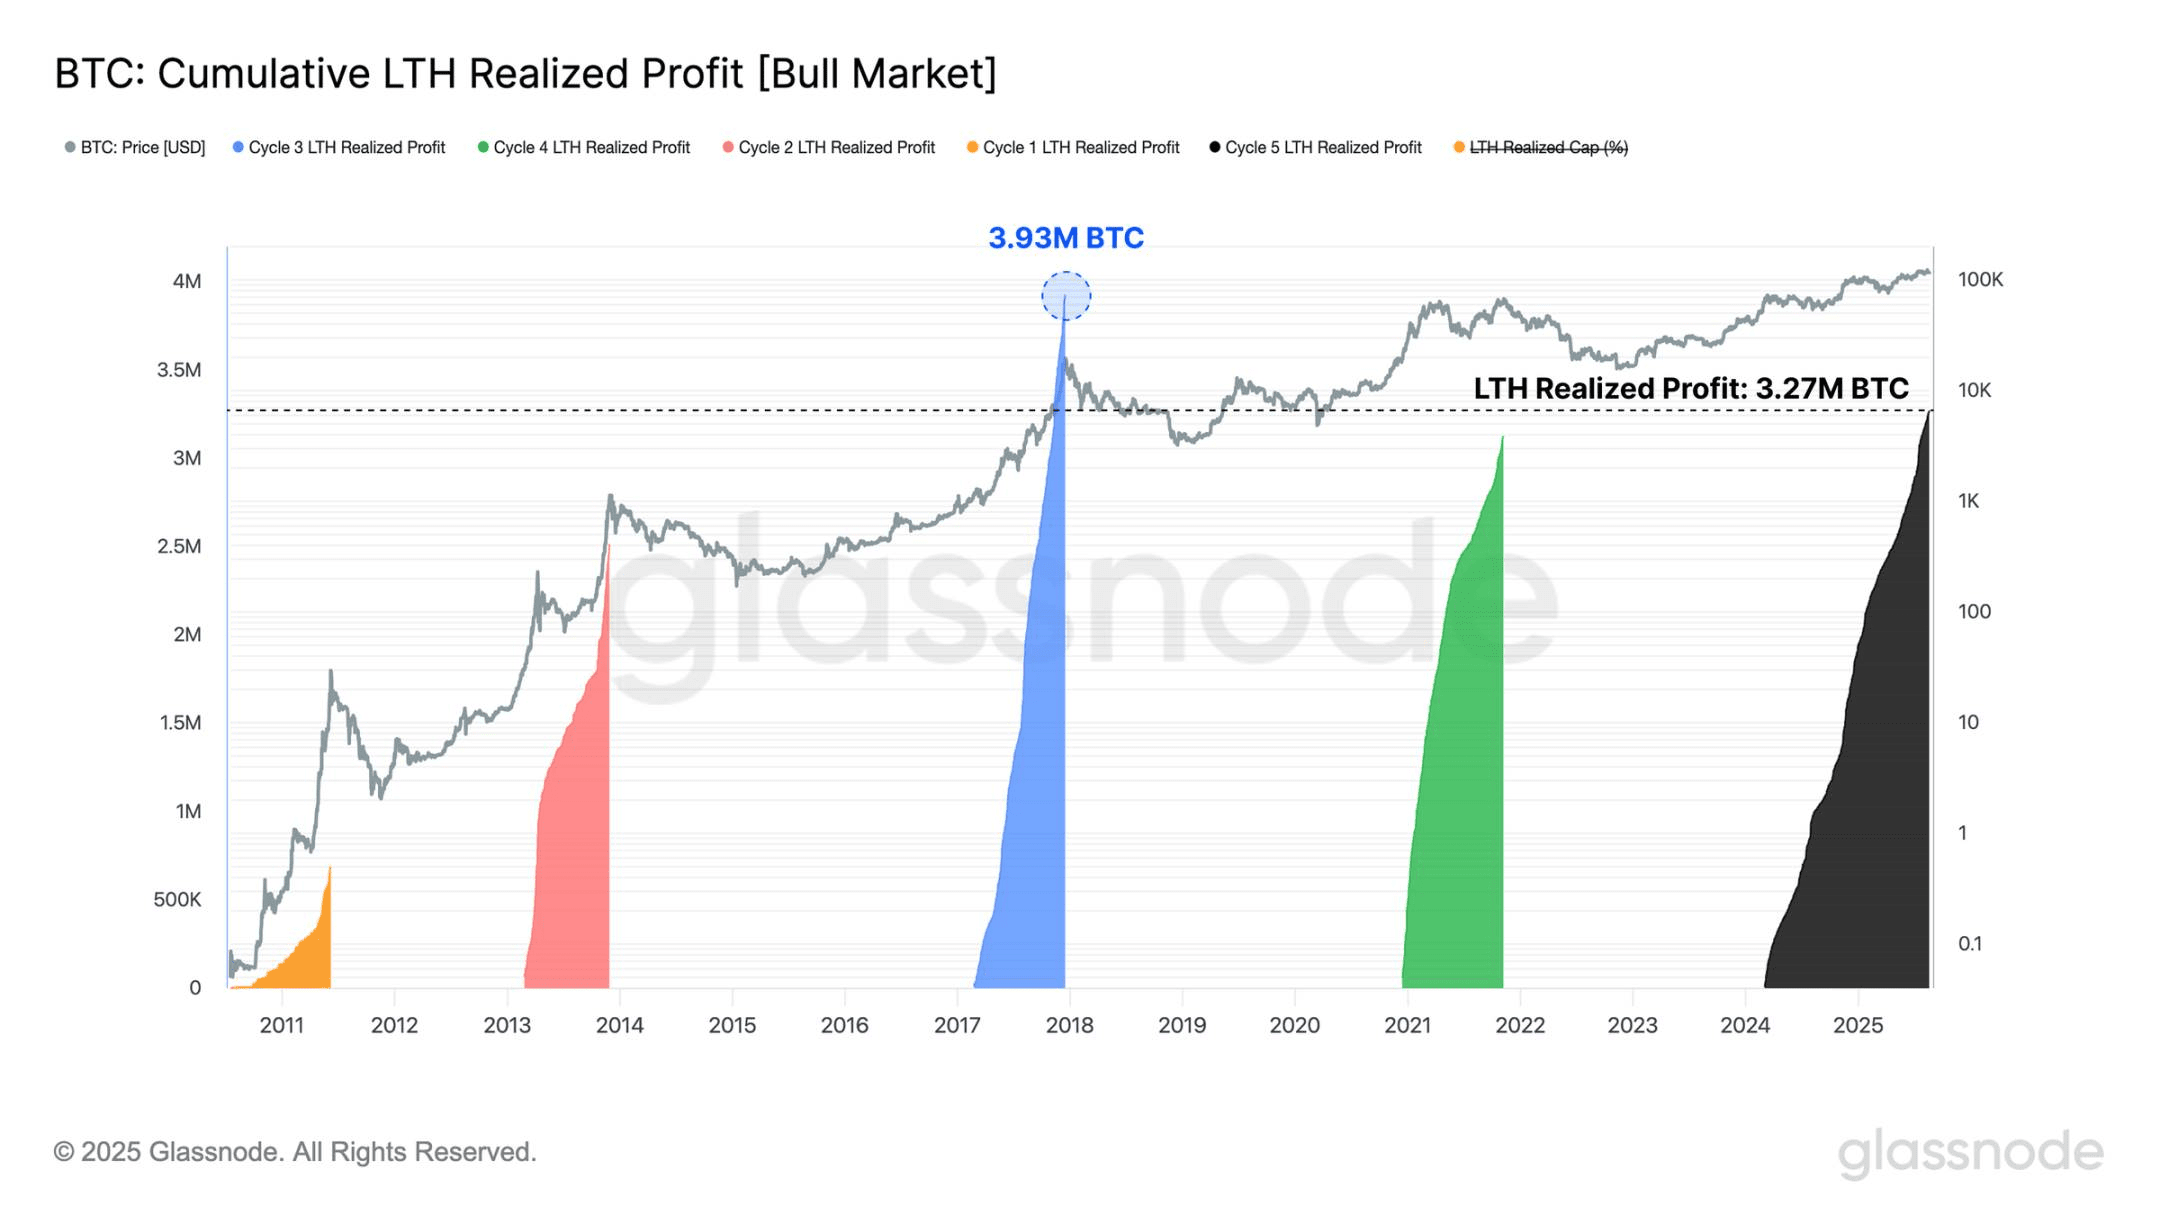
We can also measure the cumulative profits realized by long-term holders from the time new cycle historical peaks are reached until the cycle's ultimate peak. From this perspective, we find that the long-term holder group (usually most active at cycle extremes) has realized more profits than all previous cycles except one (the 2016-2017 cycle).
This observation aligns with previous indicators, adding another dimension from the perspective of selling pressure. Collectively, these signals reinforce the view that the current cycle is in its historical late phase.
However, each cycle has its own characteristics and does not guarantee that market behavior will follow this fixed time pattern.
Nevertheless, these dynamics raise an interesting question. Is the traditional four-year cycle still valid, or are we witnessing its evolution? These questions will be answered in the coming months.
Bitcoin's capital inflow shows signs of weakness, even as prices hit a new historical peak of $124,400, indicating that demand is decreasing. This slowing willingness coincides with a surge in speculative positions, as the total open interest for major altcoins briefly reached a historical high of $60 billion, before retracing and decreasing by $2.5 billion.
Long regarded as a bellwether for 'altcoin season,' Ethereum is once again at the forefront of this cycle. Its open interest dominance has climbed to the fourth highest level on record, while perpetual futures trading volume dominance has soared to a new all-time high of 67%, marking the strongest structural shift to date.
From a cyclical perspective, Bitcoin's price movements also echo prior patterns. In the two cycles of 2015-2018 and 2018-2022, the time to reach historical peaks from the cycle lows was only 2-3 months later than the current time point we find ourselves in. Meanwhile, the realized profit levels of long-term holders are comparable to those seen in past market frenzy phases, reinforcing the impression that the market is in a late-cycle phase.
Overall, these signals highlight increased leverage, profit-taking, and intensified speculation, all of which are characteristics of historically mature market stages. However, each cycle has its own characteristics and does not guarantee that Bitcoin and the broader market will follow a fixed timeline.
BTC ETH


