
Today, we will discuss the core functionality in our product from the perspective of a beginner — the K-line chart! This is a 'must-have course' in cryptocurrency trading, its importance goes without saying~
First, you need to know where to view the K-line. Open the homepage, click on 'Market' at the bottom, and the K-line for the cryptocurrency you are interested in will appear. You can also use the cryptocurrency filter we discussed in the previous beginner's session; it's like reviewing old knowledge~ Friends, do you remember this feature?
Find 'Condition Filter' on the homepage, and below you will see the cryptocurrency strategies we have saved. Today we will use the 'Spot Trading Volume Selection Method', which is a preset strategy, just use it directly~ For those who don't understand custom parameters, feel free to check the previous live replay for a refresher~ The main package is here to 'feed' knowledge to beginners today.
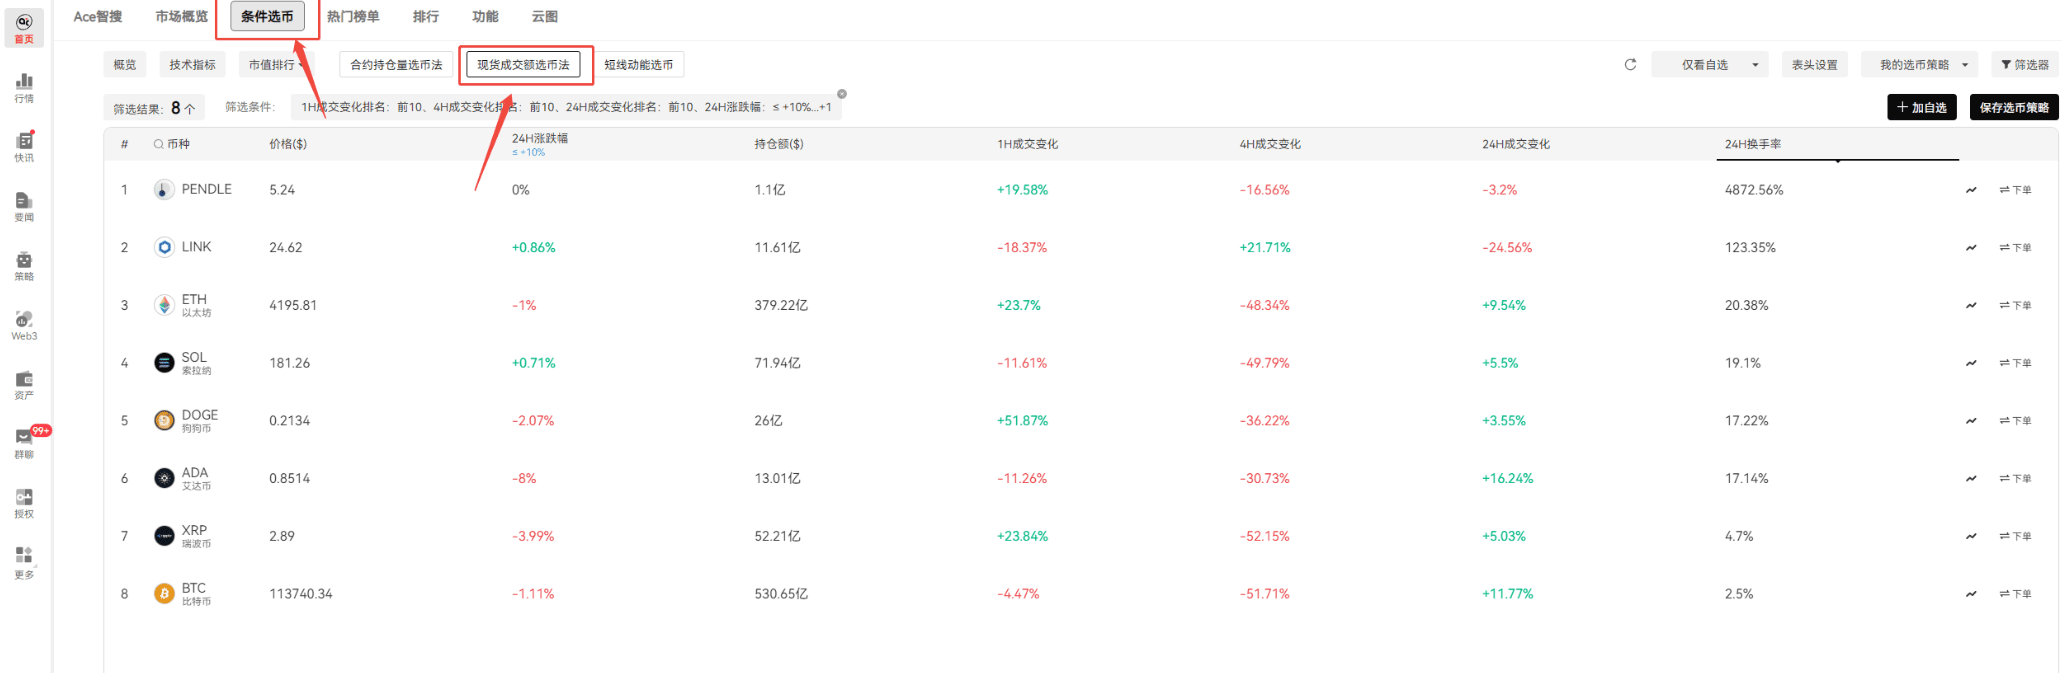
After using this strategy to filter, the cryptocurrencies that meet the criteria will be displayed here. You can select one at random, for example, BTC, click the 'Order' on the right, and options for spot and contract trading will appear. Spot trading cannot be leveraged, so let's try the contract trading~ After that, it will redirect to the market interface.
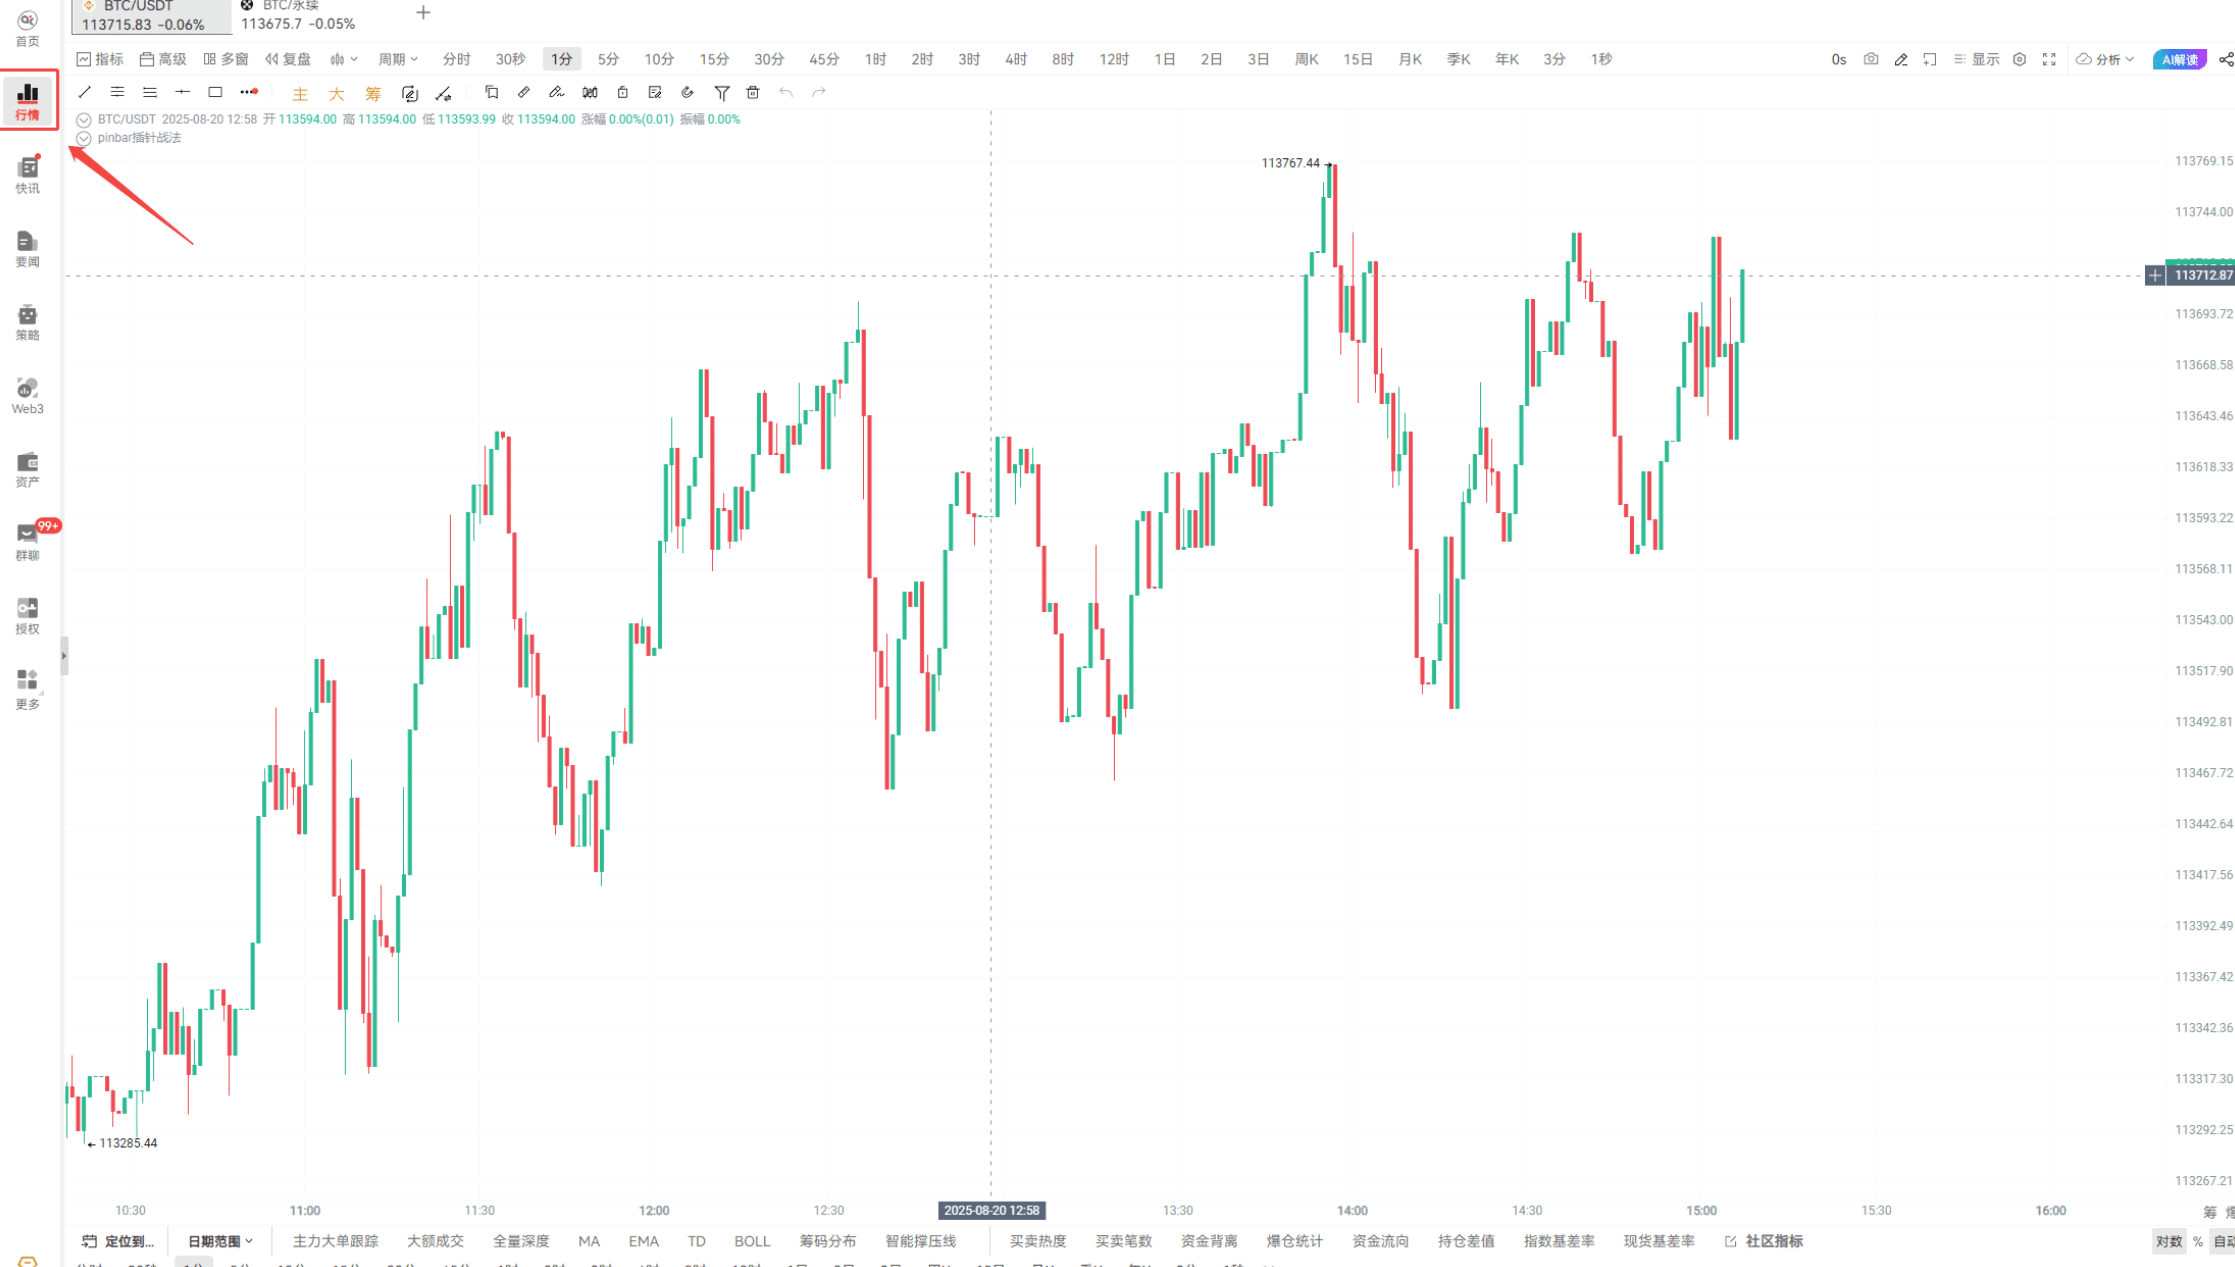
This is the K-line chart, we will explain it clearly from top to bottom, and left to right~
At the very top are all the cryptocurrencies we are monitoring, clicking one will allow you to switch. Right now, we are looking at the BTC perpetual contract. Below, there is a dense list of entries~
First, look at 'Indicators'; the MA (20), MACD we discussed in the last class can be selected here.

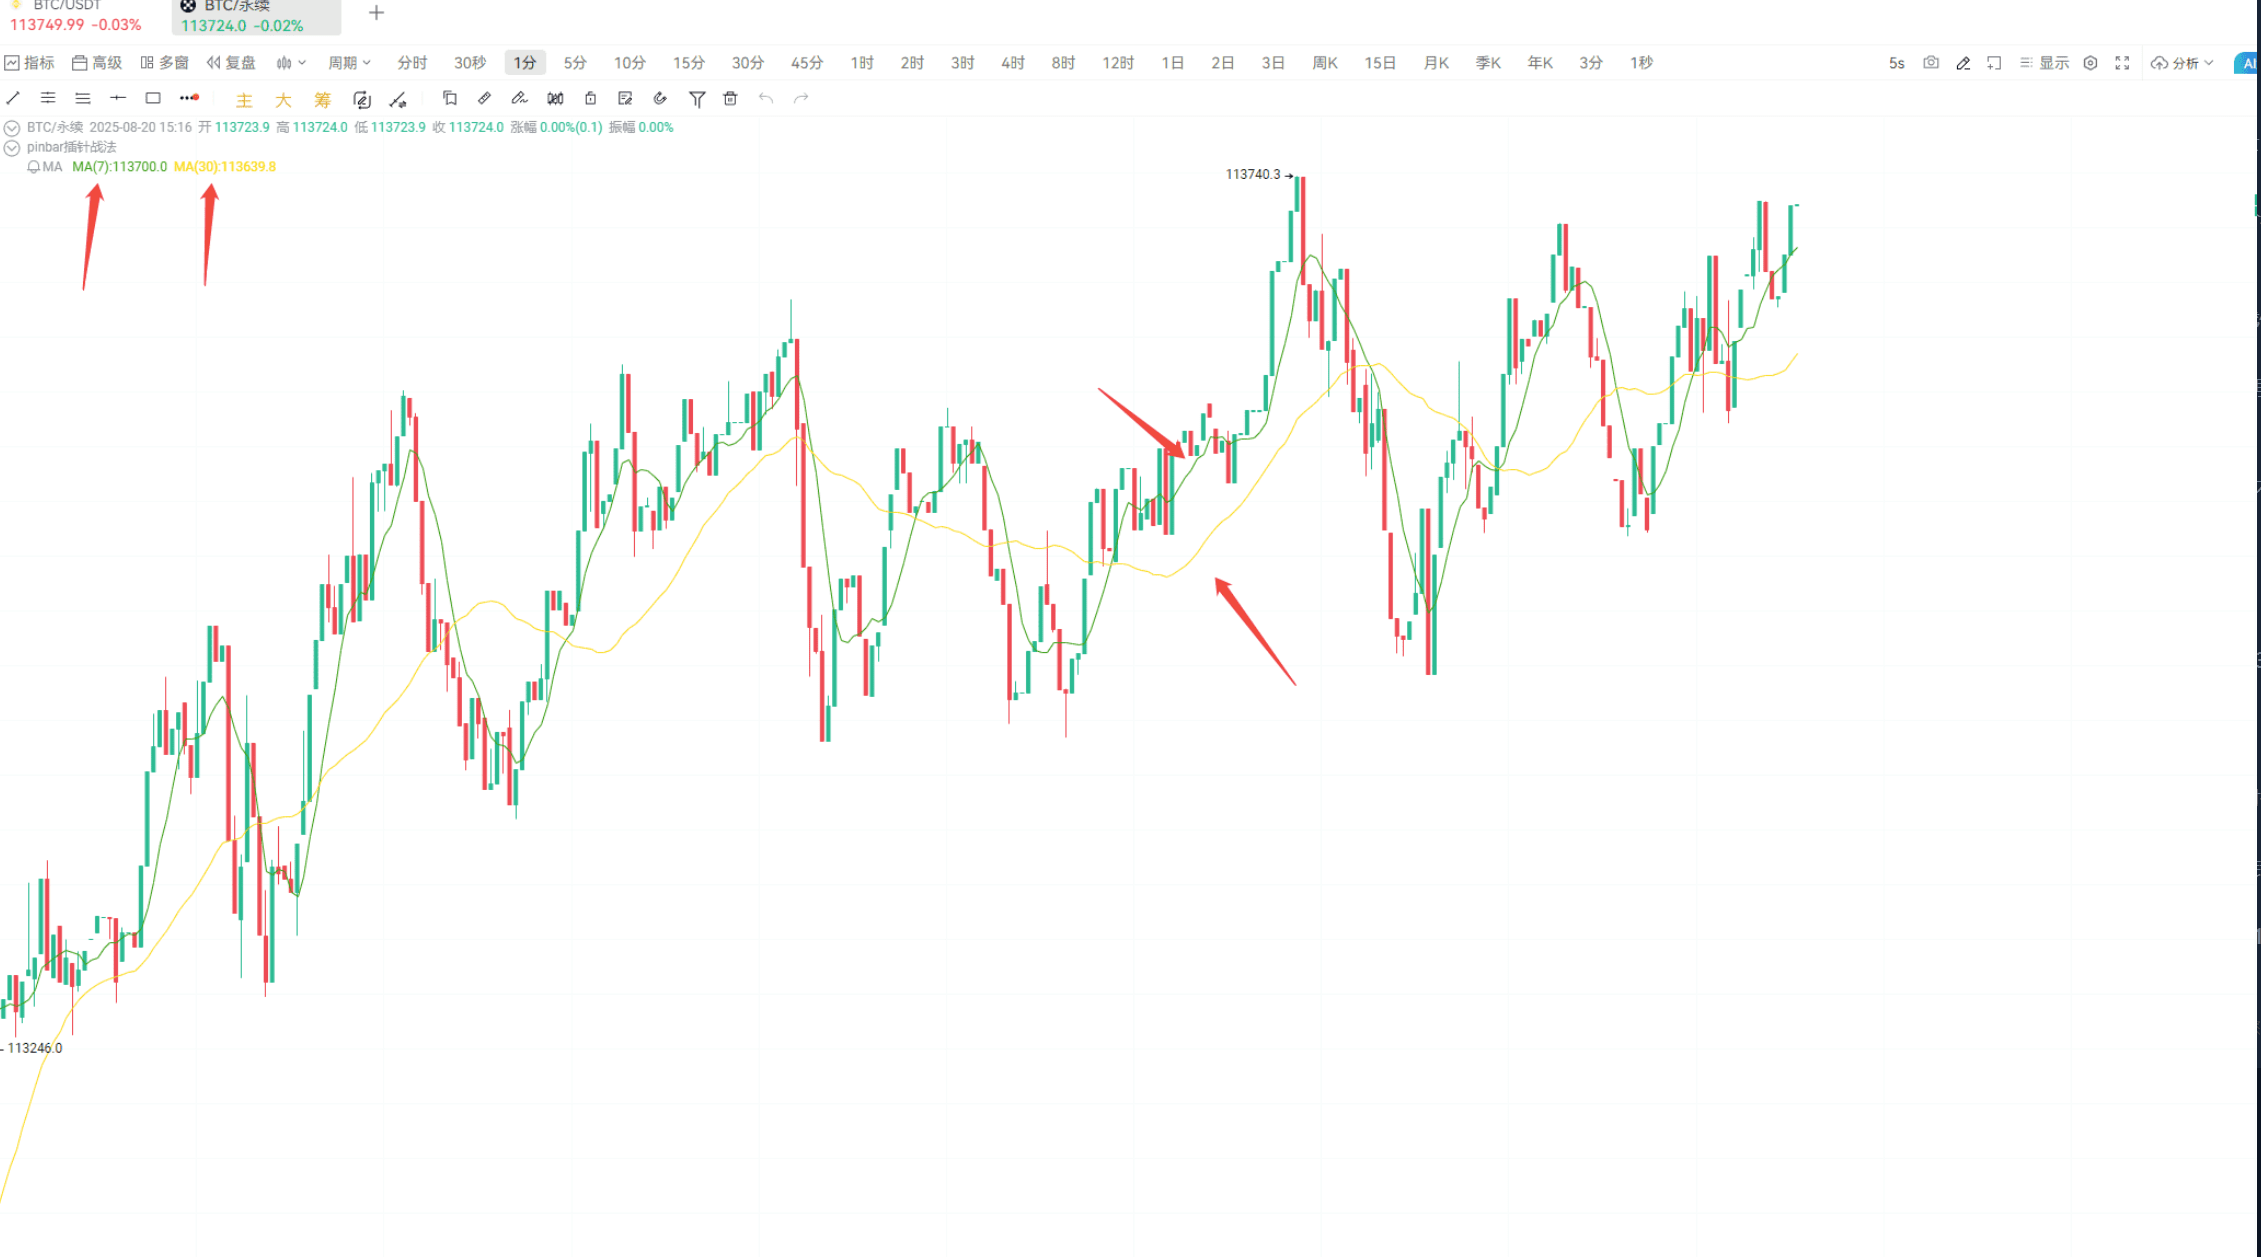
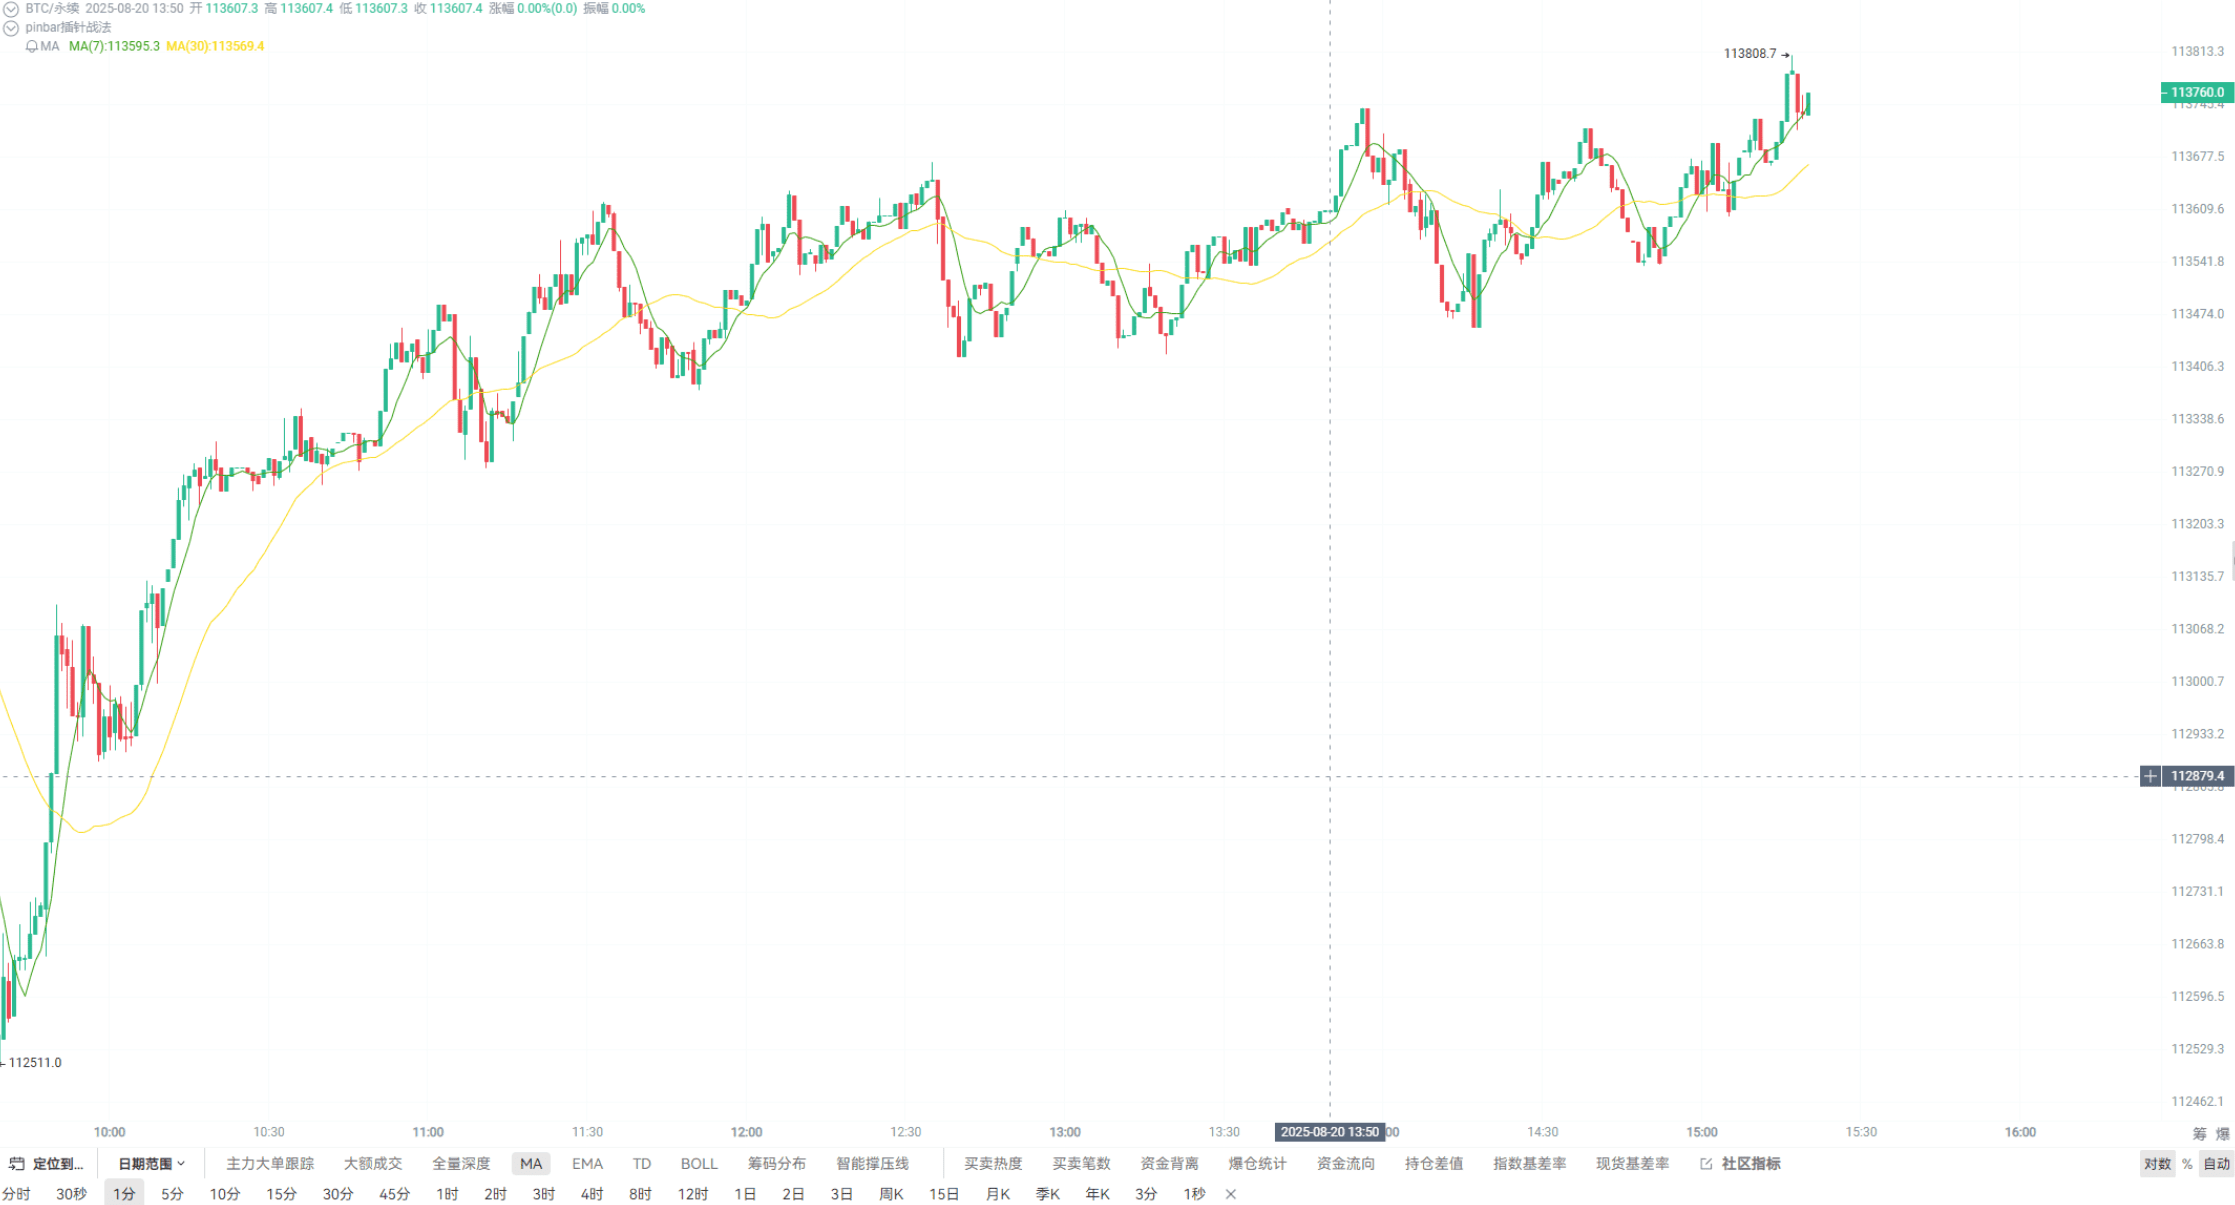
Let's first select an MA, using the default parameters MA (7, 30), no adjustments for now (feel free to adjust manually if you want). These represent the 7-day and 30-day moving averages respectively.
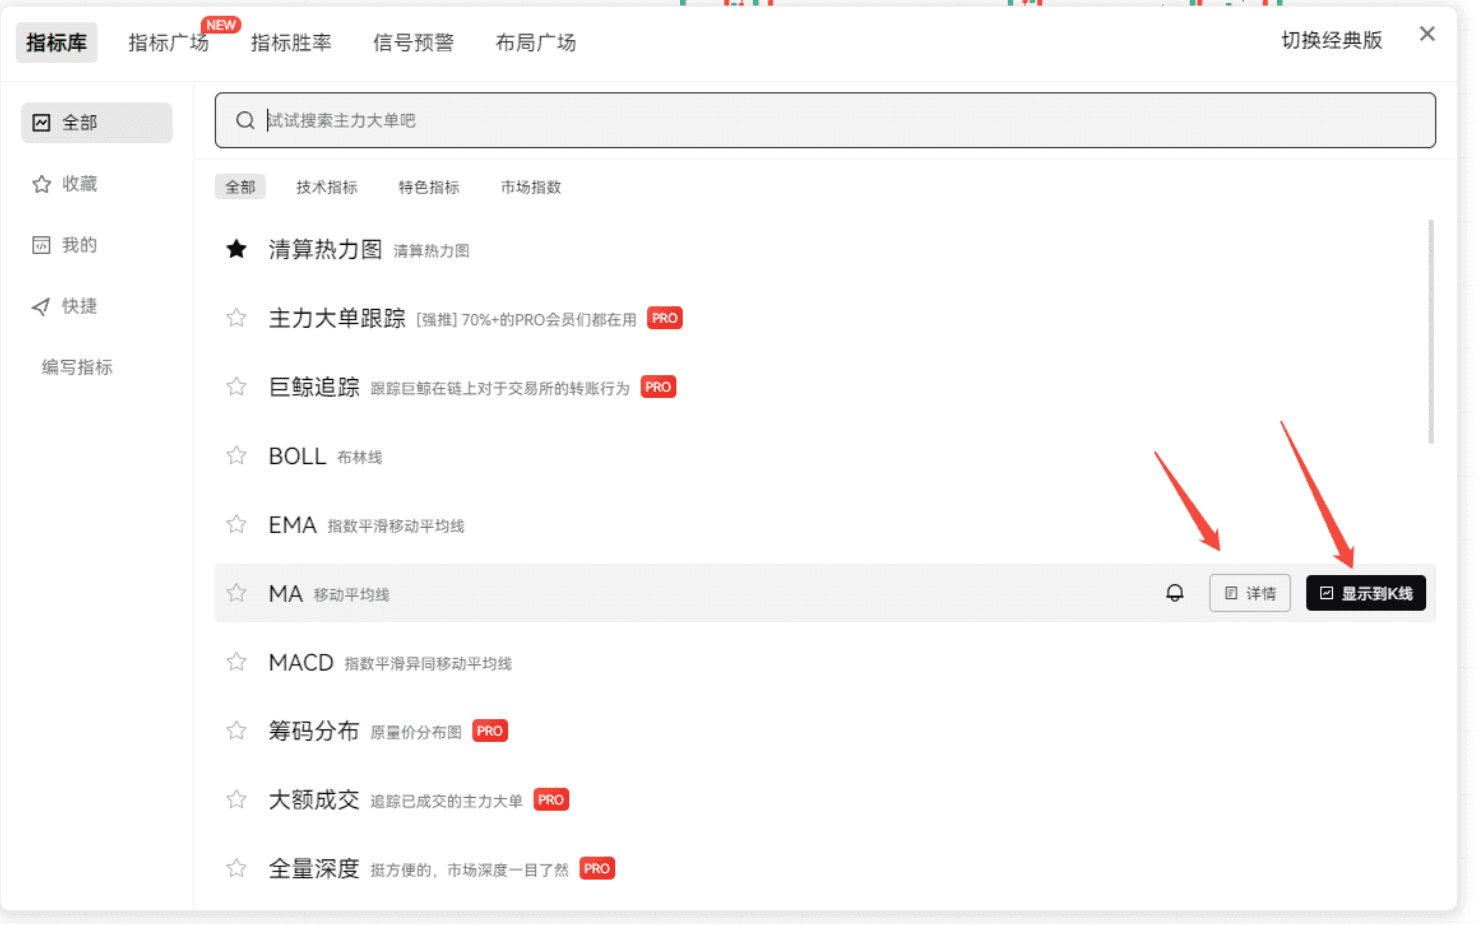
The chart will display yellow and green lines, corresponding to 30 days and 7 days, with the meaning of the colors labeled in the upper left corner~ The colors can be customized; set any color you like~
The entries next to the indicators can be skipped by novice friends, let's directly look at the far right 'Cycle'.

Except for the 45 minutes which is a VIP feature, other time periods can be switched, these times represent the duration of each square in the K-line chart. For example, selecting 1 minute means one red-green block represents the price movement within that minute~
Do you have any questions currently? If you all remain silent, I will assume you understand, hehe~ Looks like you all have potential! Let's continue, this line is the drawing function. Experienced users will use it to mark key points and trends, while beginners may use it less for now; if you want to know more, we can discuss it specifically later~
Next is the core K-line section.
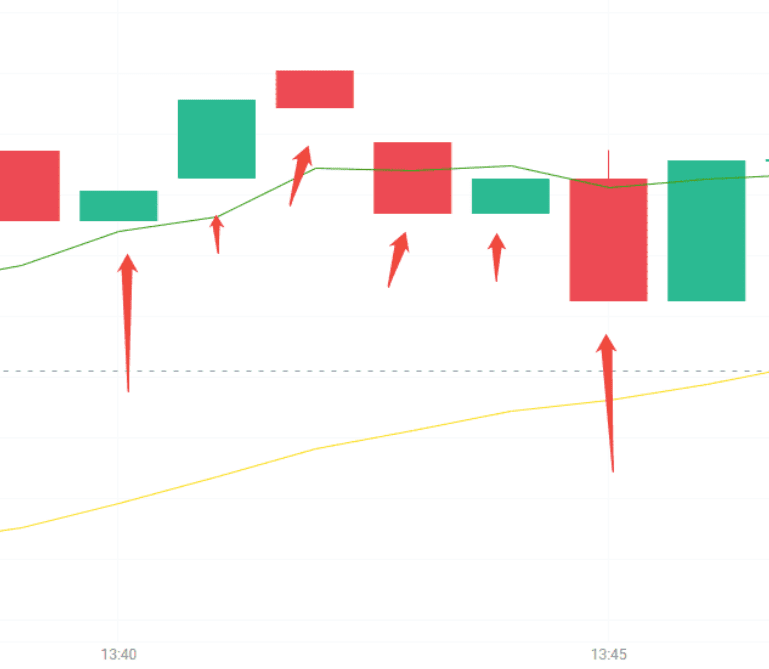
For beginners, viewing K-lines mainly involves watching for price increases and decreases~ The colors in our crypto circle are the opposite of A-shares, green indicates an increase and red indicates a decrease, so stock investors fear a sea of green, while for us, it might be a good thing, haha~
The MA indicator line selected earlier is also included in the price line, showing golden crosses and death crosses. Does everyone remember how to judge these? If you forget, I'll repeat it~ A golden cross occurs when the MA line crosses above the price line, usually indicating a bullish signal; a death cross occurs when the MA line crosses below the price line, usually indicating a bearish signal. Combining this K-line chart, you can see many intersection points corresponding to price movements, which showcases the usefulness of indicators~ However, different cryptocurrencies and long-term versus short-term will all affect the effectiveness of the indicators, so they should be used in conjunction with actual conditions~
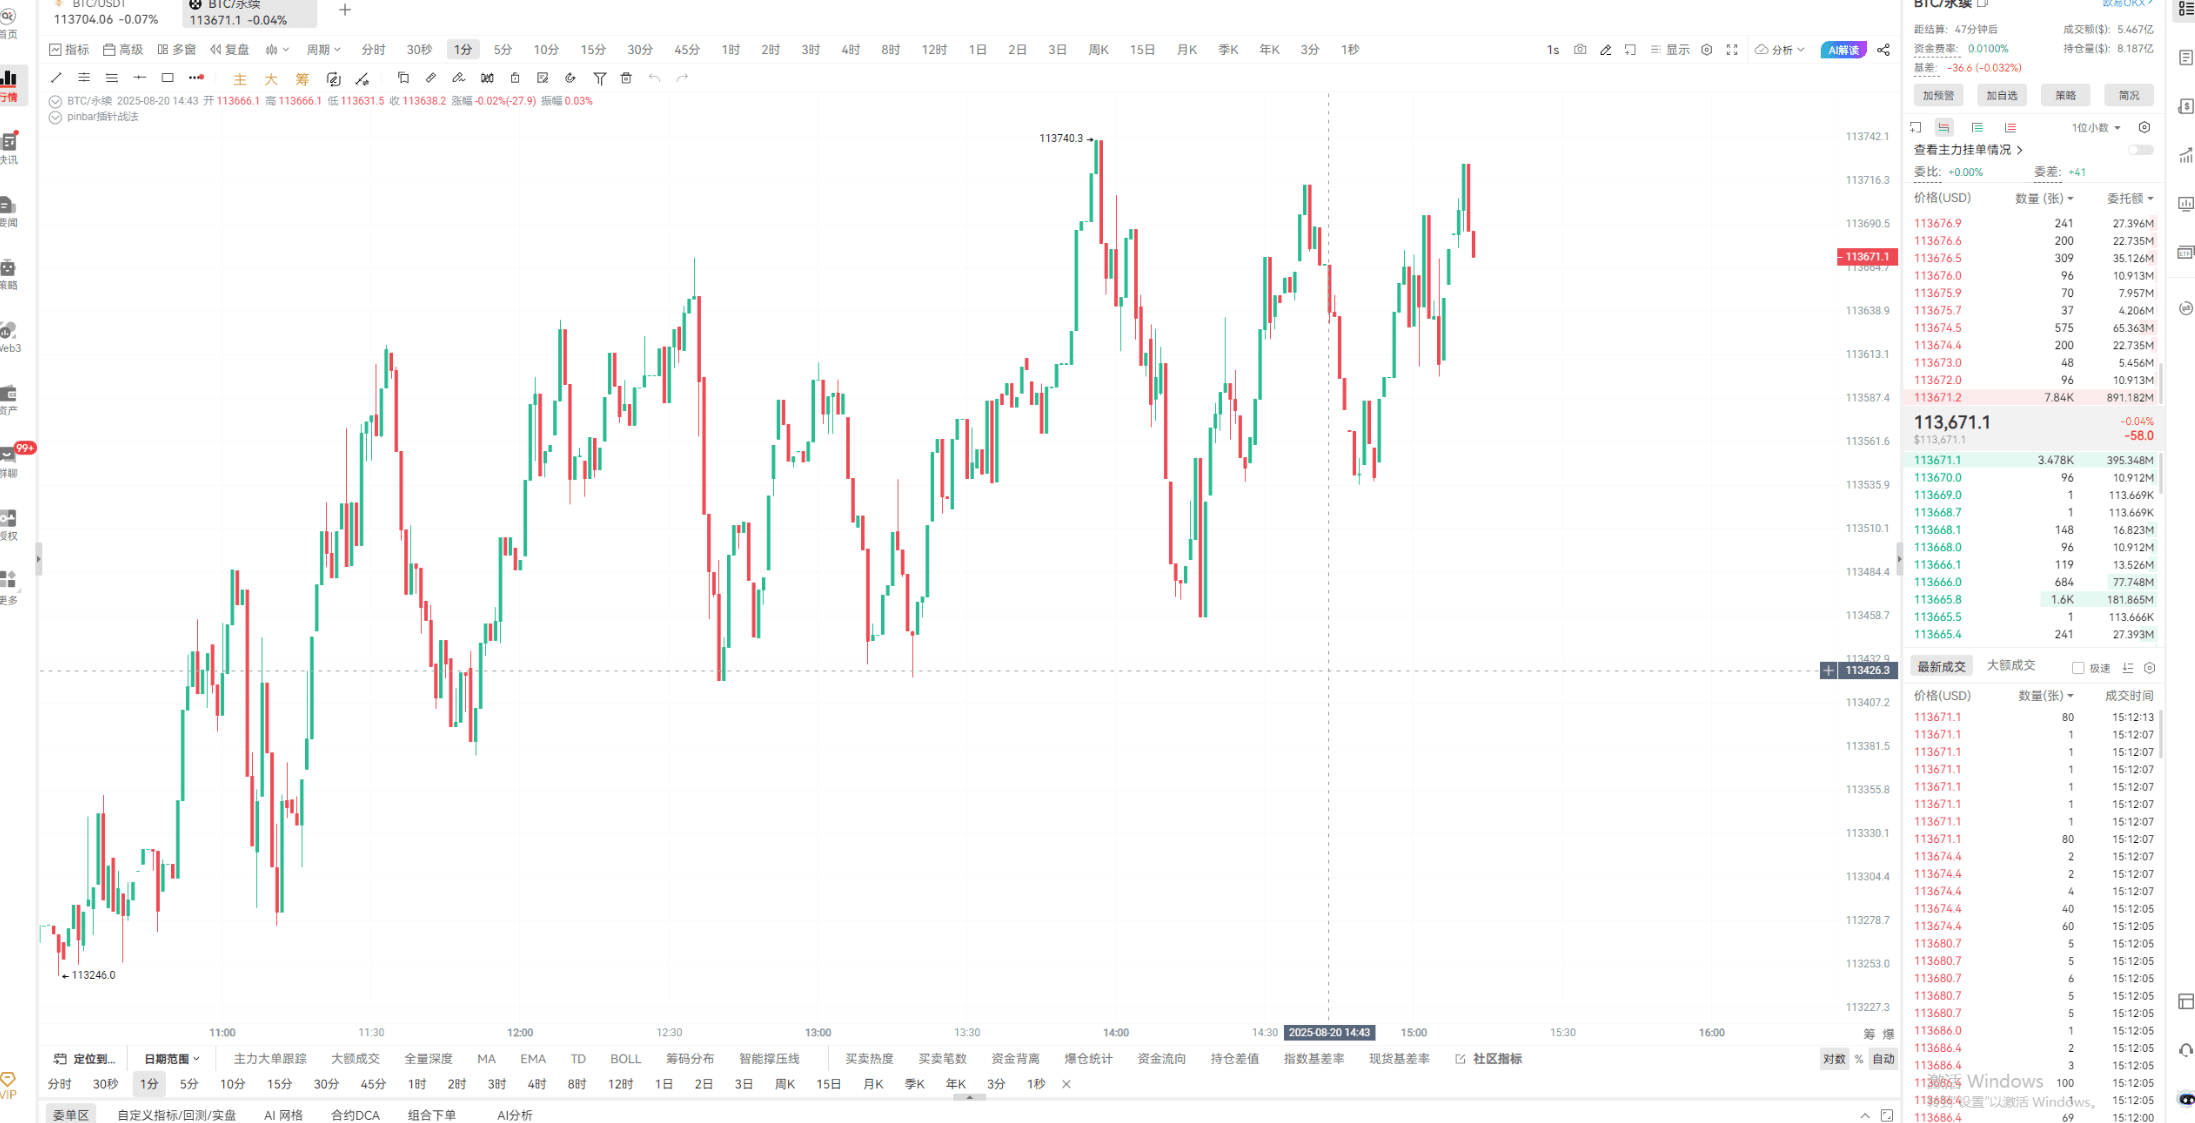
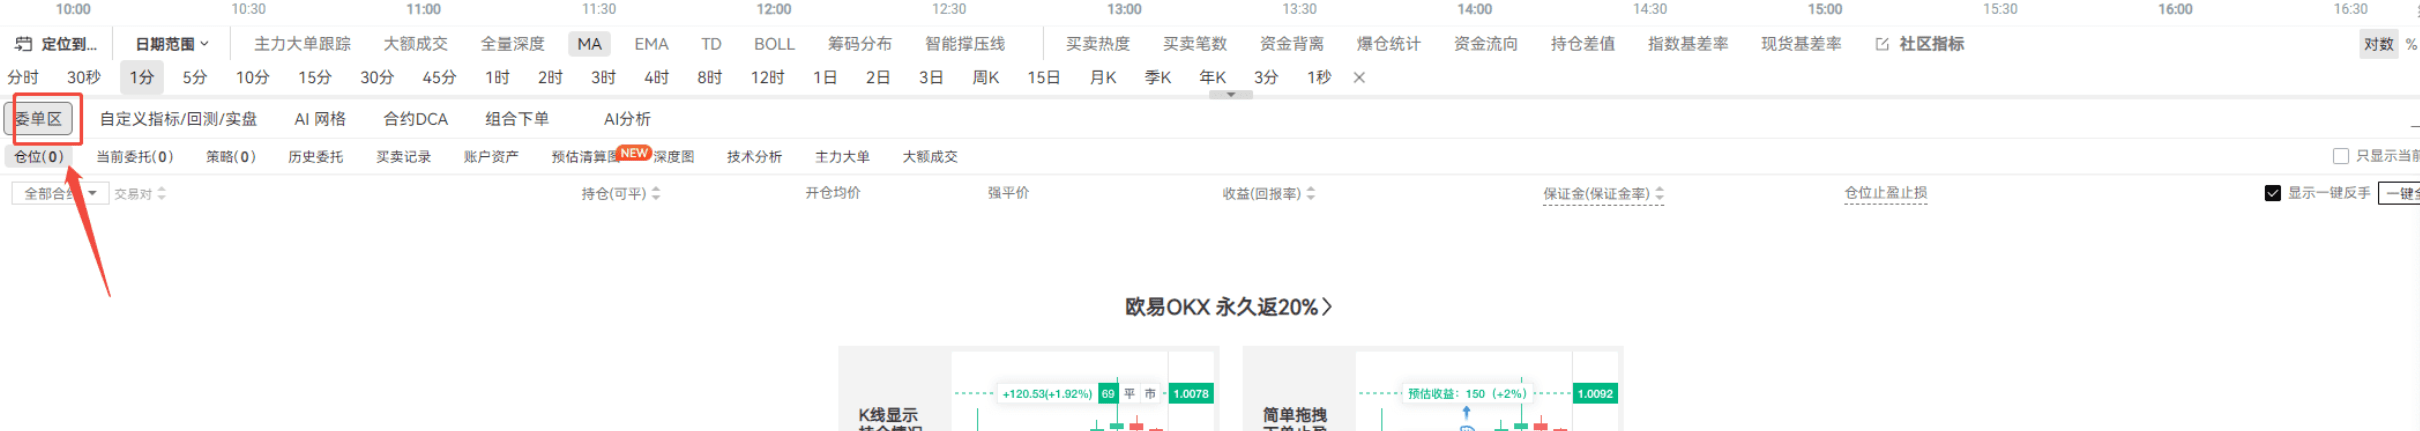
Next is the order area. The first is the order area where you can click here to jump to the exchange for placing orders.
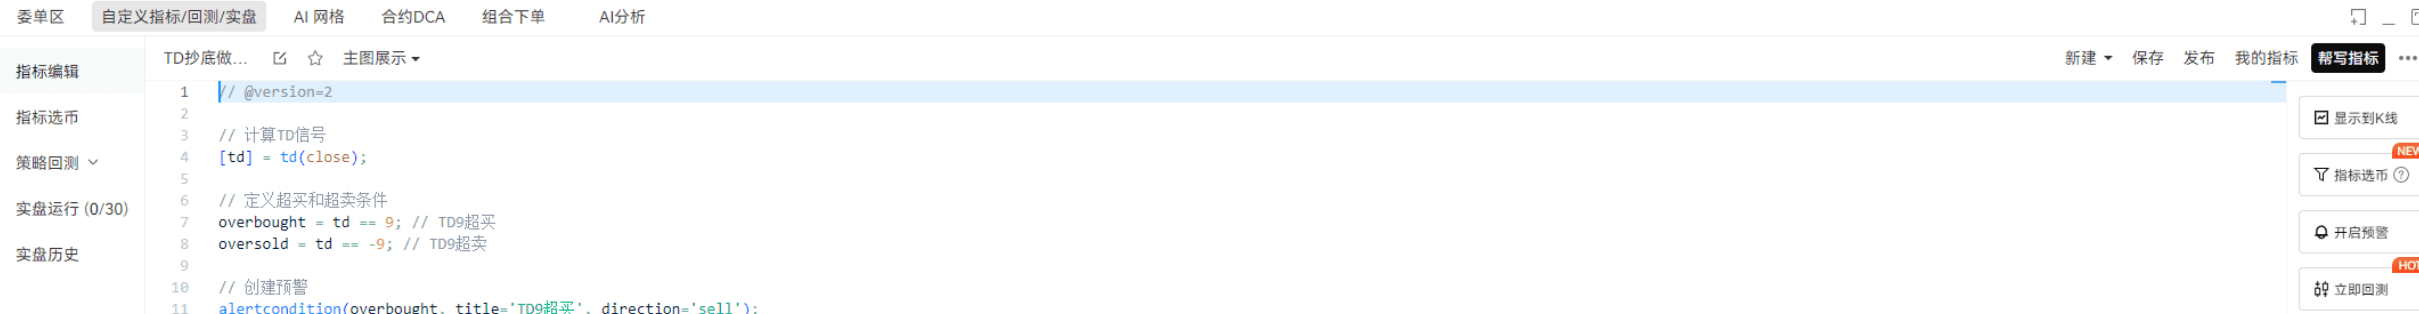
Next to it is the custom indicator, which allows you to set parameters for MA, EMA, and other lines. Those who can code can give it a try, or use the member-exclusive feature to have AiCoin help you write it~ Have any of you experienced that?
There is also a grid function behind the order area.
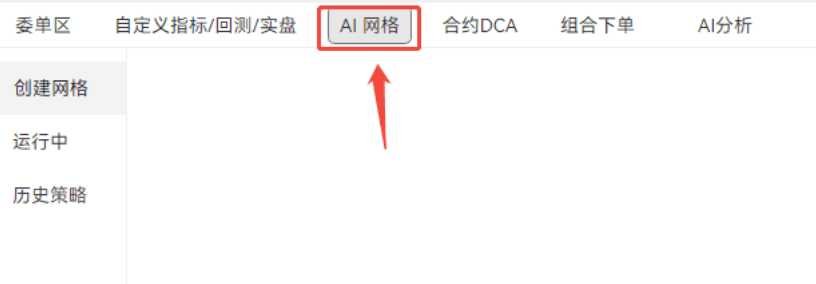
Grids are a trading method suitable for automated operations. By setting an upper limit price (selling point) and a lower limit price (buying point), trades are executed automatically when the price reaches these points, profiting from fluctuations. The advantage is that profits can be made in stable or volatile markets without the need for manual monitoring; but be cautious of losses in trending markets, accumulation of fees, and risks of extreme market conditions. Beginners are advised to start small and gradually adjust~ Simply put, it's automated buying and selling without needing to monitor the market 24/7~
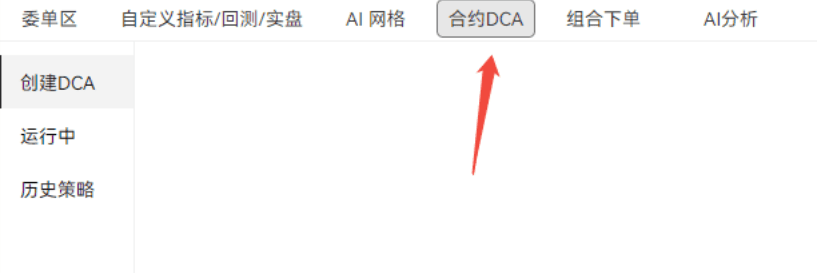
Next, let's look at DCA, which stands for Dollar Cost Averaging, a strategy of buying a fixed amount regularly.
Buying in batches can reduce timing risks and is suitable for long-term investors. The main difference from grids is that one is used more for long-term strategies and the other for short-term strategies. Friends who believe in the long-term rise of cryptocurrencies can smooth their costs using DCA~ However, it's still necessary to choose tools based on the situation, so I won't elaborate further here~
The combination order and AI analysis behind can be used as needed but are not frequently used. Let's look at this column on the right.
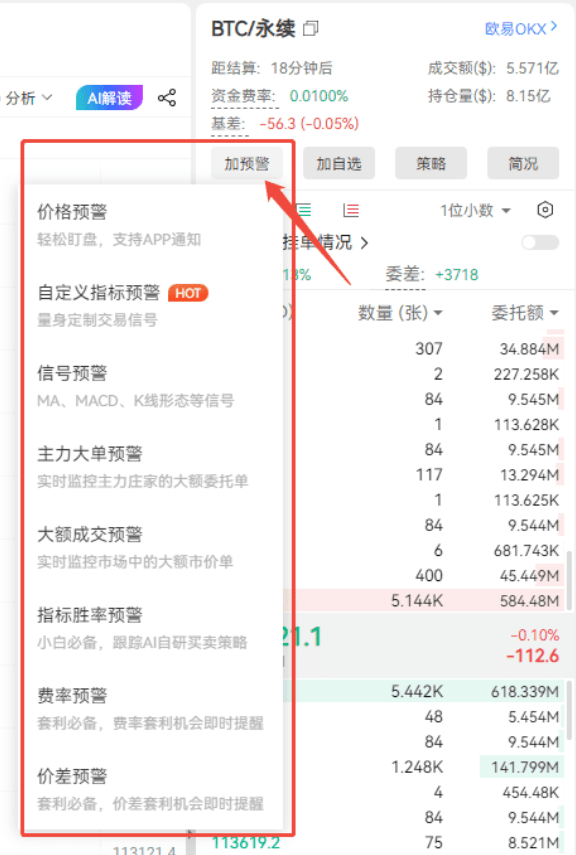
The threshold for understanding the information is low, mainly introducing the cryptocurrency. The operations include 'Add Alert', for example, setting price alerts that will pop up notifications when there are changes; 'Add to Favorites' means to bookmark for easier access next time.
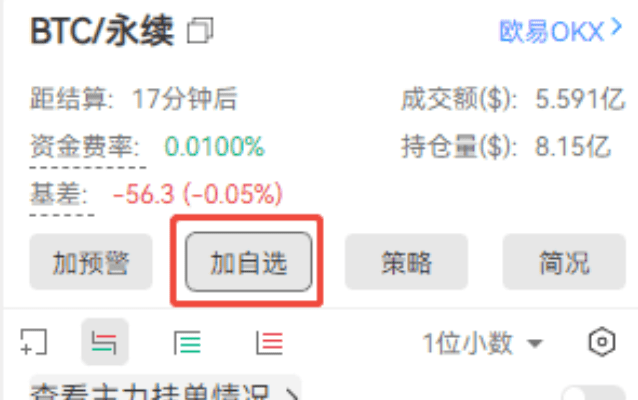
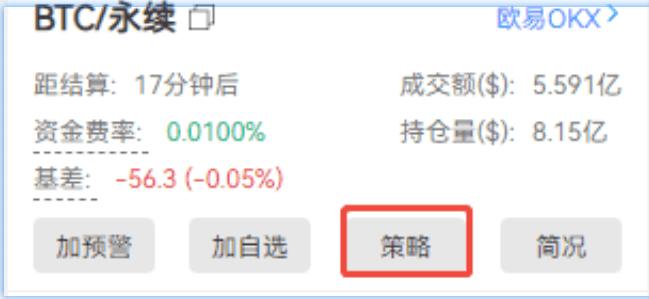
Clicking 'Strategy' will redirect you to the strategy interface to select suitable investment strategies.
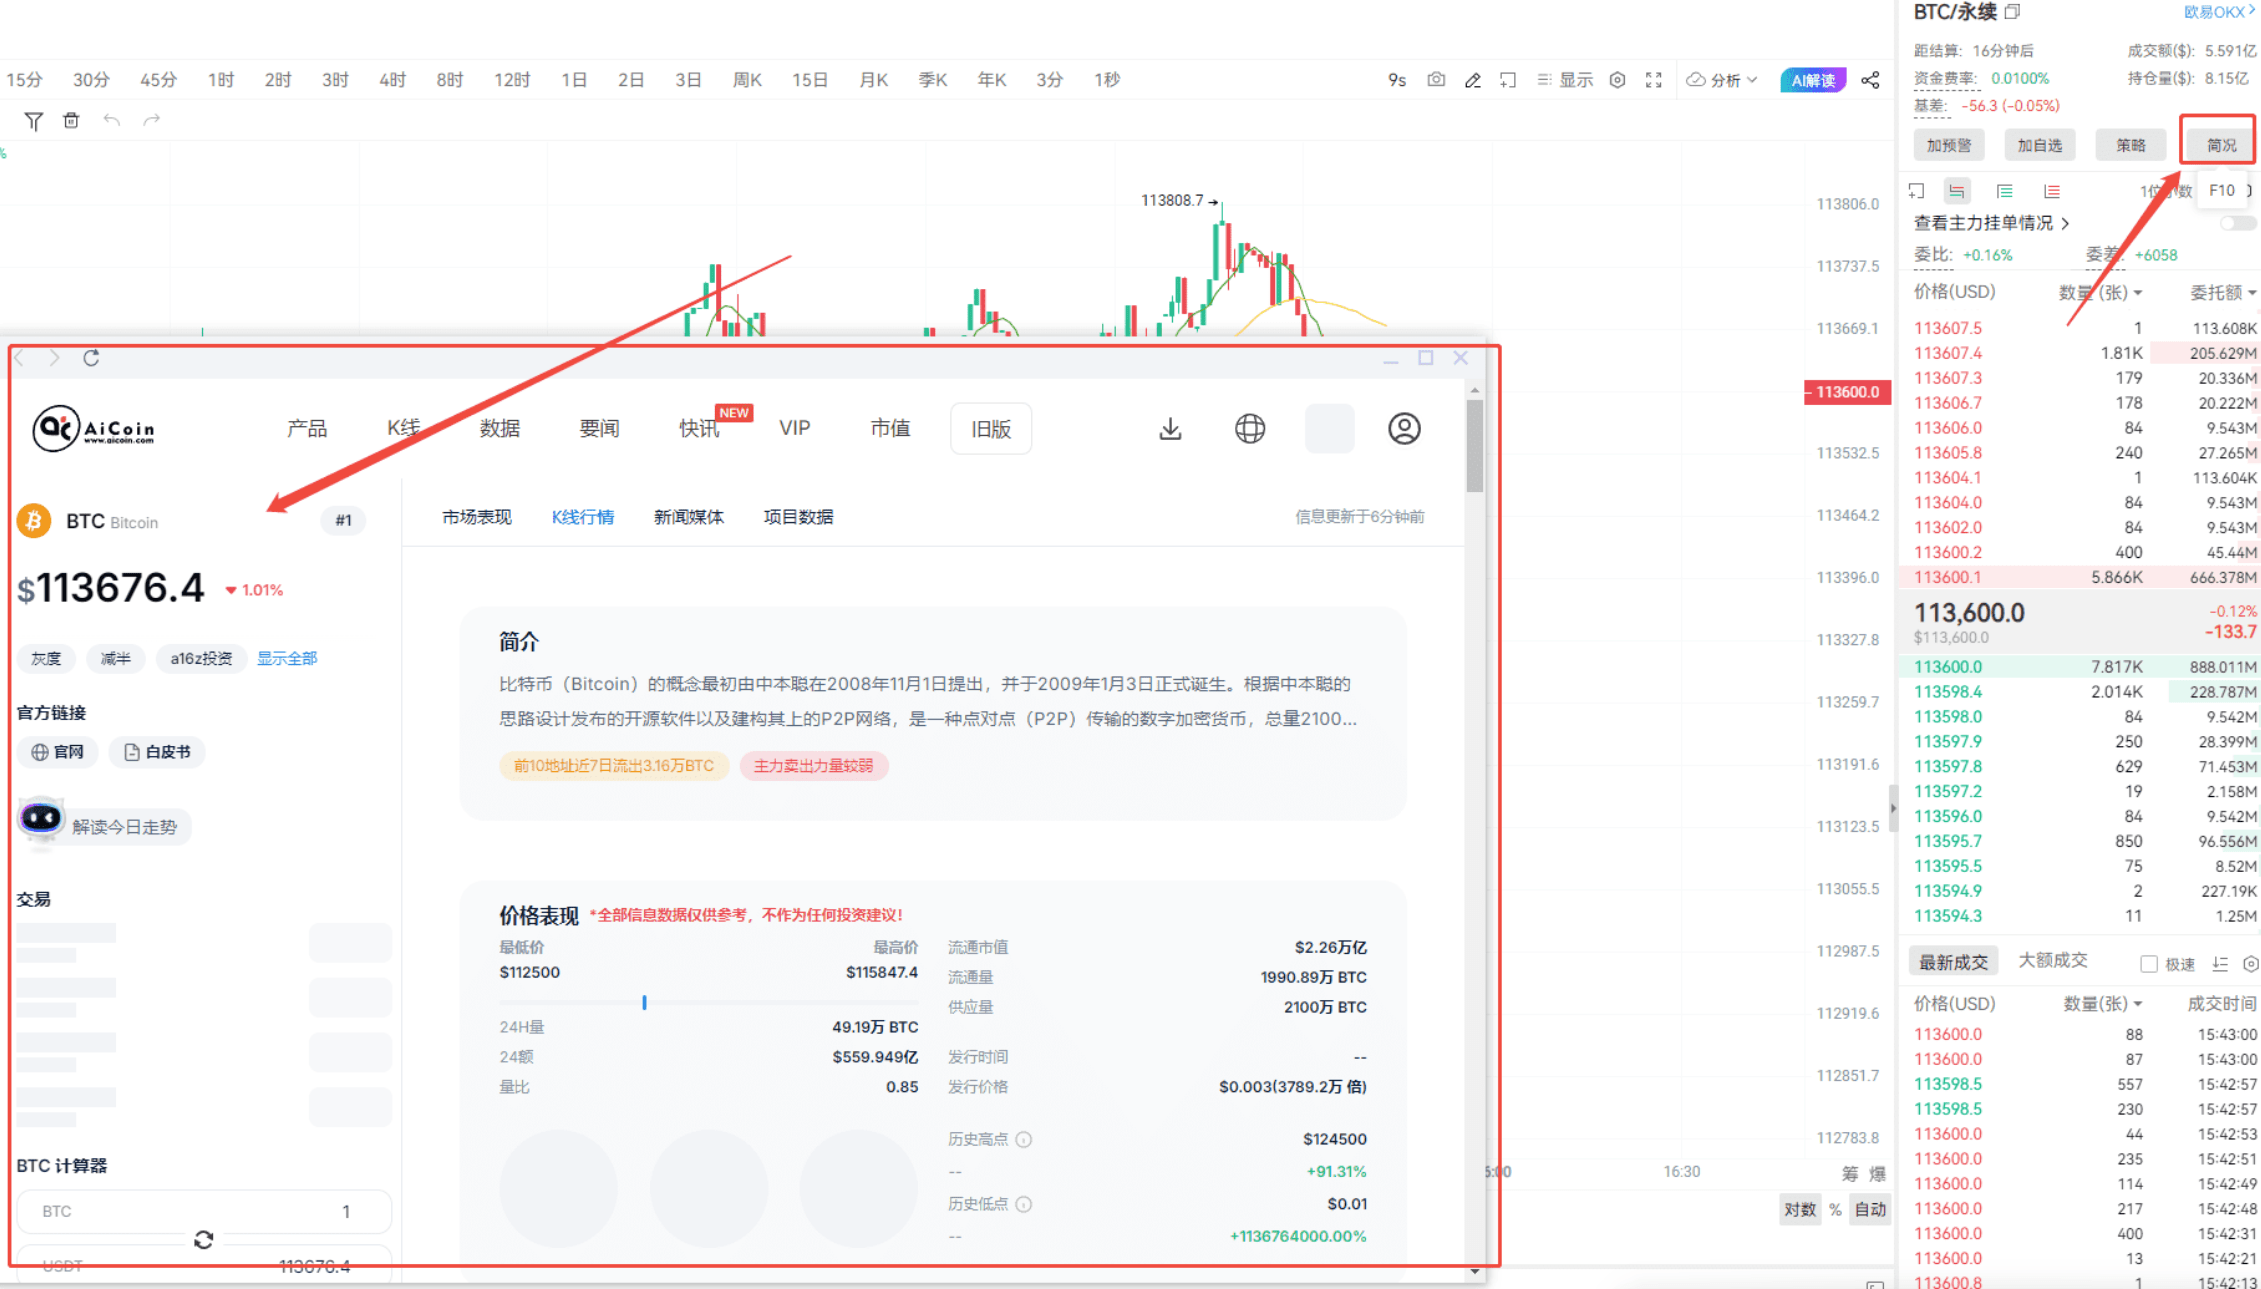
The summary and the right sidebar will display the history, news, capital flow, etc., of the cryptocurrency. Some investors will use this information for judgment; if you're interested, you can take a look~
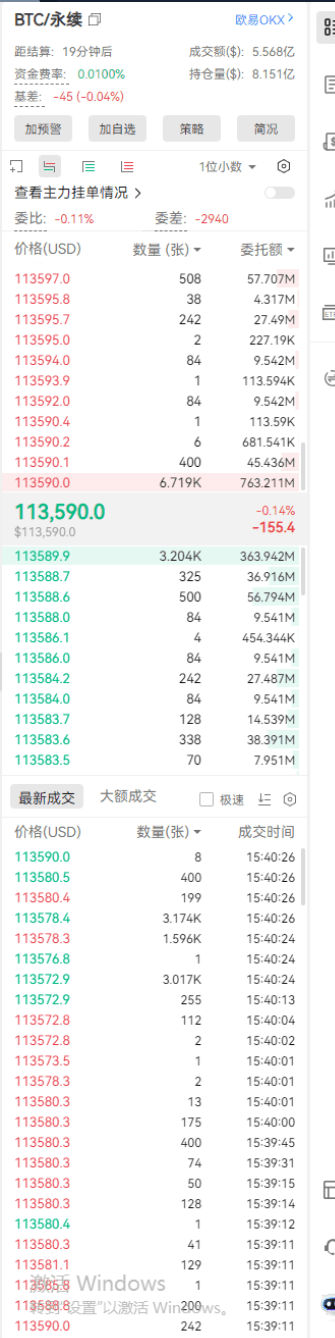
Finally, looking at this long string of numbers, the more difficult to understand part is the major pending orders.
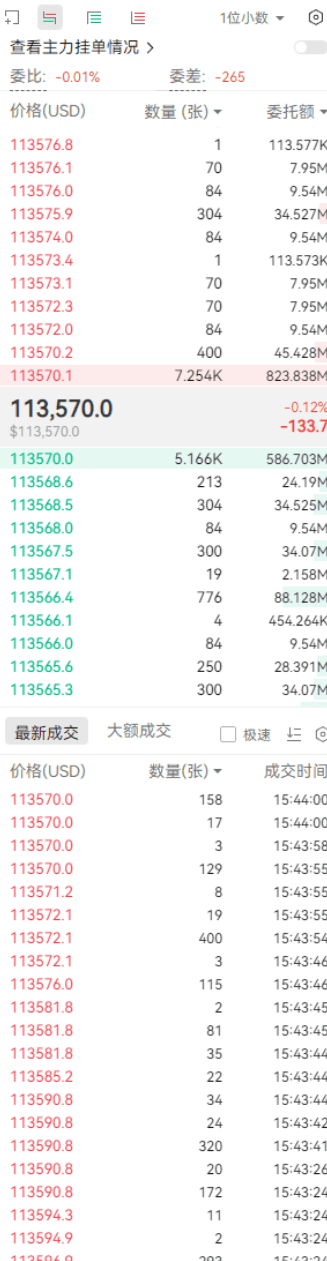
Simply put, it refers to the large buying and selling orders placed by big players or institutions, which have a significant impact on market liquidity and price fluctuations~ There are also commission ratios and commission differences here.
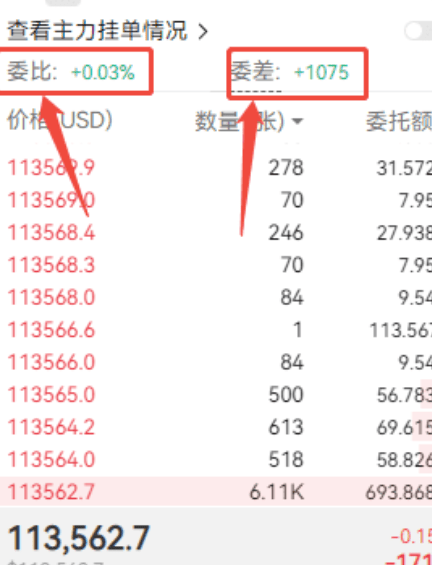
The commission ratio is the ratio of buy orders to sell orders over a certain period, measuring the strength of buy and sell orders; the commission difference is the absolute difference in buy and sell orders, and the price difference between the highest buy and lowest sell prices (liquidity spread). These are all reference information for judging buying and selling~ Friends who have been in A-shares should be familiar with this, haha~
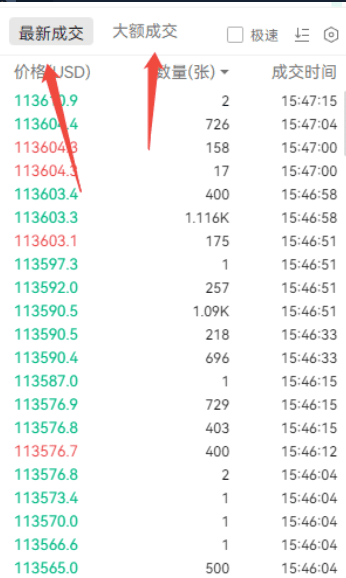
The latest transactions and large transactions below are easy to understand; the upper part shows pending orders, and the lower part shows actual transactions, both can serve as investment references.
Alright, we've finished introducing the content of the K-line chart page~
Remember to tune in to AiCoin live broadcasts every Monday, Wednesday, and Thursday. Find the group chat directly on the PC to enter, and we will occasionally invite industry experts to share, so don't miss it!
This article only represents the author's personal opinion and does not represent the stance and viewpoint of this platform. This article is for information sharing only and does not constitute any investment advice to anyone.