
1. What is a pinbar
Definition and theoretical background
The Pinbar (Pinbar signal) is a key reversal pattern derived from price action theory, which expresses the market's emotional volatility through a single candlestick. The core logic of the Pinbar is based on the market's behavior of 'rejecting price levels': within a certain time window, regardless of whether buyers or sellers dominate, the market ultimately rejects extreme directions in an attempt to find a 'balanced price.' This signal holds significant value near trend reversals and key resistance/support points.
From the perspective of quantitative analysis, the Pinbar is a type of pattern recognition signal that can be precisely quantified. Its calculation logic includes the following parts:
Long shadow: Shadow length must be significantly greater than the body length (e.g., 2 times or more).
Position of the body: The body must be close to one end of the shadow, reflecting the reversal strength of the market in a short time.
Price touch range: The background in which the Pinbar is born is usually accompanied by important price structures, such as moving averages, Fibonacci retracement levels, or previous key highs and lows.
For example, for a 'bullish Pinbar', when the market tests lower price levels (such as support areas) and a long lower shadow appears, it indicates that the sellers' breakout attempt has failed, and buyers are dominant; whereas a 'bearish Pinbar' appears near resistance levels, indicating that buyers are struggling to push higher.
Core features
As a typical price action signal, the pinbar has the following structural characteristics:
Long shadow length: The shadow length is generally more than twice the length of the body.
Position of the body: The body is located at one end of the shadow, representing a concentrated expression of reversal sentiment.
Trading logic: The shadow indicates that the price level is strongly rejected in one direction, usually indicating the importance of support or resistance areas.
Relation to quantitative analysis
The Pinbar, combined with key market levels (such as moving averages, Fibonacci retracement, support, and resistance levels), can significantly improve the accuracy of determining trend reversals.
In quantitative models, the pinbar can serve as a parameterized signal that can be further optimized with trend indicators (like MACD, RSI) or volatility indicators (like ATR).
Mathematical modeling analysis
The Pinbar can also be described using mathematical modeling methods, for example:
Upper shadow length: (high − max(open, close))
Lower shadow length: (min(open, close) − low)
Body length: |open − close|
Signal judgment conditions: Assume shadow length ≥ body length * 2 and the candlestick closing price is close to one end of the shadow, then the pattern is established.
2. Pinbar strategy · Pinbar signal direction
In the design of this strategy, the pinbar signal is the core trigger for trend reversal logic, and the confirmation and execution of signal direction are closely intertwined. The strategy logic is precise, efficient, and follows causal relationships, capturing maximized market opportunities with minimal pattern input.
The core idea of the Pinbar strategy can be seen as 'discovering the direction of market turning points through a pinbar':
If the market probes upward (long upper shadow), it indicates that there is significant resistance above, and the price is likely to move down; at this point, sell any long positions and start shorting.
If the market probes downward (long lower shadow), it indicates that there is strong support below, and the price is very likely to rebound upward; at this point, close any short positions and start buying long.
It acts like a 'market probe', helping us discover potential directional changes in advance. Importantly, this signal is based on strict conditions and, when combined with trend direction and support/resistance levels, can significantly improve accuracy.
3. Pinbar strategy · Pinbar signal
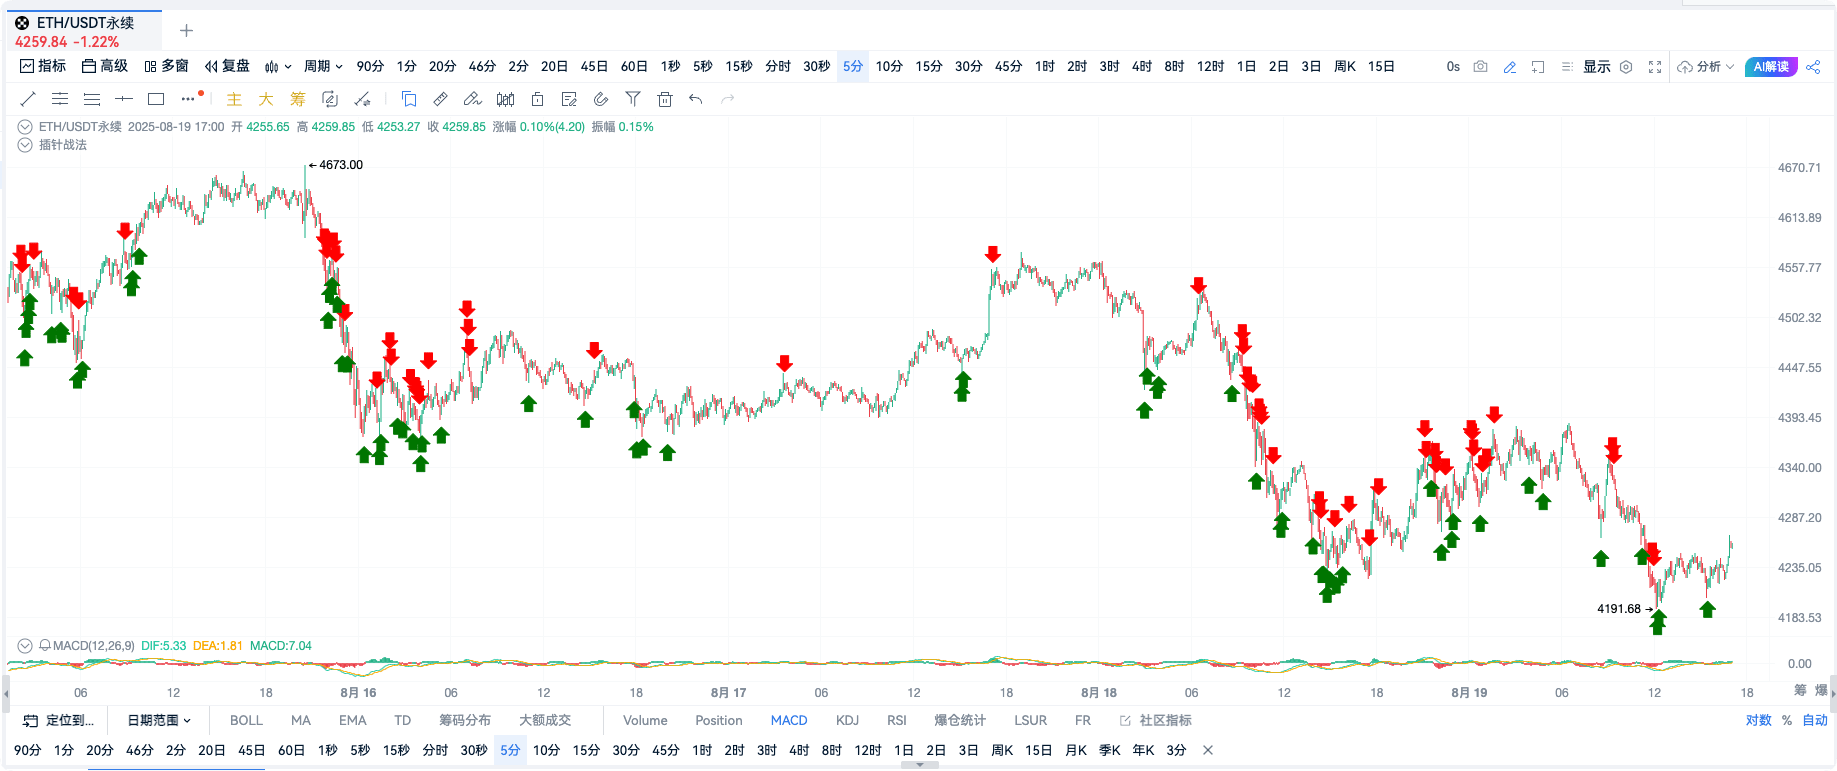
Chart OKX-ETHUSDT perpetual contract 5-minute cycle
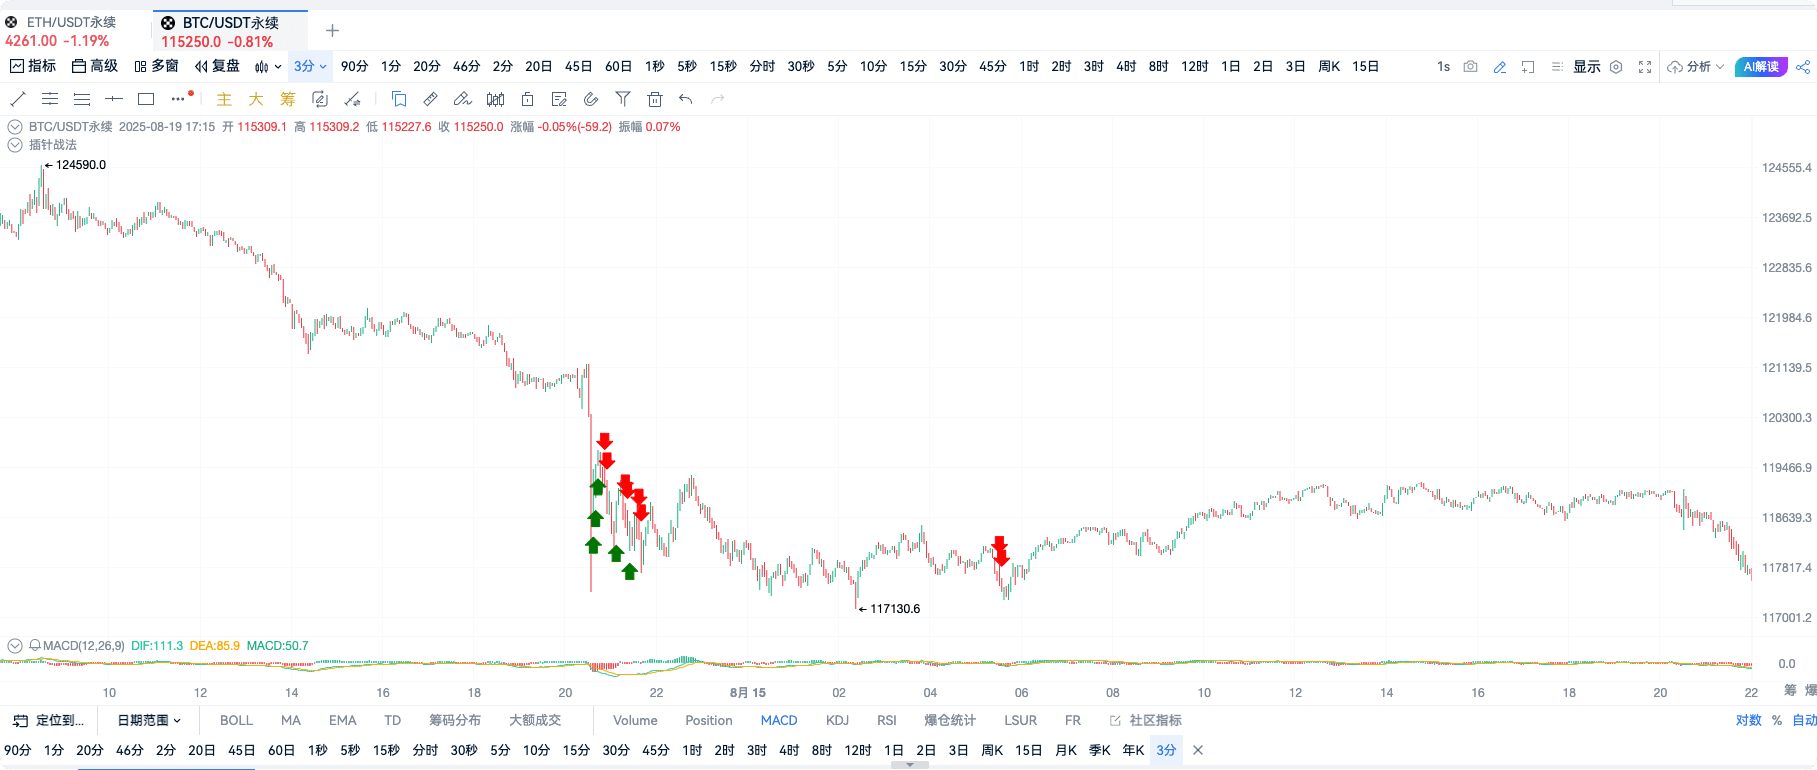
Chart OKX-BTCUSDT perpetual contract 3-minute cycle
4. Backtest analysis
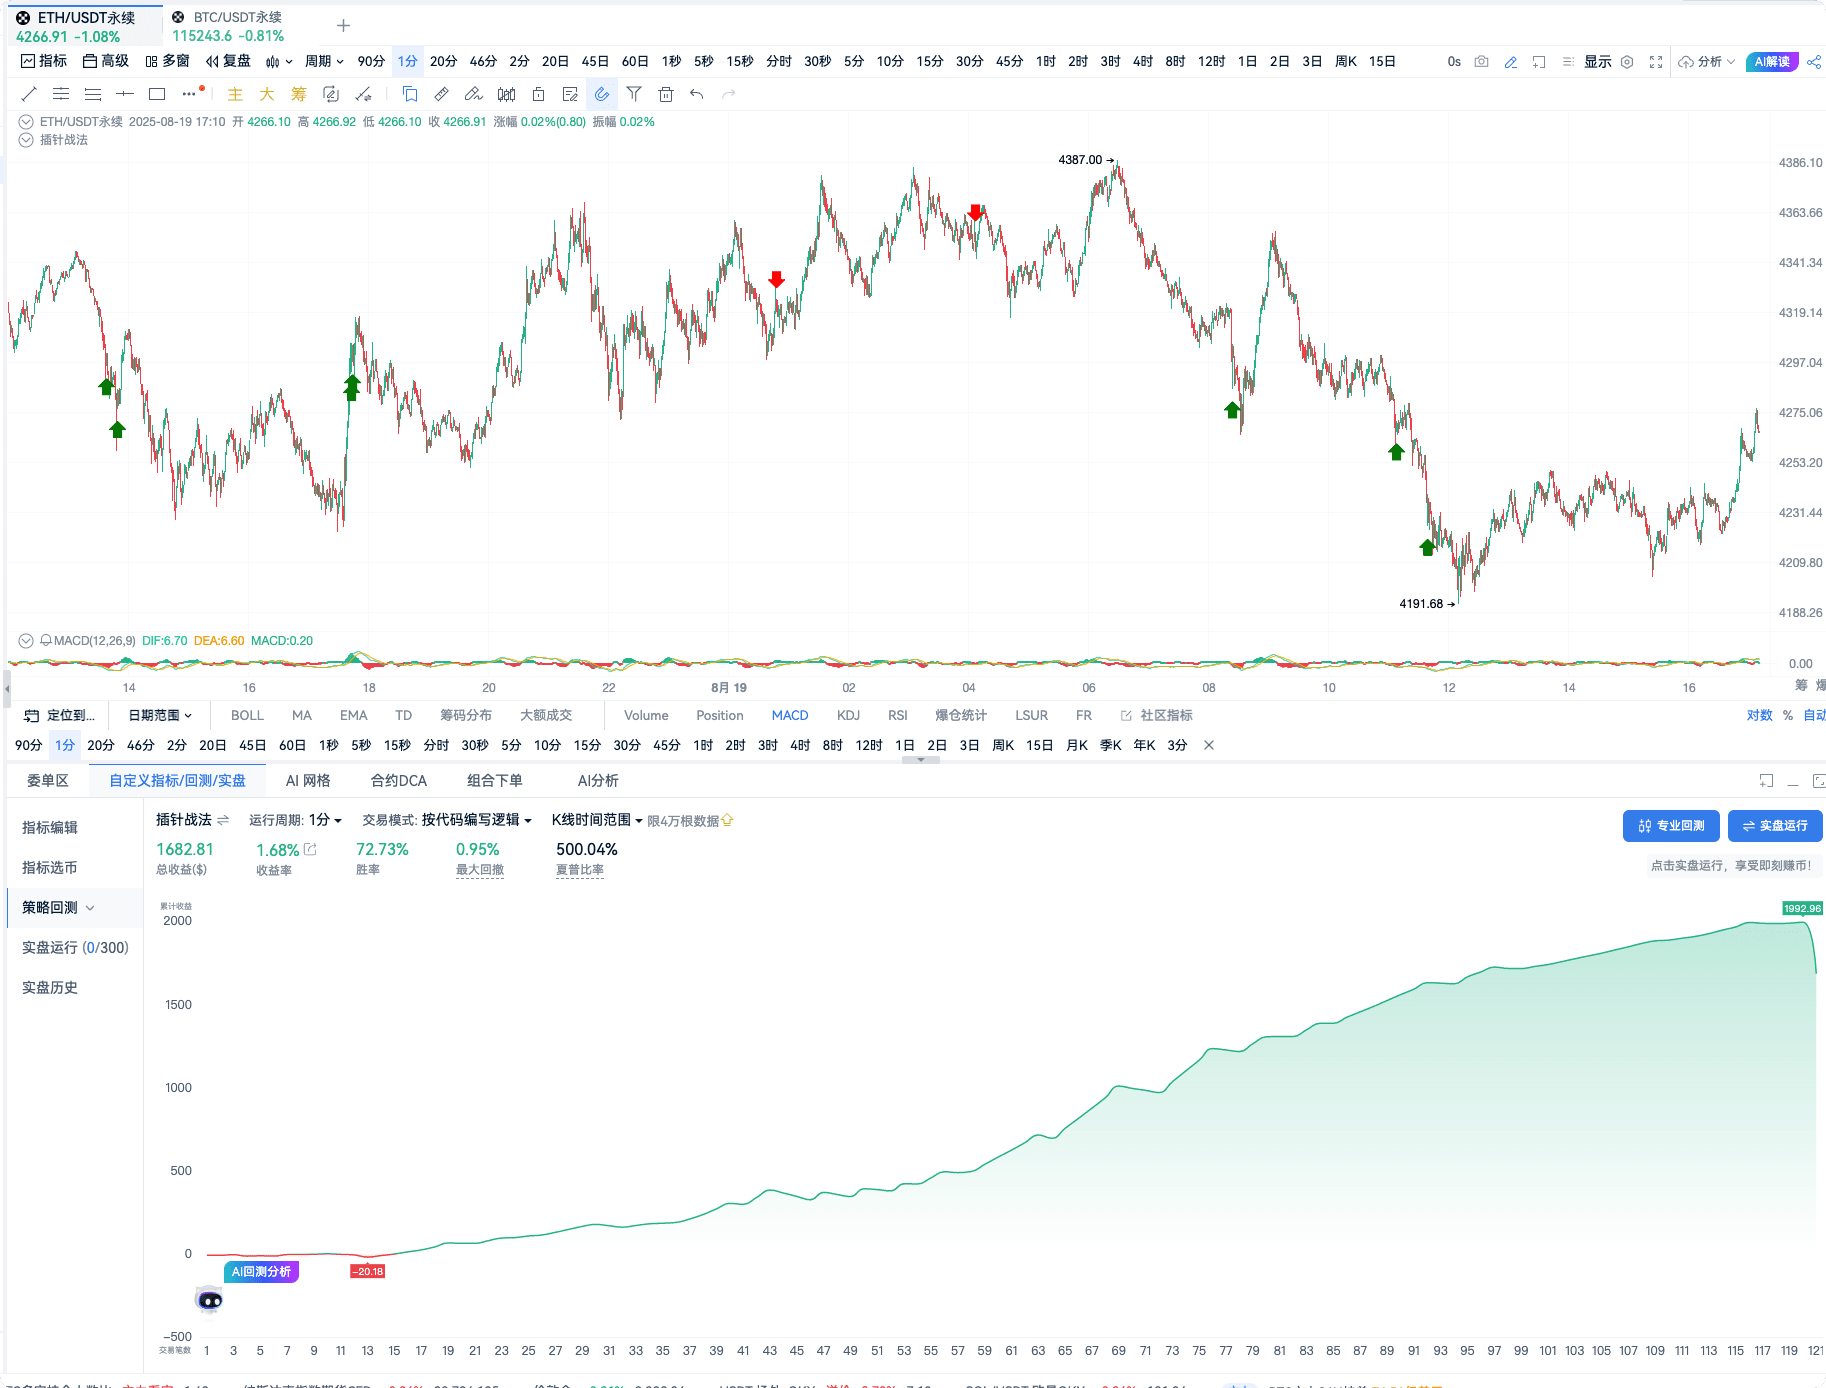
Chart OKX-ETHUSDT perpetual contract 1-minute cycle
Backtest highlights: Win rate 72.73%, Maximum drawdown: 0.95%
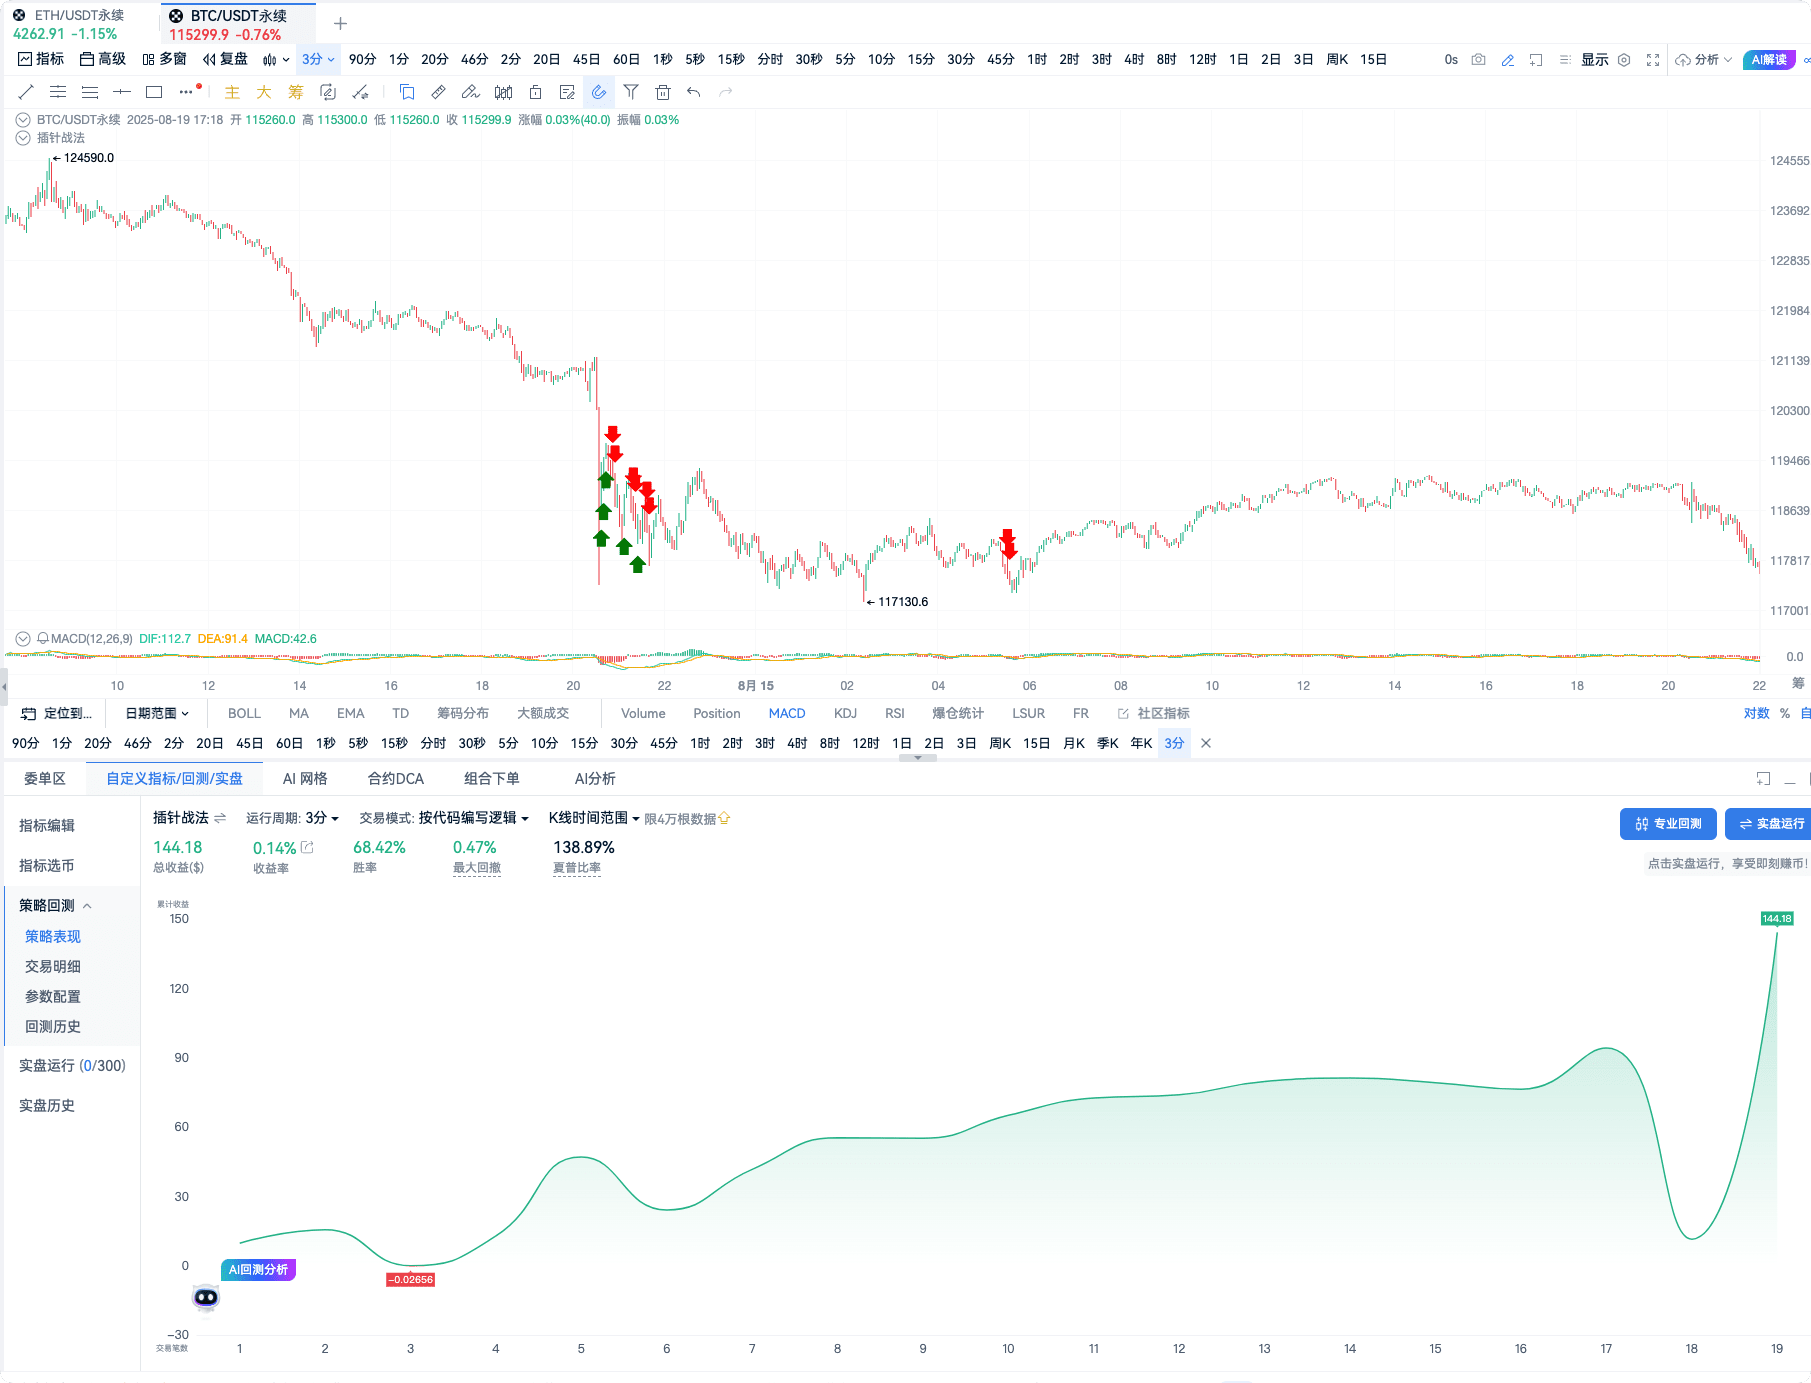
Chart OKX-BTCUSDT perpetual contract 3-minute cycle
Backtest highlights: Win rate 68.42%, Maximum drawdown: 0.47%
5. Indicator source code
//@version=2
// Amplitude threshold
amplLimit=0.003
// Body threshold
solidLimit=0
// Shadow limit
shadowPctLimit=0.002
// Calculate upper shadow
overshadow = high - max(open, close)
// Calculate candlestick body
solid = abs(close - open)
// Calculate lower shadow
undershadow = min(close, open) - low
// Calculate amplitude
ampl = (high - low) / close[1]
// Calculate the rise and fall of upper shadow
overshadowPct = overshadow / max(open, close)
// Calculate the rise and fall of lower shadow
undershadowPct = undershadow / min(close, open)
// Pinbar judgment algorithm
pinbar = 0
if (ampl > amplLimit) {
if (solid > solidLimit && undershadowPct > shadowPctLimit && overshadowPct > shadowPctLimit) {
pinbar := 4
}
else if (solid >= solidLimit && undershadowPct > shadowPctLimit) {
pinbar := -1
} else if (solid >= solidLimit && overshadowPct > shadowPctLimit) {
pinbar := 1
}
}
// 1 is upper pinbar
// -1 is lower pinbar
// 4 Upper and lower pinbars
up = (pinbar == 1 and close < open) or (pinbar[1] == 1 and close < open)
down = (pinbar == -1 and close > open) or (pinbar[1] == -1 and close > open)
// up = pinbar == 1
// down = pinbar == -1
// Create corresponding alert conditions for use in the alert addition window
alertcondition(up, title='Upper Pinbar', direction="sell")
alertcondition(down, title='Lower Pinbar', direction="buy")
// Draw on the chart
// plot(close, title="Close")
plotShape(up, title="Upper Pinbar", shape='arrowDown', color='red', refSeries=high, placement='top', fill=true)
plotShape(down, title="Lower Pinbar", shape='arrowUp', color='green', refSeries=low, placement='bottom', fill=true)
// Close short and open long
exitShort(down, price='market', amount=1)
enterLong(down, price='market', amount=1)
// Close long and open short
exitLong(up, price='market', amount=1)
enterShort(up, price='market', amount=1)
Six, Comprehensive
The Pinbar is a uniquely shaped candlestick with long shadows and short bodies, resembling a 'needle' probing at a certain price level. When this needle appears in key price areas, such as support or resistance levels, it often suggests that the market is testing and intends to reverse, helping us determine the trend direction.
If the shadow line appears below (long lower shadow): the market is strongly supported, and the possibility of a price rebound is high; this is a typical bullish signal.
If the shadow line appears above (long upper shadow): the market is strongly resisted, and the possibility of a price decline is high; this is a typical bearish signal.
The Pinbar can be understood as a market 'probe' reflecting the behavior of rejecting extreme prices and tending toward equilibrium during price fluctuations. In simple terms, this special candlestick pattern can capture the market's directional choice at critical moments, providing clear guidance for trading decisions. However, it is worth noting that relying solely on the Pinbar signal may carry certain risks; we recommend combining it with other indicators (such as trend, momentum, or volatility indicators) to enhance the precision and stability of signals, thereby improving strategy effectiveness.
Join our community, let's discuss and become stronger together!
Official Telegram community: t.me/aicoincn
AiCoin Chinese Twitter: https://x.com/AiCoinzh
Group chat - Wealth Group: https://www.aicoin.com/link/chat?cid=10013

