$BTC continues to move inside its wedge pattern, and while we’ve seen an important low complete in the wave count, the big question remains: Has Bitcoin truly bottomed?
Let’s break it down.
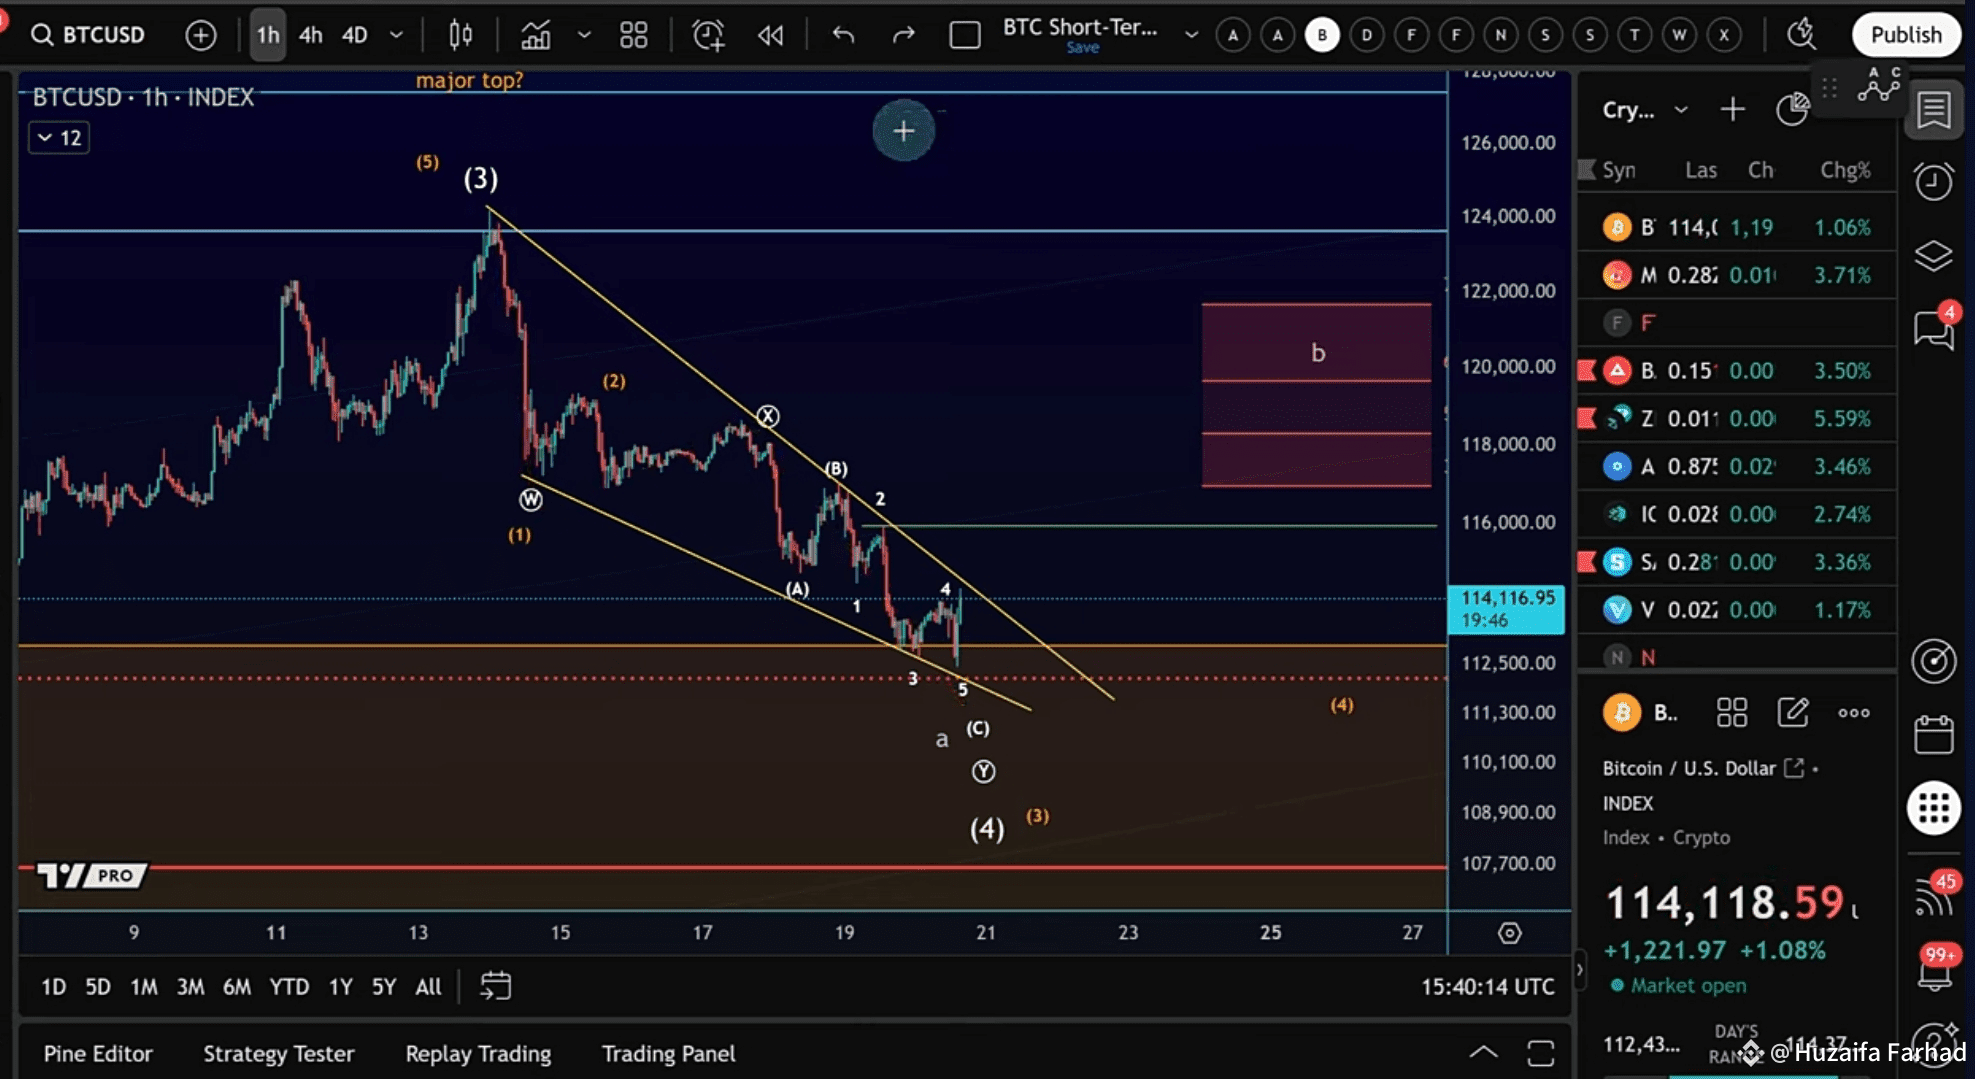
🔹 Wave Count Update
We now have a technically complete WXY correction.
In this structure, we can see:
Wave W
X wave
Y wave in an ABC format (which includes 1-2-3-4-5 moves).
➡️ While this gives us a complete wave count, WXY structures are complex and less common than simple ABC corrections. That means further downside cannot be ruled out.
🔹 Support Levels & Local Low
We are now testing strong support:
Previous swing lows from early August.
Fibonacci support at around 113K (23.6% retracement).
This makes the chances of a bounce fairly strong. Many altcoins also suggest that a local low may be forming.
But — we don’t yet have confirmation. We still need upside momentum.
🔹 Key Reversal Signals to Watch
1. Break above yellow trendline (~114,700).
2. Move towards 115,950 resistance zone.
3. Larger Fibonacci resistance area above — a major test zone.
Without these, the green candles we’ve seen remain inconclusive.
