$SUI has been moving sideways over the last few days, and many traders are asking the same question: Has the local low already formed, or is a deeper pullback still ahead? Let’s break it down on both the higher and lower timeframes.
🔎 Bigger Picture – Still in Wave 2?
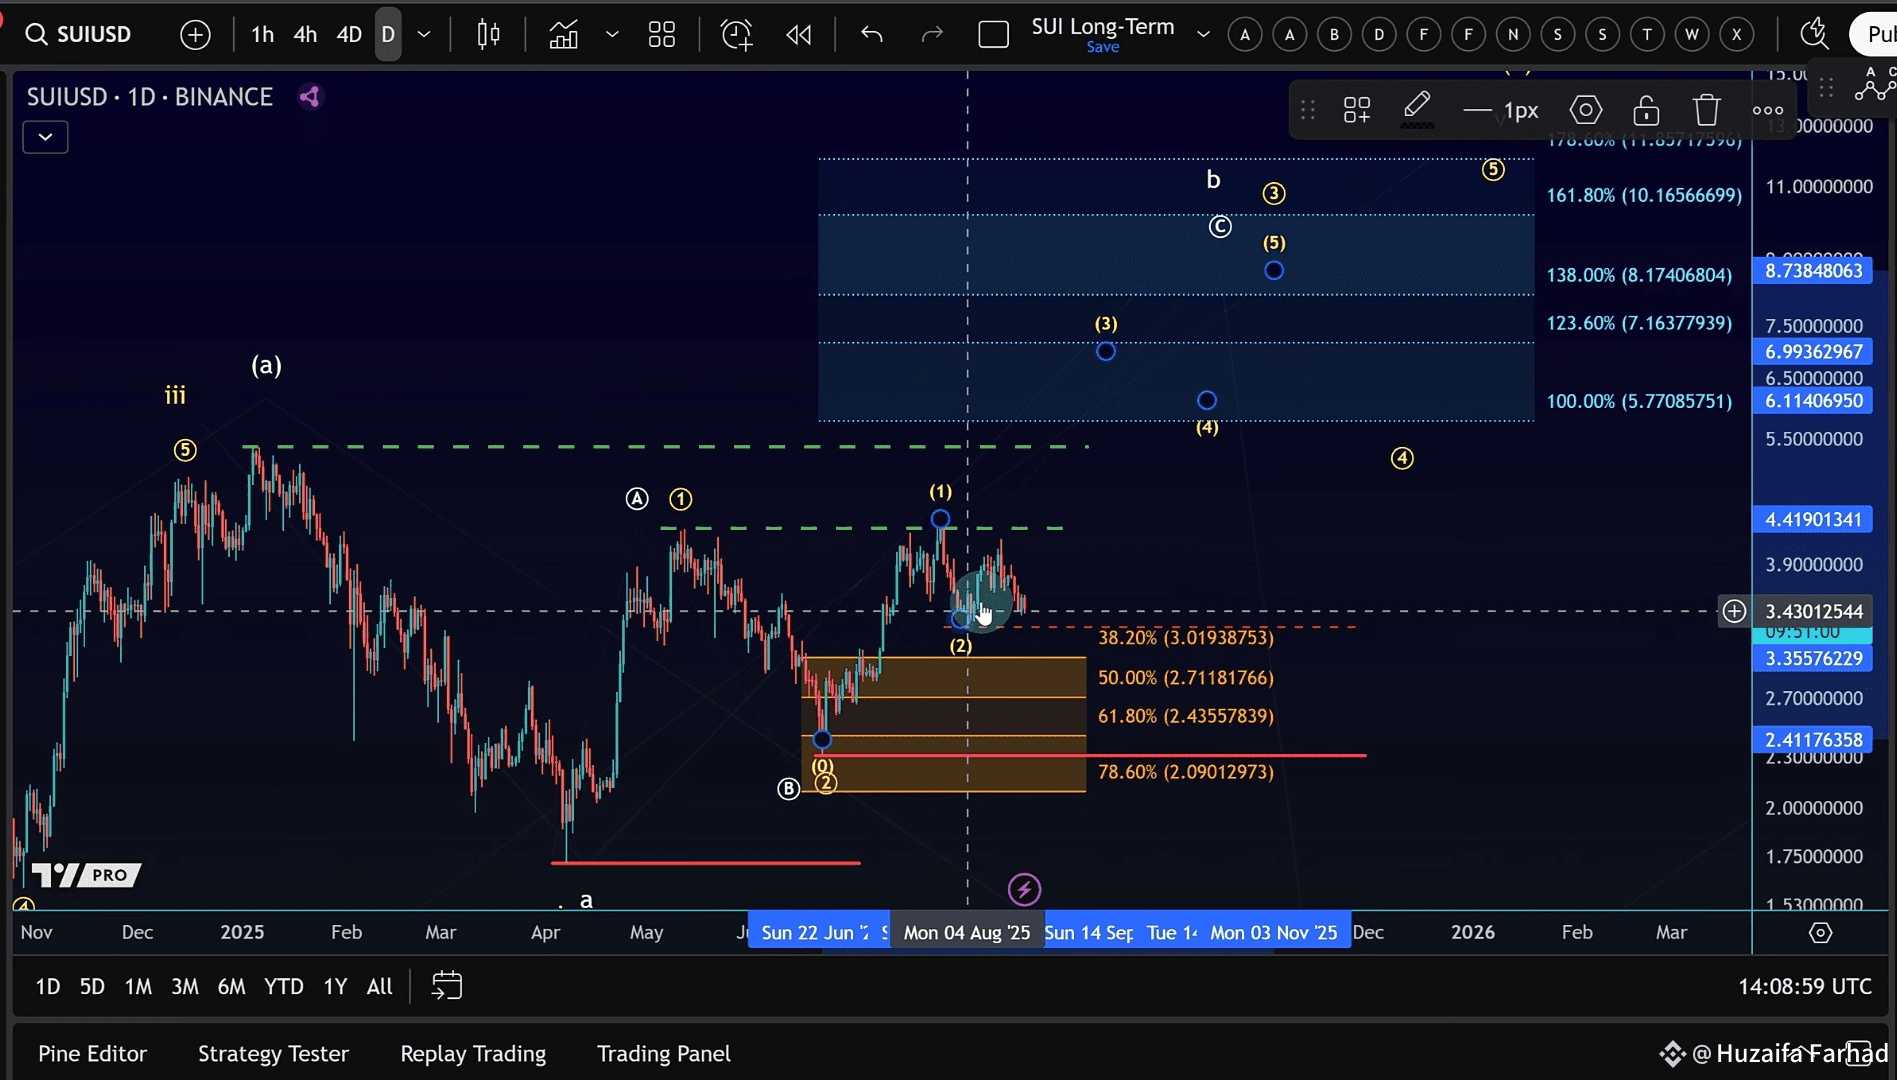
Looking at the larger timeframe, the structure suggests that Wave 2 might still be unfolding after the pullback from the August high.
Key support sits at $3.28 (August low) – this remains a significant swing low.
A break below this level would strongly suggest that Wave 2 is extending further.
However, holding above $3.28 could set the stage for a powerful third-wave rally to the upside.
📉 Shorter Timeframe View – Correction Still in Play
On the 30-minute chart, the pullback looks like a classic A-B-C correction:
A-wave down → B-wave up → C-wave down
The C-wave is close to reaching the 100% Fibonacci extension at $3.36
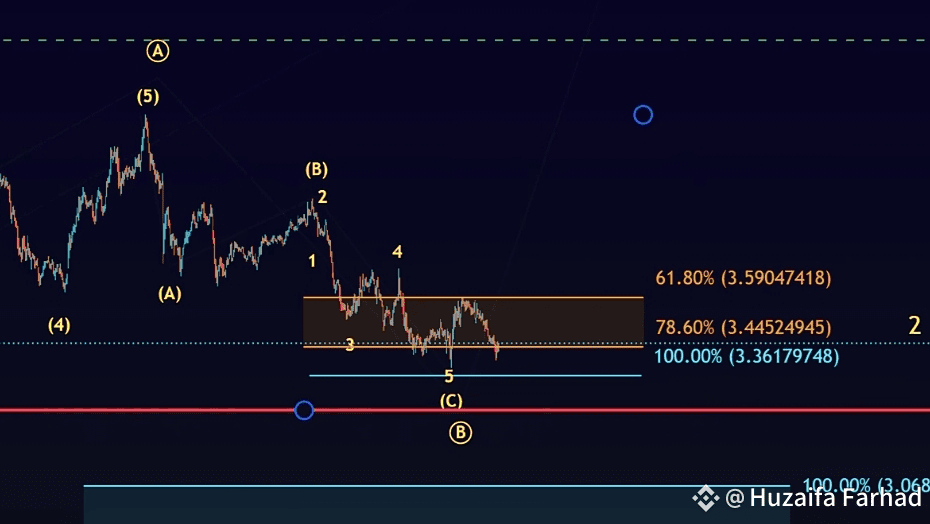
While yesterday’s move above a small swing high was encouraging, we still lack confirmation of a local bottom.
Earliest signs of recovery would be:
1. Break above $3.67
2. Follow-through above $3.95