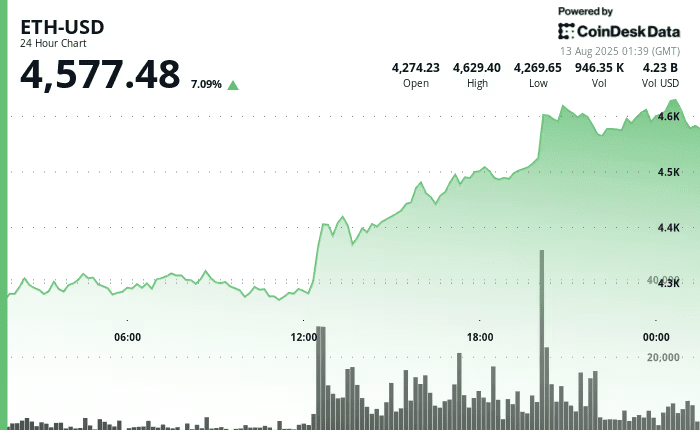
On Wednesday (August 13), as the Asian trading day began, Bitcoin attempted to stabilize above $119,000, while Ethereum continued its sharp rise above $4600. After the release of the U.S. July CPI data, the market is highly focused on the possibility of a 50 basis point rate cut.
The price of Bitcoin (BTC) may continue to rise after the release of the U.S. July Consumer Price Index (CPI). Data shows that U.S. inflation year-on-year remained at 2.7%, unchanged from June and below the market expectation of 2.8%. The core CPI, excluding food and energy, rose 3.1% year-on-year, in line with expectations. On a monthly basis, the overall CPI rose 0.2%, lower than June's 0.3%; the core CPI rose 0.3%, higher than the previous 0.2%.
This data provides a mildly bullish backdrop for Bitcoin, as cooling inflation strengthens the case for monetary easing, which is a positive factor for risk assets. A lower interest rate environment will reduce the opportunity cost of holding Bitcoin, thus attracting new funds.
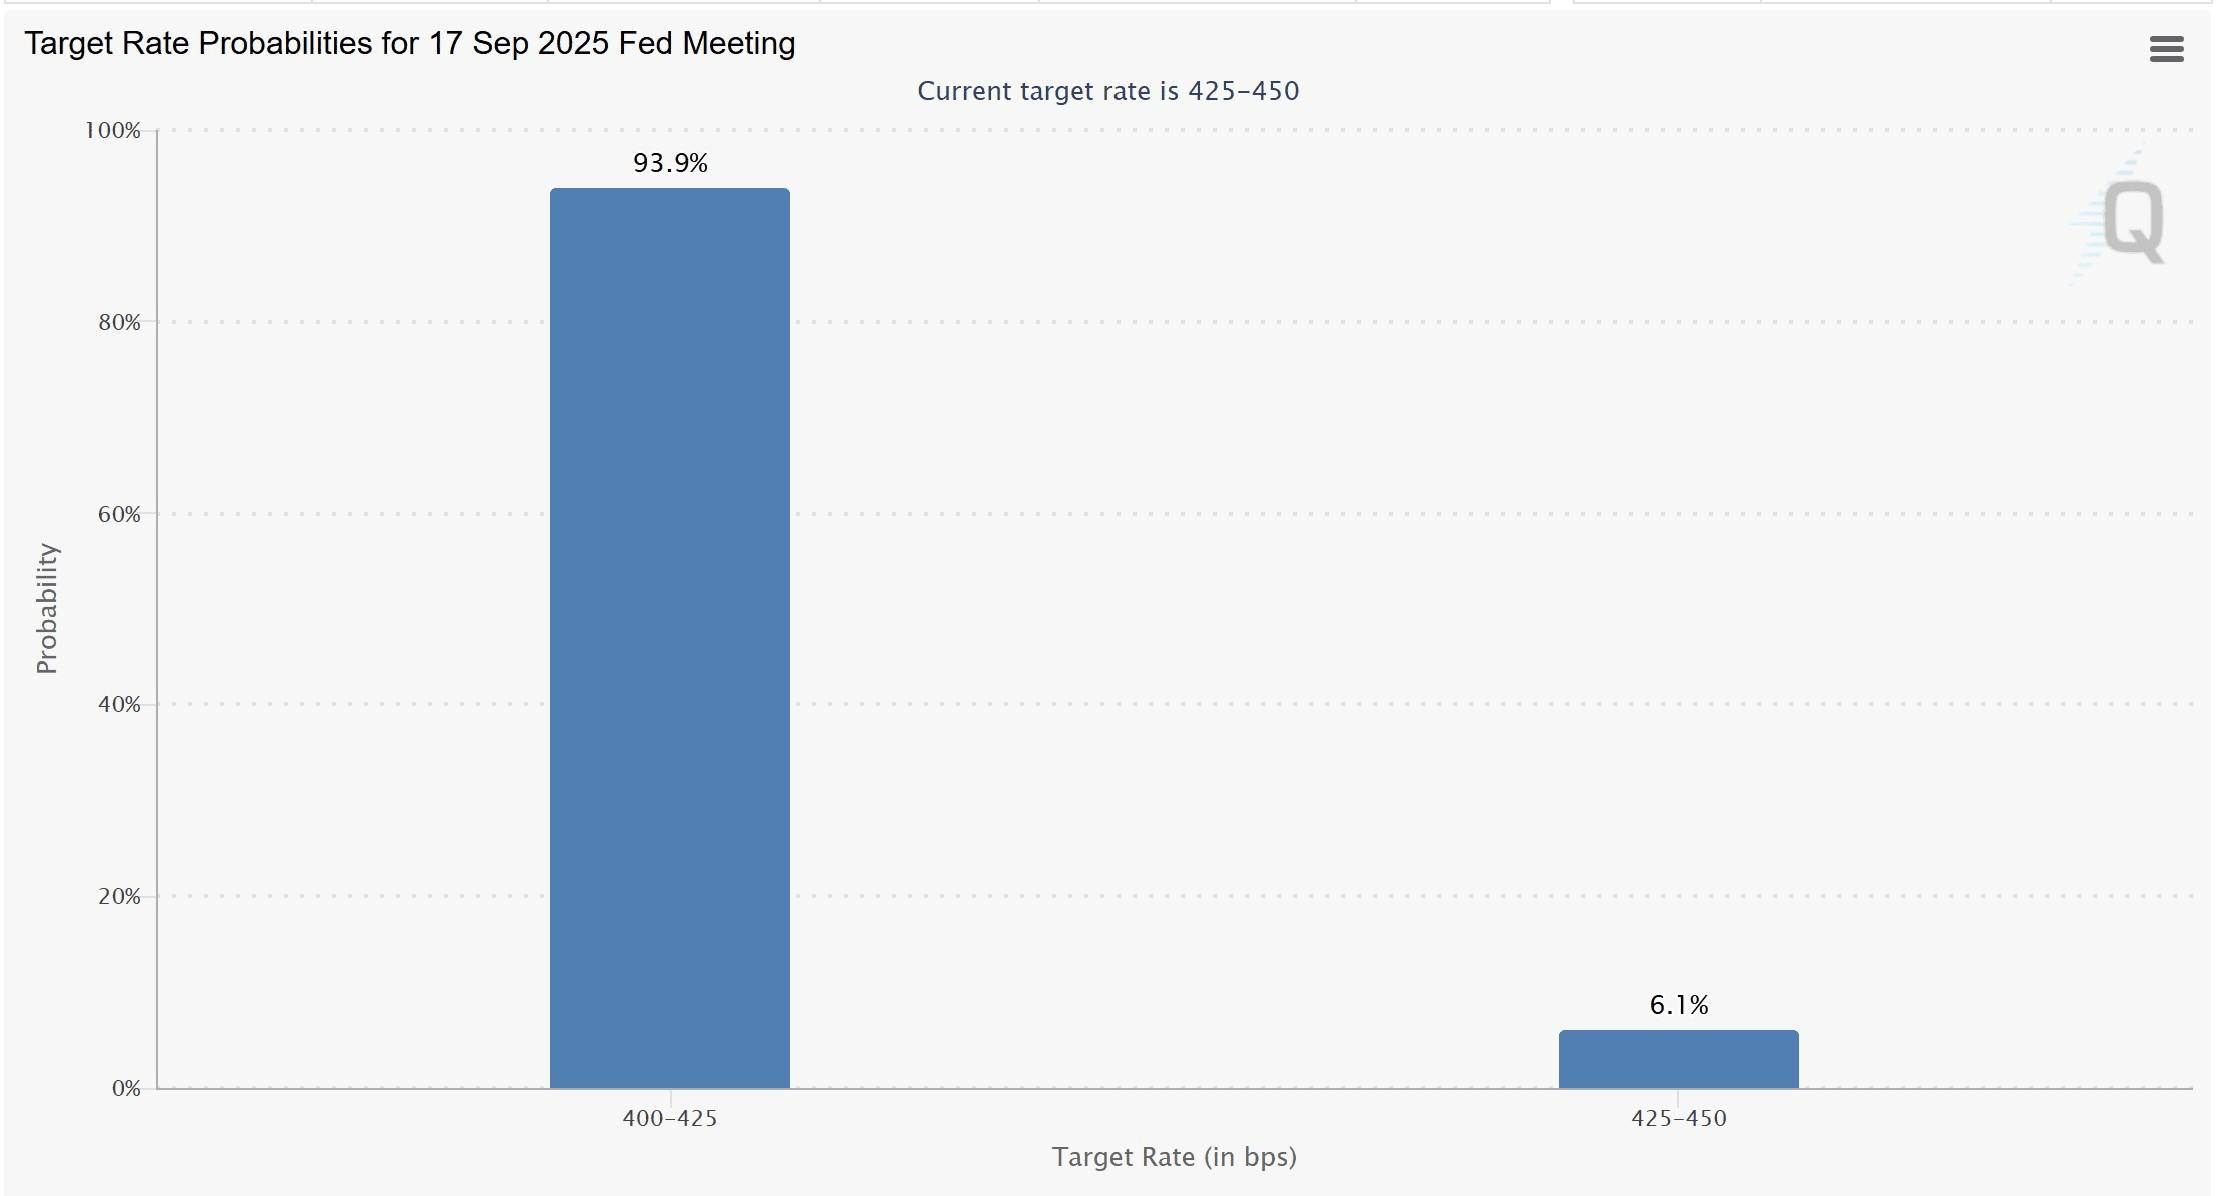
According to CME FedWatch data, after the CPI announcement, market expectations for a rate cut by the Federal Reserve in September soared to 93.9%, with traders betting on a higher likelihood of monetary policy easing.
However, the core CPI meeting expectations indicates that potential price pressures still exist, meaning the Federal Reserve may still need more evidence before taking action.
Looking ahead, the producer price index (PPI, estimated at 2.3%) and core PPI (estimated at 2.5%) to be released later this week could serve as key indicators. If the data comes in below expectations, it will help confirm the macro bullish environment for Bitcoin, further strengthen rate cut expectations, and boost demand for risk assets.
Will Bitcoin hit $130,000 in September?
After a bullish weekend, Bitcoin briefly surged to $122,190 on Monday, but the rally quickly retraced 3% to $118,500, failing to hold above $120,000 at the daily close.
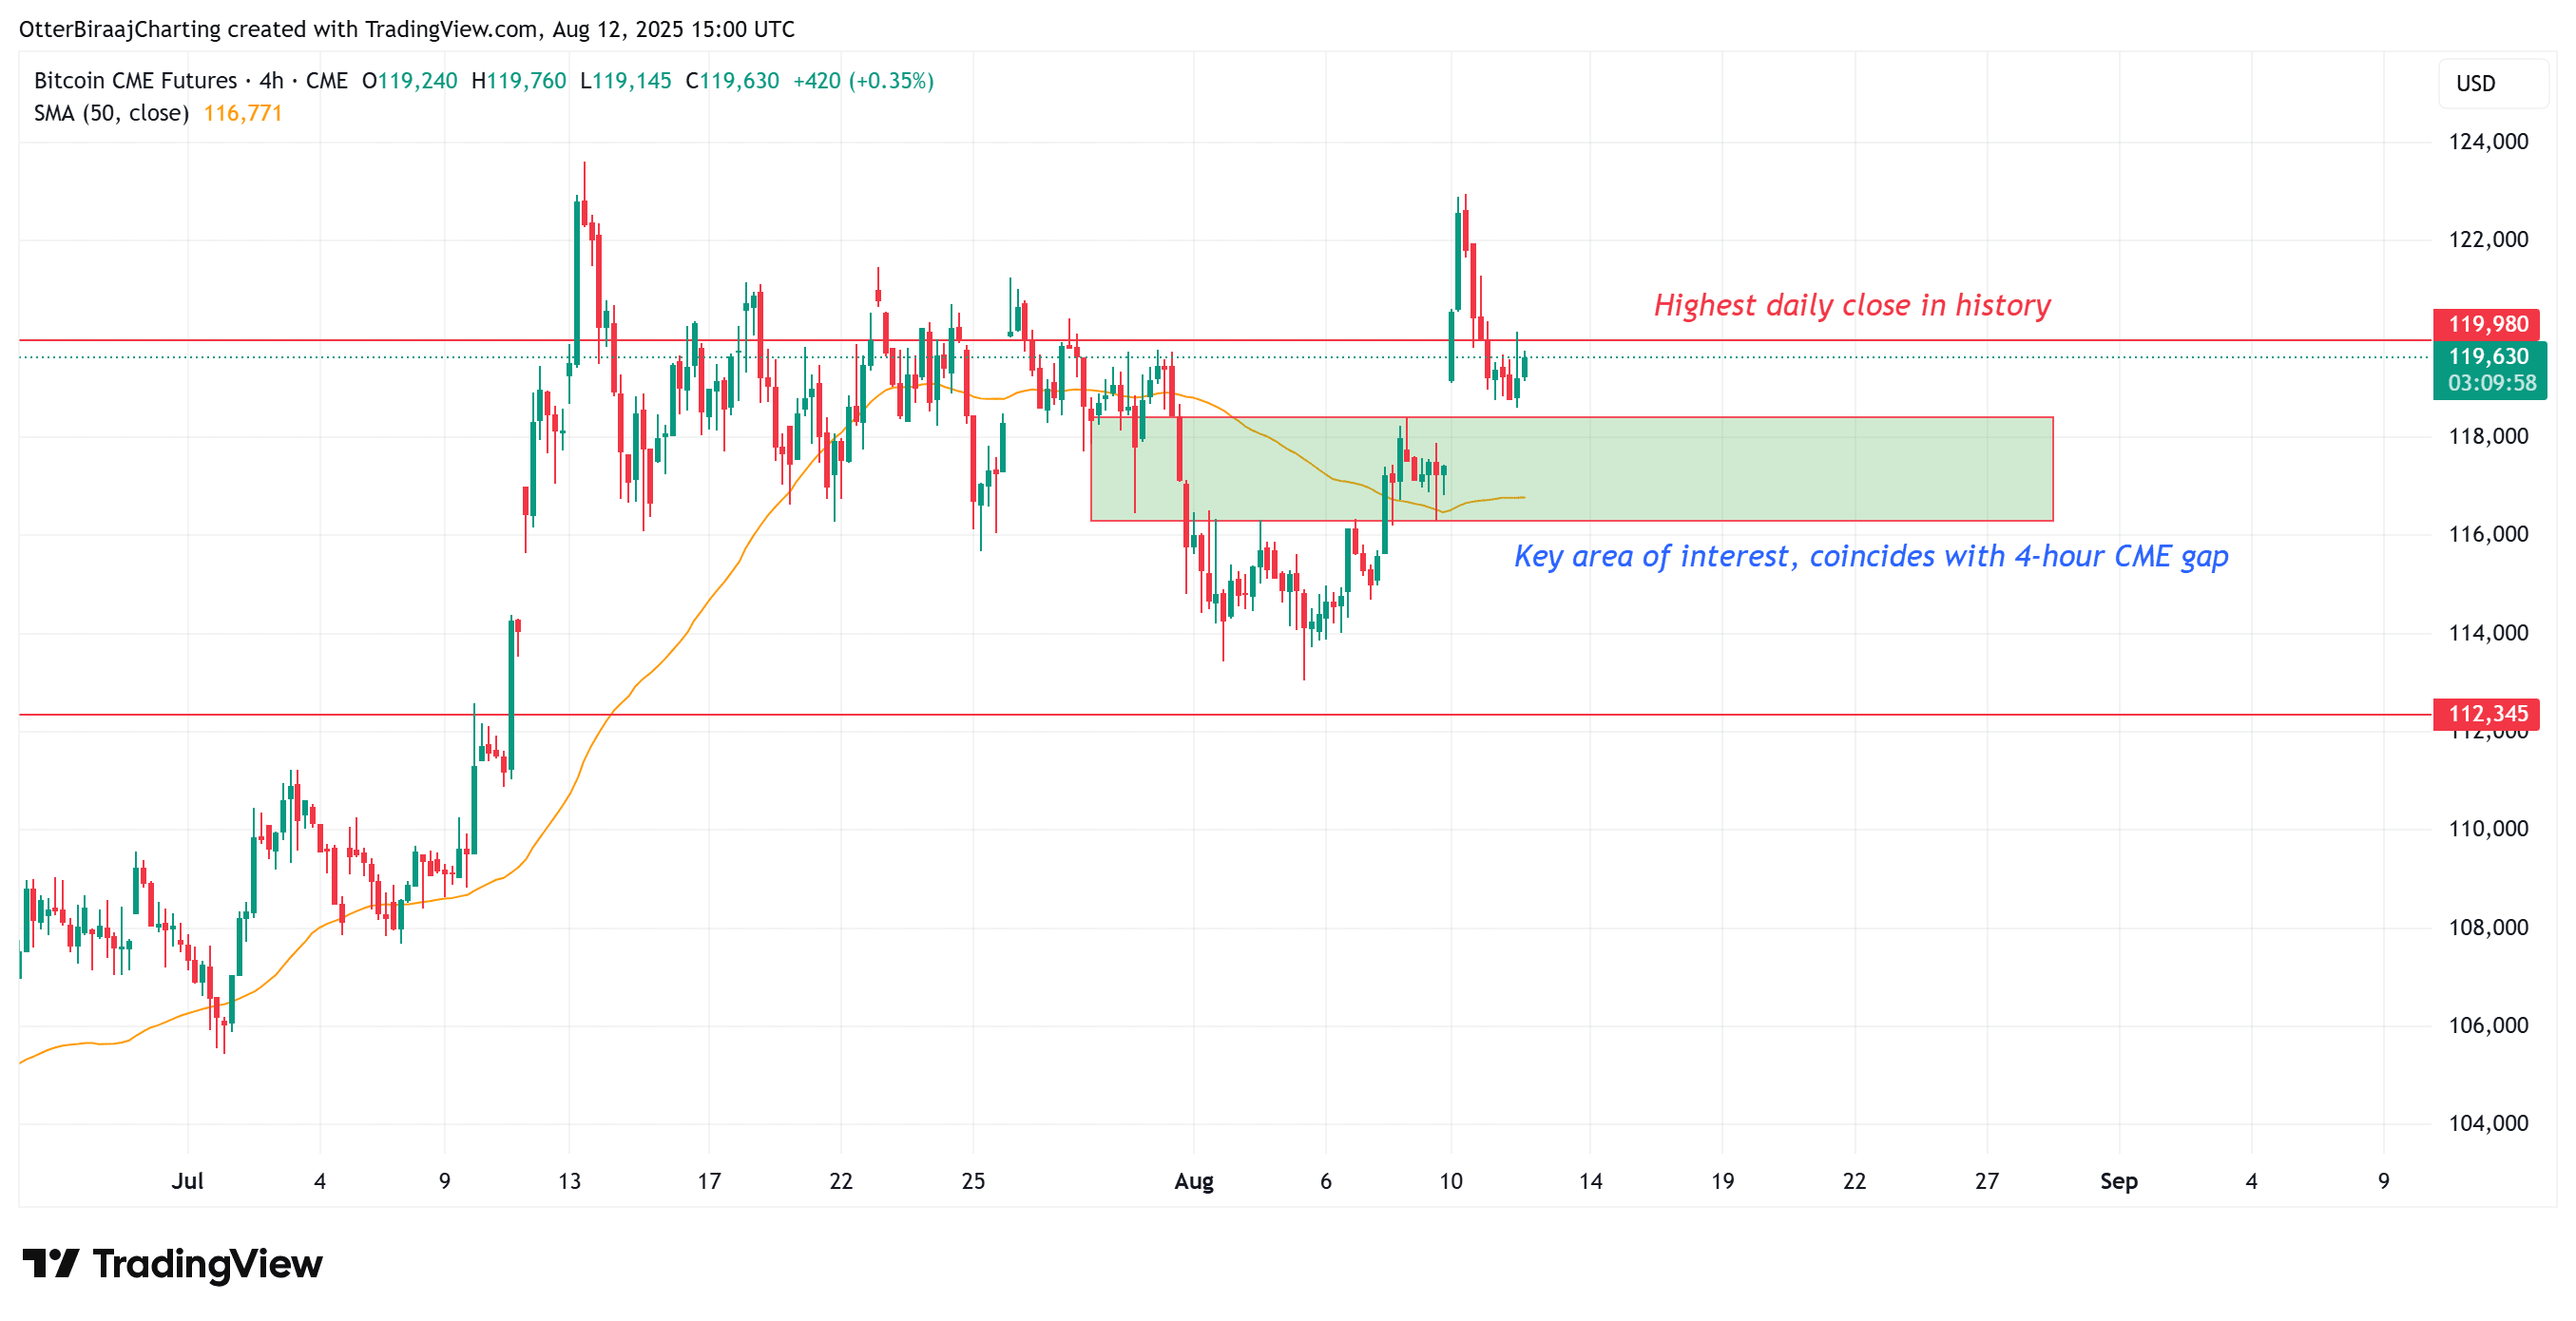
After the CPI announcement, BTC rebounded to $119,500, but whether it can effectively close above $119,982 is still key to confirming short-term upward momentum. If the daily close breaks above $120,000, it will be a historical first, likely triggering a new round of upward movement.
Technically, the bullish flag pattern on the daily chart has recently broken upward, and the current pullback may be a retest to confirm support, followed by a continuation of the upward trend, targeting $130,000.
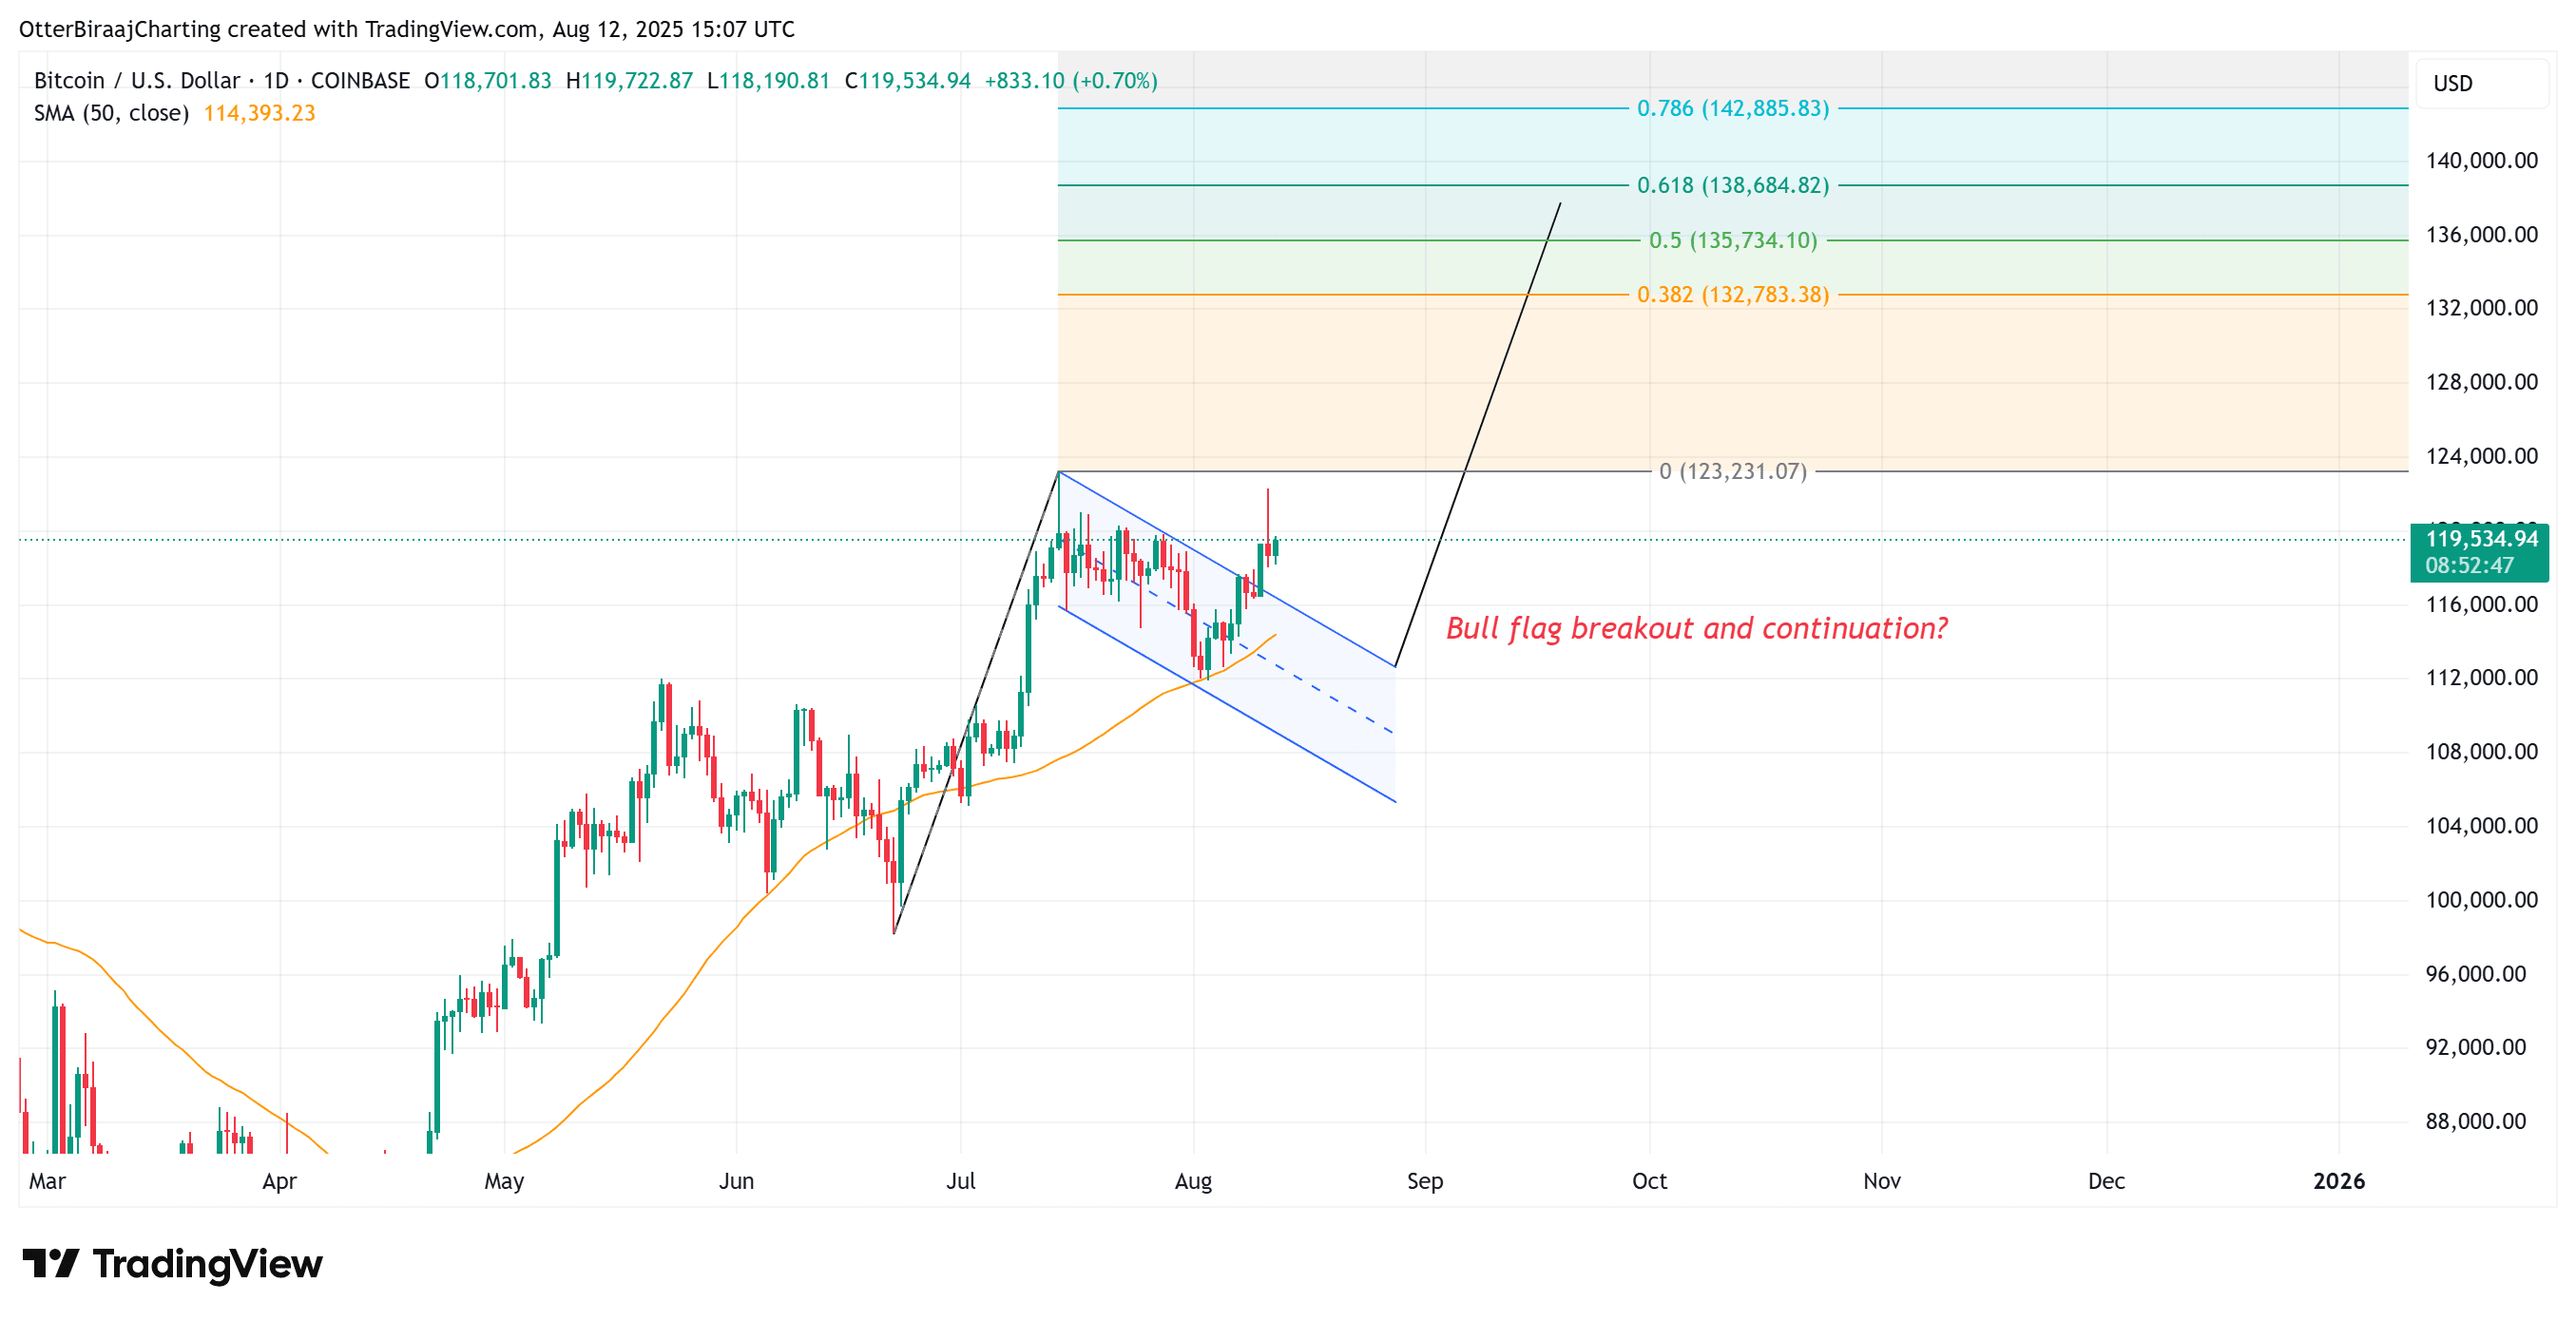
Technical analyst TitanofCrypto also gives a similar bullish outlook, believing that based on the breakout of the downtrend line that appeared on Sunday, the target price for BTC could reach $137,000.
However, if it fails to regain the $120,000 level, it may face downward pressure in the short term, with the $117,650–$115,650 range being an important support area, which also overlaps with the CME gap formed over the weekend, making it a key focus for traders.
As Cointelegraph points out, even though Bitcoin is currently at a high level, it does not mean it is completely immune to the risk of losing the key support level of $100,000. If a deep correction occurs, prices could test levels as low as $95,000.
Ethereum's surge is astonishing.
The price of ETH has risen above $4600, up 10% in the past 24 hours, as the market digests the possibility of a rate cut in September. Some traders believe that ETH is likely to quickly challenge the historical high of $4876 set in 2021.
Polymarket bettors go further, believing that ETH has a high probability of breaking through $5000 by the end of August, giving a 28% chance that the price will break $5800 before the end of the month.
This surge has pushed Bitcoin's market dominance down from 65% to 59%, as traders are shifting from Bitcoin to other altcoins.
Glassnode analysts wrote in a recent report that ETH is approaching the 'active realized price' 1 standard deviation range of about $4700, a level that has triggered significant sell-offs in previous cycles.
However, behind the scenes, there is an increasingly growing liquidity 'black hole' that may put pressure on the next phase of ETH’s growth.
A new report from CryptoQuant shows that Ethereum is increasingly becoming a source of liquidity for the USDT ecosystem on the TRON network.
Data from August 9 shows a record $7.7 million worth of ETH was transferred across chains to TRON and exchanged for USDT, while on June 25, $19 million worth of ERC20 tokens (mainly USDC) underwent the same transfer.
The funds flowing back from TRON to Ethereum are almost negligible, and this one-way value flow supports the stablecoin economy of TRON while draining liquidity from Ethereum's native DeFi activities.
In the long term, persistent capital outflows could suppress spot demand and reduce Ethereum's ongoing fee income and staking rewards, as more stablecoin transactions are settled on other networks.
If this trend continues, Ethereum's role may increasingly resemble a wholesale financing layer providing liquidity to competing networks, rather than capturing trading activity itself. This dynamic may not hinder the current upward trend in the short term, but if capital continues to flow out to faster and cheaper settlement layers like TRON, it may limit the sustainability of high valuations.

