---$SOL
🚨 SOL/USDT Market Update – Rising Wedge Alert! 🚨
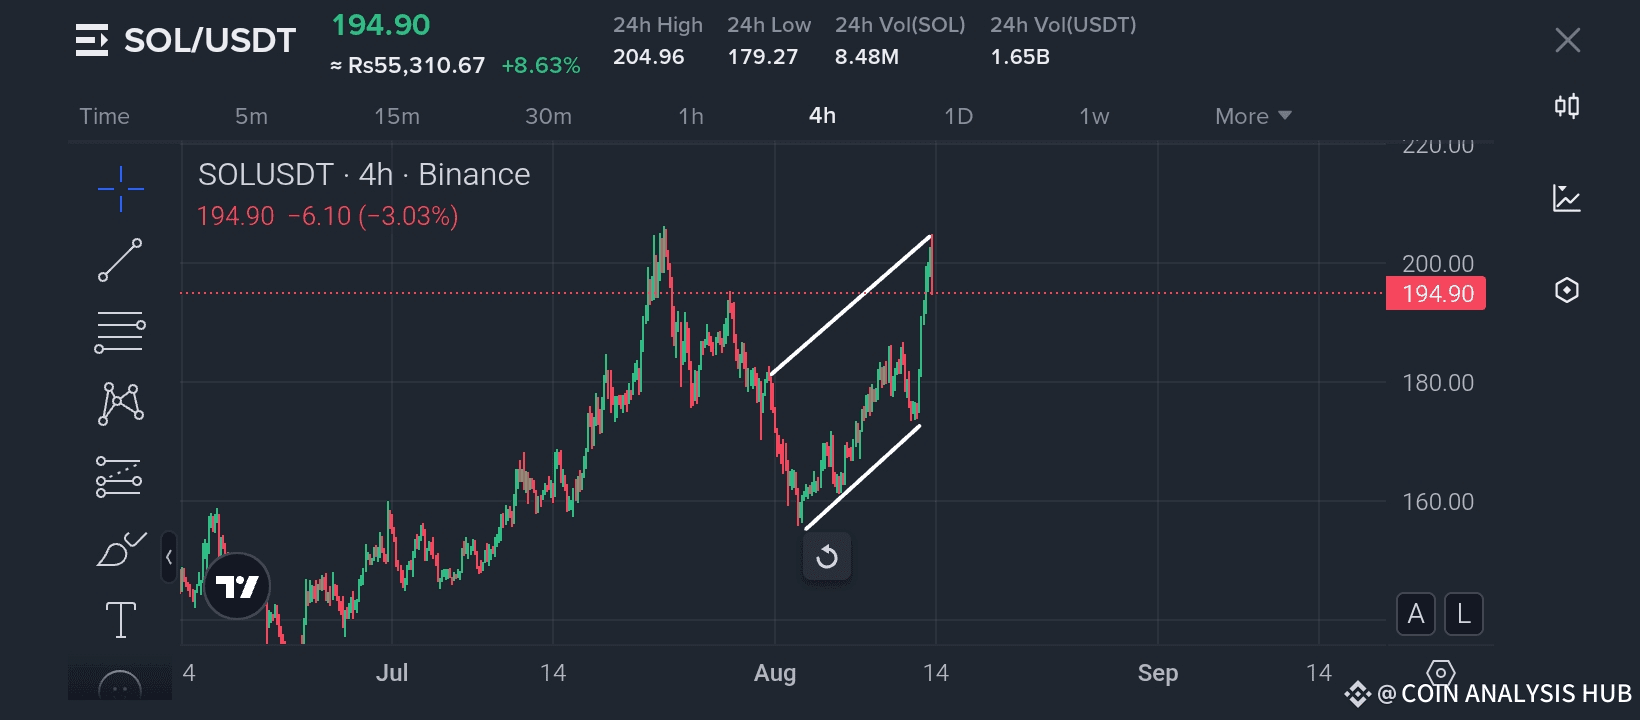
Current Price: $194.90 (-3.03% in last 4H)
24H High: $204.96 | 24H Low: $179.27
24H Volume: 8.48M SOL
---
📊 Technical Overview:
On the 4-hour chart, Solana has been moving within a rising wedge pattern – a structure often seen as a bearish reversal formation when it occurs after an uptrend. Price has surged from around $160 to above $200 in just a few days, showing strong bullish momentum. However, the latest candle shows a rejection at the upper resistance line of the wedge.
Key observations:
Pattern: Rising wedge (generally bearish if confirmed)
Resistance: ~$205 (upper trendline)
Support: ~$185 (lower trendline)
Momentum: Price is overextended after a strong rally, making a pullback possible.
---
📌 Bullish Case:
If SOL can break above $205 with strong volume, it may invalidate the bearish wedge and push towards the next resistance near $220. This would require continued market-wide strength and strong buyer pressure.
📌 Bearish Case:
If price fails to break resistance and closes below the wedge’s lower support (~$185), we could see a correction towards $175–$160 levels. A breakdown with high volume would confirm this bearish scenario.
---
💡 Trading Approach:
Aggressive traders: Watch for a breakout above $205 or breakdown below $185 for entry signals.
Conservative traders: Wait for confirmation outside the wedge pattern before committing.
Risk management: Place stop-loss orders based on your entry and wedge boundaries to manage downside risk.
---
---
📅 Outlook:
The next 24–48 hours will be crucial for SOL. Either the bulls push through and break the wedge to the upside, or sellers take control for a healthy correction. Keep an eye on BTC’s movement as it will heavily influence SOL’s direction.
---#ETH5kNext?
#Solana #SOL #CryptoTrading #TechnicalAnalysis #Binance #SOLUSDT #PriceAction #ChartPatter