The Dogecoin to USD exchange rate has begun a new round of increase from the $0.1950 area. Dogecoin is currently in a consolidation phase, with a target of breaking above $0.2250.
DOGE price has started to rise again above $0.2120.
The trading price is above the level of $0.2150 and the 100-hour simple moving average.
On the hourly chart for DOGE/USD, a key bullish trend line is forming, with support at $0.2150 (data from Kraken).
If the price breaks above the resistance levels of $0.2250 and $0.2350, a new round of increase may begin.
Dogecoin price regains upward momentum
Dogecoin's price has started a new round of increase above the resistance level of $0.2020, similar to Bitcoin and Ethereum. Dogecoin has successfully broken above the resistance levels of $0.2120 and $0.2150.
The price has clearly broken above the level of $0.220. Ultimately, the price tested $0.2250. The high formed at $0.224, and the current price is consolidating above the 23.6% Fibonacci retracement level of the upward move from the low of $0.1956 to the high of $0.2243.
Dogecoin's price is currently trading above $0.220 and has broken above the 100-hour simple moving average. A key bullish trend line is forming on the DOGE/USD hourly chart, with support at $0.2150.
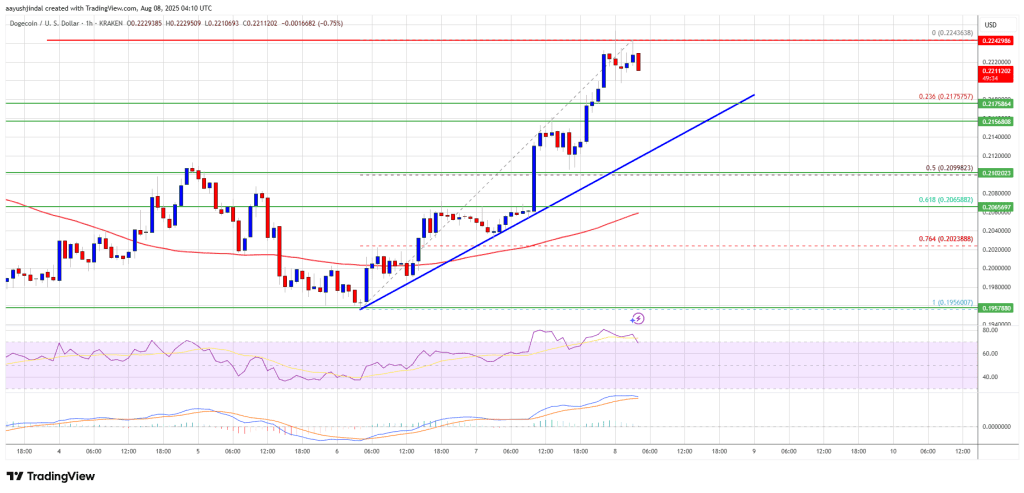 The immediate resistance level on the upside is around $0.2250. The first major resistance level for the bulls could be around $0.2320. The next major resistance level is around $0.2420. If the closing price breaks above the resistance level of $0.2420, it could push the price towards the resistance level of $0.250. If the price continues to rise, it may push towards $0.2650. The next major stop-loss level for the bulls could be $0.2780.
Is DOGE dropping again?
If the Dogecoin price fails to break above $0.2250, a new round of decline may begin. The initial support level on the downside is around $0.2175. The next major support level is around $0.2150.
The main support level is at $0.210, which is the 50% Fibonacci retracement level of the upward move from the low of $0.1956 to the high of $0.2243. If the support level at $0.2150 is broken, the price may decline further. In this case, the price could drop towards $0.2050 or even $0.2020 in the short term.
Technical indicators
Hourly MACD – The MACD for DOGE/USD is currently gaining momentum in the bullish zone.
 Hourly RSI (Relative Strength Index) – The RSI for DOGE/USD is now above the 50 level.
Major support levels – $0.2175 and $0.2150.
Major resistance levels – $0.2250 and $0.2320.