The forecast sheet on the price trend of ChainLink (LINK) is based on the combined use of technical analysis, fundamental data, and sentiment.
The drafting criteria for this sheet follow three basic guidelines:
Technical Analysis: is based on historical price and volume data to identify trends and patterns. Trend, momentum, and volatility indicators are used;
Fundamental Analysis: evaluates the factors that influence the intrinsic value of a cryptocurrency, such as market capitalization, circulating and total supply of the token. The size of the community, the leadership team, listings on major exchanges, partnerships with reliable institutions;
Sentiment Analysis: measures market sentiment through social media activity and news.
Current scenario of ChainLink
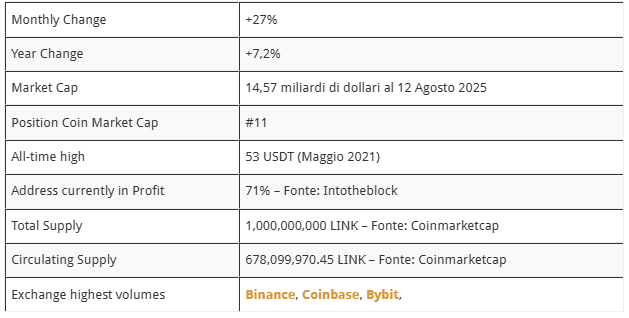
Strongly positive trend in August for the price of $LINK which records a +27% and also brings the performance from the beginning of 2025 into the green. This rebound phase from the April low of 10.10 USDT marks about a +120%. At the current value, ChainLink has reached the number 11 position in the coin market cap ranking, surpassing Hyperliquid.
ChainLink: Historical Scenario
In this summer of 2024, the entire Altcoin sector is thriving and ChainLink has joined the bullish phase. Observing the attached monthly chart of LINK, we have an overview starting from 2021, when it recorded its ATH in May at 53 USDT. From there, a strong bearish phase followed, with a correction from the peak of about -90% until the low of June 2023 at 4.76 USDT.
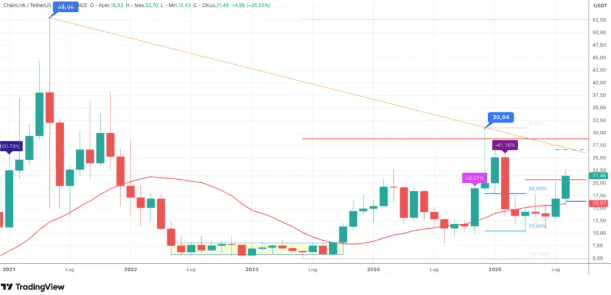
The chart also highlights a congestion, with the price substantially lateral from June 2022 until October 2023, when the breakout and a first upward acceleration occurred, followed by a bearish swing with a low in August 2024 at 8.08 USDT. From this point, a consolidation phase began, culminating in a rally that brought, in December 2024, the price of LINK to a peak of 30.94 USDT.
In 2025, after a January close at -41% (the worst month for LINK since March 2020), a low of 10.10 USDT was recorded in April, from which a consolidation phase began. In July it closed with a +26.50%, followed by August at +27%. Currently, LINK is recording the breakout of the vector resistance at 20.75 USDT, corresponding to the 50% Fibonacci of the movement from the December peak to the April low.
The first target is a reach in the area of 26.50 USDT, with subsequent resistance at 30 USDT. The main resistance, in the area of 30 USDT, corresponds to the 50% Fibonacci of the movement from the ATH to the minimum of 2023.
Fundamental analysis of ChainLink
From the attached table, we can see that the technical scenario of ChainLink shows strength.
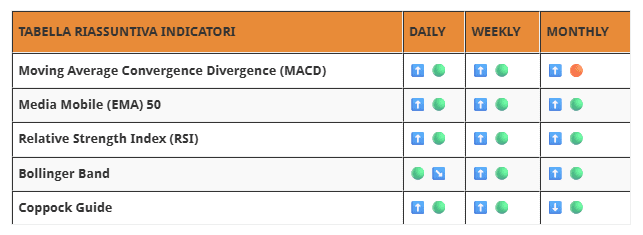
Short Term: LIKN shows an upward trend with SMA 50 and ADX increasing. Positive RSI, stochastic, and CCI in overbought territory confirm upward pressure, while the declining ROC signals a slight slowdown. Bollinger Bands and ATR indicate decreasing volatility.
Medium Term: SMA 50 and ADX confirm an upward setting with positive MACD and Aroon Indicator. RSI and ROC remain favorable, stochastic positive, and CCI in overbought territory. Price near the upper Bollinger band indicates active push and potential trend extension.
Long Term: the positive trend is confirmed with a bullish outlook with RSI in overbought territory and increasing stochastic, signaling structural strength. The target for continuation is the breakout of the first relevant resistance at 26.50 USDT.