Everyone was expecting Ethereum, but instead, Bitcoin (BTC) reached a new ATH. Late last night, and then during the night, it hit its new all-time high of $124,517, reached at 2:00 AM this morning. Since May 8, BTC has closed above $100,000 for 98 consecutive days.
New all-time high of Bitcoin
Since the beginning of 2025, BTC has already recorded five daily closes with a new ATH. The current one is the sixth.
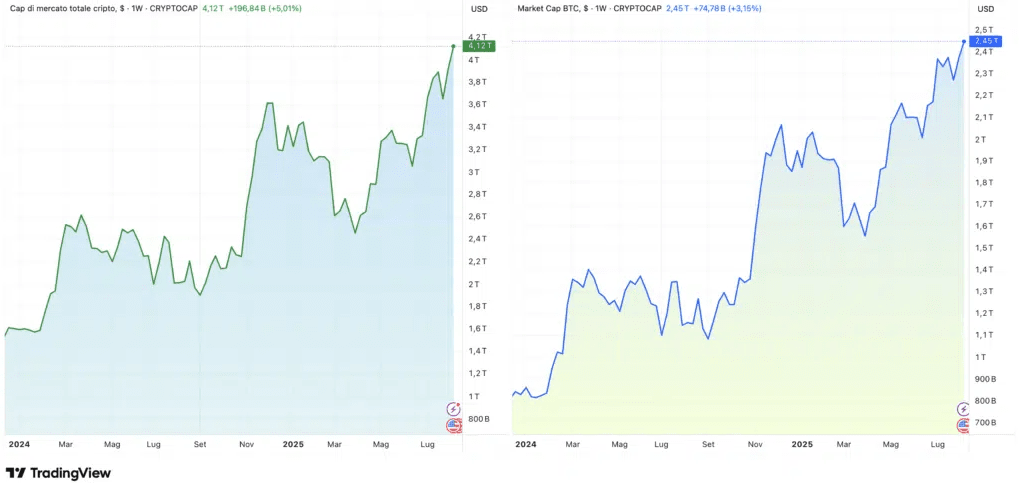
New crypto market cap record
With this movement, Bitcoin establishes its market cap at $2.450 trillion, while the total market cap of the crypto market records another high and reaches $4.12 trillion.
A new peak of the altcoin market cap is still missing, with TOTAL 3 standing at $1.1 trillion, still below the December high of $1.16 trillion.
Bitcoin dominance still declining
In this scenario of Bitcoin's new ATH, it should be noted that its BTC dominance is declining and stands at 59.4%, while that of altcoins, particularly Ethereum, is increasing. This indicates that the altcoin sector is recording better performance compared to BTC.
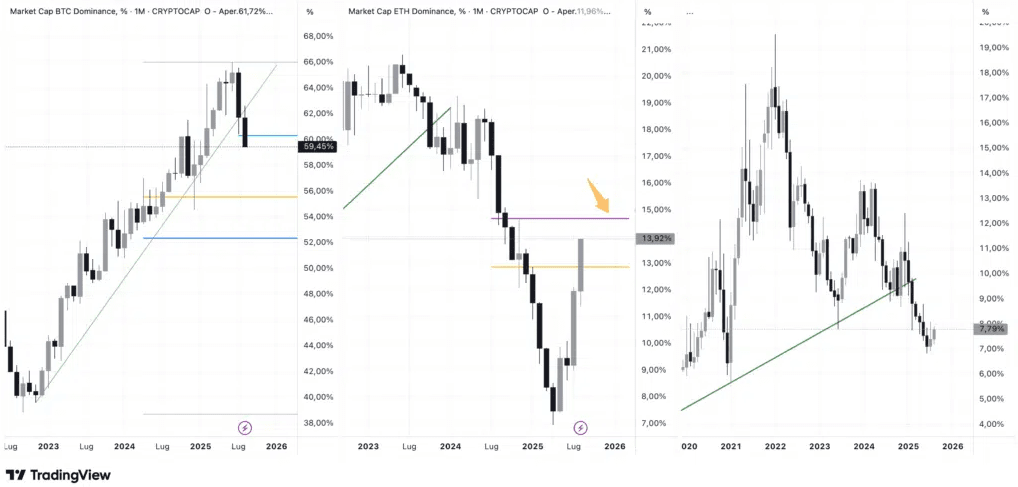
The 60% breakdown of BTC dominance at a technical level opens up a scenario for further decline. For a deeper look into this topic, we refer you to the analysis from August 10.
Celebratory overview of Bitcoin
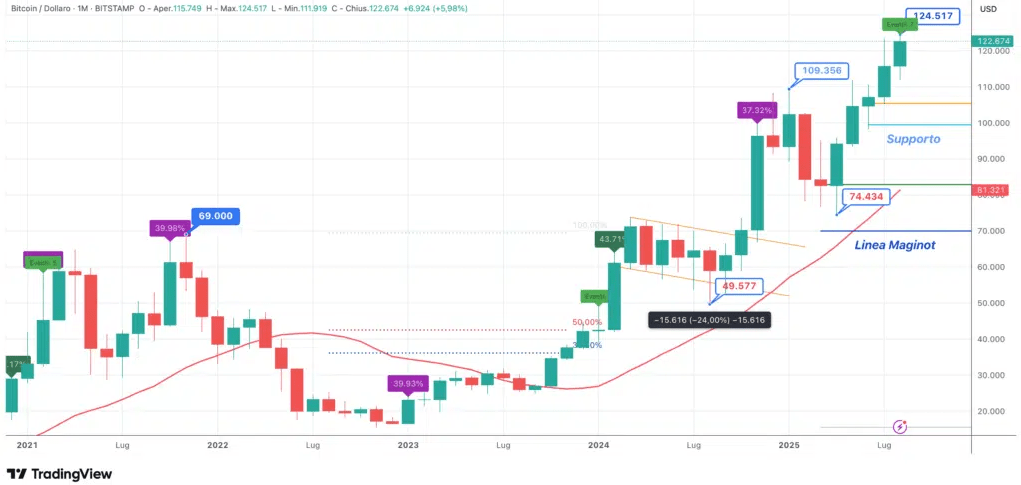
All the movements leading to the first all-time high of November 2021 at $69,000 can be observed, followed by a collapse to the low of November 2022 at $15,479. From there, the leg up began, driving BTC's rise over the last two and a half years, with a series of new highs in an uptrend characterized by phases of consolidation and corrections. In the last 12 months, since August 2024, BTC has risen from the low of $49,577 to almost +150%.
Since August 2024, BTC is at +150%
With the ongoing rise in August, Bitcoin is registering its fifth consecutive positive month, an event that has occurred seven times in its history. The longest historical series of consecutive green months was seven, which took place between September 2023 and March 2024.
Daily scenario of Bitcoin
On the daily chart, we provide an overview of Bitcoin's movement since the low in June, recorded at $98,240, the last day it made an intraday move below $100,000. After the ATH on July 14, a consolidation phase developed, descending to test the SMA50, from which the bullish phase resumed at the beginning of August.
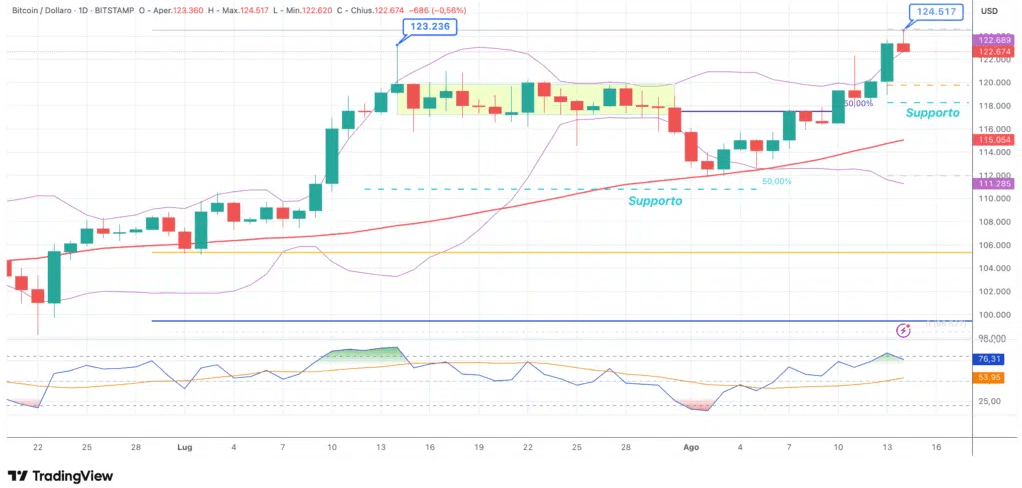
Consolidation and new ATH
For several days, the price felt the resistance at $117,500, then broke it upwards and reached the new all-time high of $124,517 during the night.
At the time of writing, Bitcoin is slightly retracing with an outside candle to the upper Bollinger Band. However, it is too early to assess patterns or reversal signals. In terms of supports, the first short-term one is around $119,770, while the most relevant one is located around $118,250.
The fast RSI confirms the strength of BTC, entering the overbought area, which, we remind you, is not automatically a reversal signal. It should also be noted that the RSI remains below the peak recorded at the July high.

