Among cryptocurrencies, Monero (XMR) stands out negatively, suddenly turning red in a positive August for the vast majority of the market. The decline is linked to a suspected 51% attack on its hashrate.
Attack on Monero, hypotheses and uncertainties
The picture is not yet clear. Some accuse the company Qubic, led by Sergey Ivancheglo, of a publicity stunt, but something does seem to have actually happened on the blockchain.
All of this is causing a decline in the price of Monero, which closed yesterday with a -5.32% and today marks the fourth consecutive day of decline. In reality, the downward phase has been ongoing for several weeks and is not a bolt from the blue.
Weekly overview of Monero
As of now, Monero has a market capitalization of $4.625 billion and occupies position number 31 on CoinMarketCap, and has been listed in the crypto market since 2014.
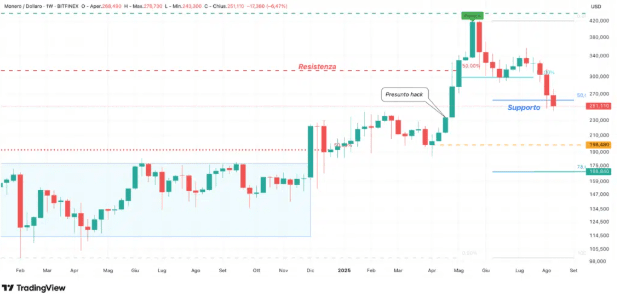
On the weekly chart, we can observe an overview of the price of XMR starting from the beginning of 2024, where a part of the congestion that began in July 2022 is visible. This congestion lasted throughout 2024 and shows how the price has stopped several times at the resistance area of $177.
Breakout in December 2024 and rise in 2025
The breakout occurred in December 2024, with a weekly candle rising by 37%, from which an upward phase began that brought XMR to touch a high of $420.190 in May 2025.
This rise has also been characterized by a sequence of seven consecutive weekly green candles. Since May, however, a bearish phase has begun which found initial support around $300. After an initial reaction at this support, a new phase of price decline started, which pushed Monero to break the main support level in the $260 area. This level corresponds to the 50% Fibonacci of the vector between the low of February 2024 at $100.27 and the high of May 2025 at $420.
The breakdown of this vector level puts Monero in a condition of exiting the main uptrend that characterized its performance over the last eight months. In this scenario, the possibility of further decline opens towards an initial static area between $197 and $200, with subsequent vector support in the $170 area.
Short-term scenario for Monero
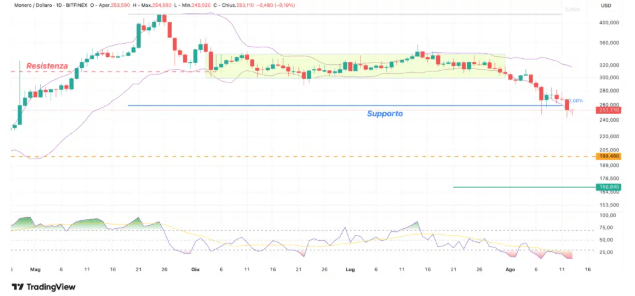
On the daily chart, we have an overview of the movement from the May high and the subsequent downward phase of Monero. A phase of lateral movement can be observed between May and June, followed by the breakdown that started at the beginning of August.
Currently, $XMR is below the medium-term support in the $260 area. Analyzing the RSI indicator, a situation of weakness emerges, in oversold territory. As for the Bollinger Bands, we have no evidence of being oversold, with candles completely outside the lower band.
What to watch for on XMR
For any entries, it is necessary to wait for chart patterns that may highlight possible reversal signals for Monero. All this takes place in a context of uncertainty, also linked to the alleged Qubic attack; any denials could lead to rapid price squeezes.