Among the altcoins that are performing better in recent hours, there is a relatively new token called Ethena (ENA), which is currently priced at 0.7197 UST.
In August, Ethena is growing by +26.60%, following July's rally with +113%. However, since the beginning of the year, it still shows a negative performance of -20.80%
The token $ENA, launched in April 2024, has recorded a growth of about 600% over the past year. Currently, it has a market capitalization of 4.83 billion dollars, allowing it to rise to position number 30 in the CoinMarketCap ranking.
USDe: the Stablecoin of Ethena
Ethena is the protocol underlying the issuance of the stablecoin USDe, which has reached a market capitalization of nearly 10 billion dollars in about 18 months, as can be seen in the attached chart from the specialized site DefiLlama.
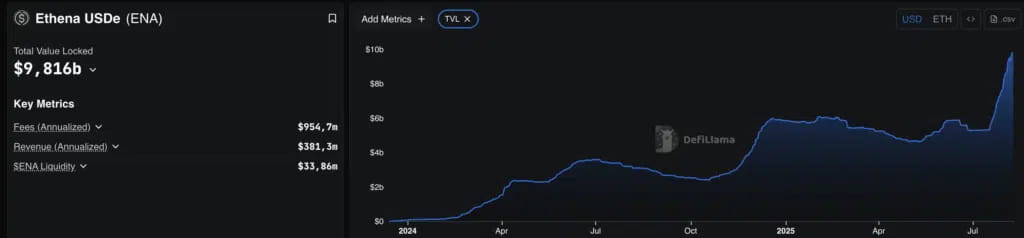
USDe is a synthetic stablecoin, pegged to ETH and BTC and balanced with short positions on derivatives.
Historical Overview of Ethena
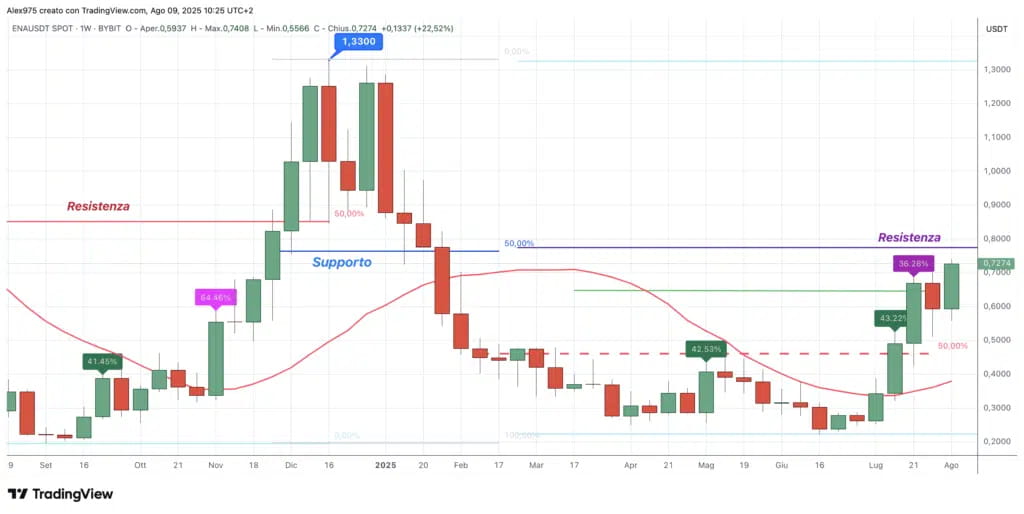
Ethena recorded its ATH at 1.52 USDT shortly after its listing in April 2024. The weekly chart shows an overview of the movement over the last year: last summer, the price experienced a crash, dropping to 0.1940 USDT in September 2024.
From that low, a rally started, with acceleration in November that brought the price to a peak in December of 1.33 USDT.
The Crash of 2025 and the Restart
In the first part of 2025, the price of ENA experienced a new crash, hitting the annual low of 0.2225 USDT in June. Observing the chart, it is clear that between April and May, the bearish phase had started to lose strength.
Since the June low, a rising phase has begun which currently shows a +225% in seven weeks.
Key Resistance and Breakout Scenario
The price of $ENA is aiming for the vector resistance in the area of 0.77 USDT, already highlighted in our analysis of July 31:
The main resistance remains in the area of 0.77 USDT
Alessandro Lavarello - Professional Trader and Analyst of Criptovaluta.it
This level corresponds to the 50% Fibonacci, calculated from the December high to the June low. The breakout of this resistance would open a scenario of new strength for ENA, with the possibility of starting a bull market phase.
Short-term Analysis of Ethena
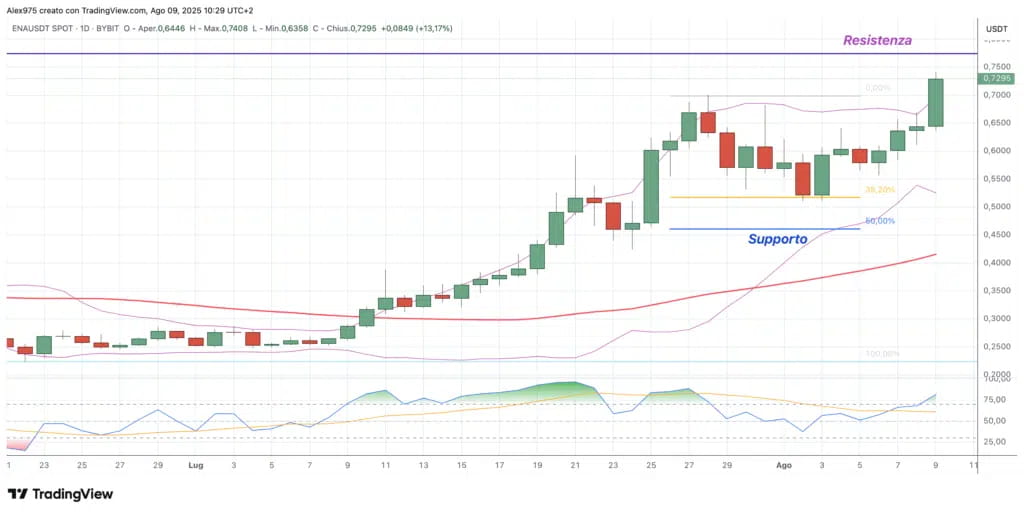
On the daily chart, the rebound phase from the June low is observed. After an initial consolidation phase in mid-July, an acceleration of the rise followed with increased volatility. Towards the end of June, a first correction occurred, dropping to the support area of 0.52 USDT, a level also indicated in our analysis of July 31. From there, a new rebound started, which today shows a daily candle up +12/13%.
Technical Indicators
In the lower part of the chart, the RSI is entering the strength area (overbought), confirming the ongoing uptrend. It is noted that overbought does not automatically imply a price reversal phase, contrary to what is often read.


