The drafting criteria for this report follow three main guidelines:
Technical Analysis: based on historical price and volume data to identify trends and patterns. Trend, momentum, and volatility indicators are used.
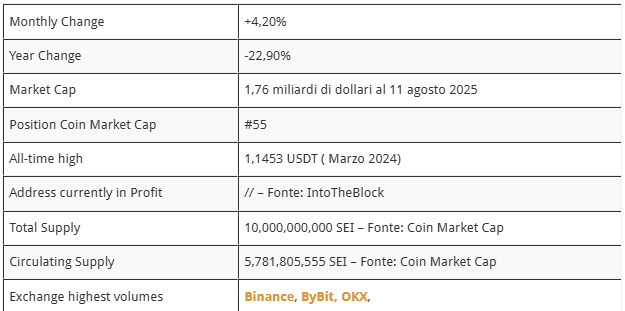
Fundamental Analysis: evaluates the factors that influence the intrinsic value of a cryptocurrency, such as market capitalization, circulating and total supply of the token. Community size, leadership team, listings on top crypto exchanges, partnerships with reliable institutions.
Sentiment Analysis: measures market sentiment through social media activity and news.
The token $SEI was listed in the summer of 2023 and reached an all-time high (ATH) of 1.1453 USDT in March 2024, driven by the rally that started in November 2023. After the peak, a strong correction followed, culminating in August 2024 with a low of 0.2024 USDT. From this level, a recovery began up to a high of 0.7135 USDT in November 2024.
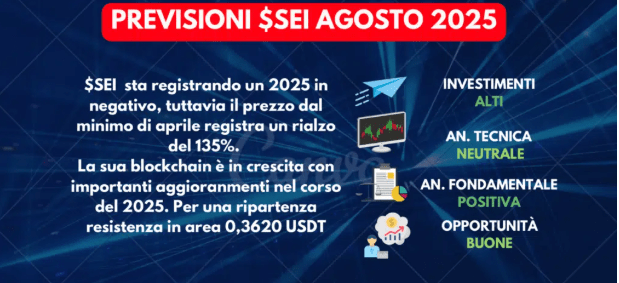
The rise at the peak of November came to a halt, and in the first four months of 2025, there was a continuous decline until the annual low in April at 0.1303 USDT. Subsequently, a series of bullish swings generated a +135% from the low, but the movement stopped in mid-July at the resistance of 0.3630 USDT, with the main resistance in the area of 0.4350 USDT at the long-term level.
In terms of short-term technical analysis, a declining SMA50 signals a loss of directionality, with negative MACD and Aroon and weak ROC, while RSI, Stochastic, and CCI indicate growing bullish pressure with a reversal after the decline. In the weekly analysis, SMA50 and ADX are rising, as are positive MACD, Aroon, RSI, and ROC, indicating a stronger trend, although declining Stochastic and CCI suggest possible consolidation. On the monthly chart, sideways RSI and rising Stochastic indicate potential accumulation, but negative ROC and weak Aroon highlight long-term fragility with the first significant resistance in the area of 0.3630 USDT.
Current Scenario of Sei (SEI)
The price trend of Sei during 2025 is still in a bearish phase, marking a decrease of about -21% since the beginning of the year. After undergoing a strong correction, the price is currently experiencing a rebound from the low recorded in April at 0.13 USDT, with a growth of about +138%. To resume a bullish trend, the price has a series of resistances to overcome.
Historical Performance of Sei
The token $SEI was listed on exchanges in the summer of 2023 and has about two years of existence. Its all-time high (ATH) was recorded in March 2024 at 1.1453 USDT.
Looking at the weekly chart, it can be observed that a bullish acceleration began in November 2023, leading to the achievement of the ATH. From this peak, Sei initiated a very deep corrective phase, which in the summer of 2024, about a year from its listing, reached a low of 0.2024 USDT.
From that level, a new rebound phase started, pushing the price back to a period high of 0.7135 in November 2024.
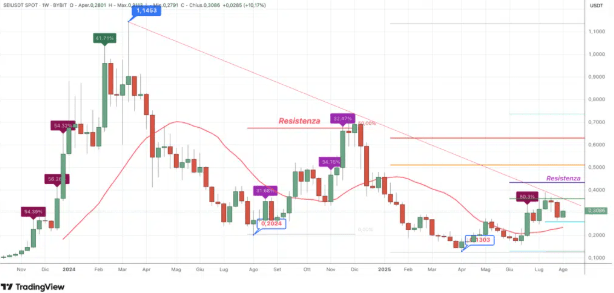
From this high, a correction phase of SEI began, lasting for the first four months of 2025, all closing in negative, until reaching an annual low in April at 0.1303 USDT, also breaking the previous low from August 2024.
From here, a bullish phase began characterized by a series of swings, currently marking a +135% from the low. The price, however, stopped in mid-July at the first relevant vector resistance in the area of 0.3630 USDT, initiating a slight retracement from there. The main vector resistance, relative to the movement from the December high to the April low, is instead located in the area of 0.4350 USDT.
