
Bitcoin is currently stuck in a critical range, facing heavy resistance near $115,500–$116,200. Despite a minor recovery after dipping to $112,000, BTC remains vulnerable to another deep drop if it fails to gain bullish momentum soon.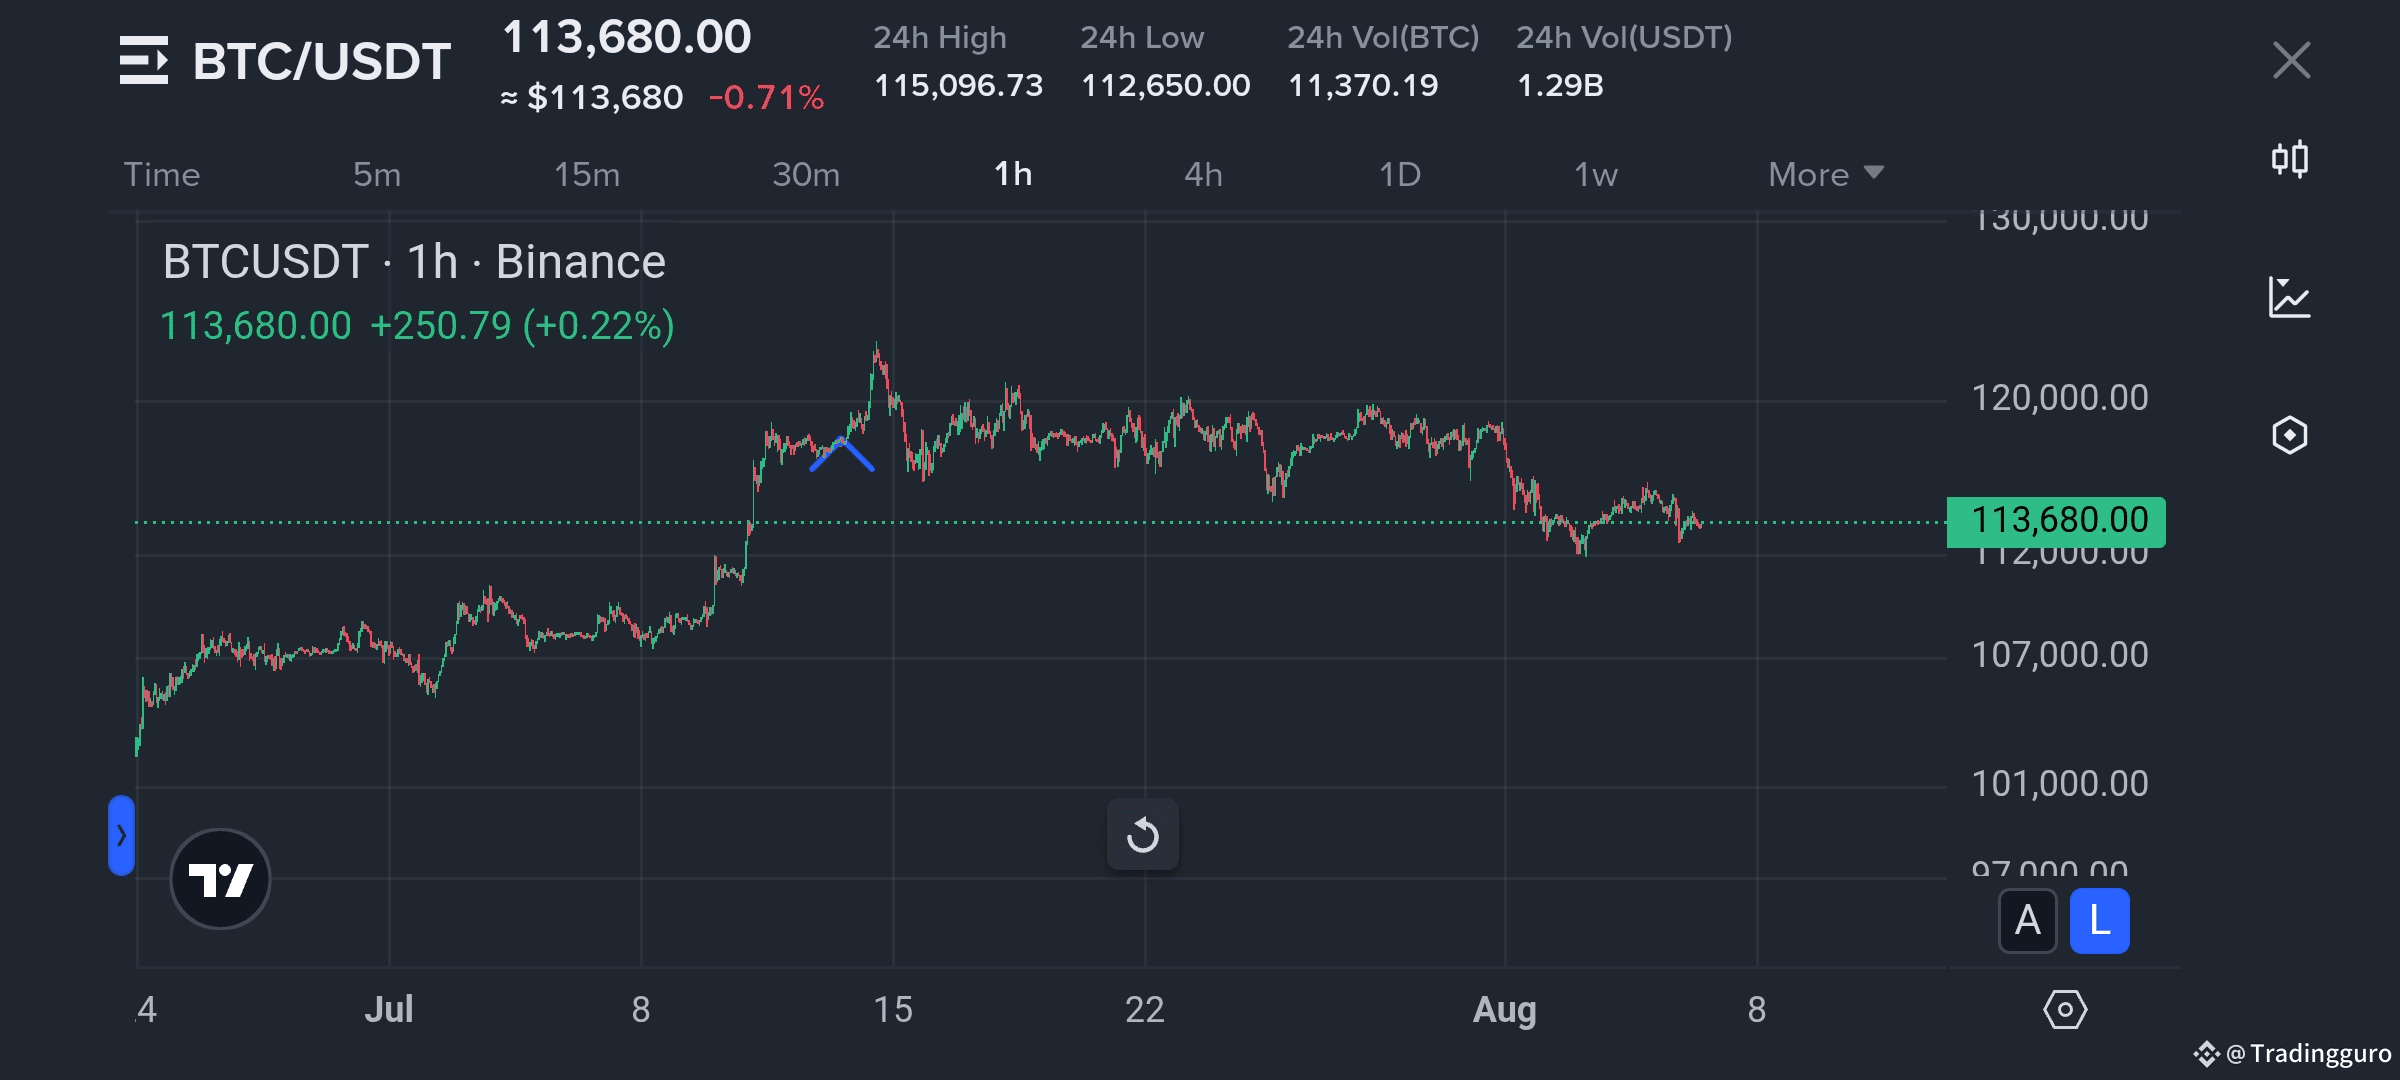
📉 Recent Price Action:
After sliding from $115,500, BTC fell below $114,000 and the 100-hour SMA, confirming a short-term bearish structure.
It found temporary support at $112,000, then bounced above $113,200 and $114,000, clearing the 23.6% Fib retracement of the $118,918 to $112,000 drop.
However, the recovery hit a wall near $115,500, which aligns with the 50% Fib level — a key bearish barrier.
📊 Technical Indicators:
MACD (1H): Bearish momentum is building, with no signs of a bullish crossover.
RSI (1H): Remains below 50, showing that sellers still dominate the market.
A downtrend line on the hourly chart also adds pressure near $114,400, reinforcing the current resistance.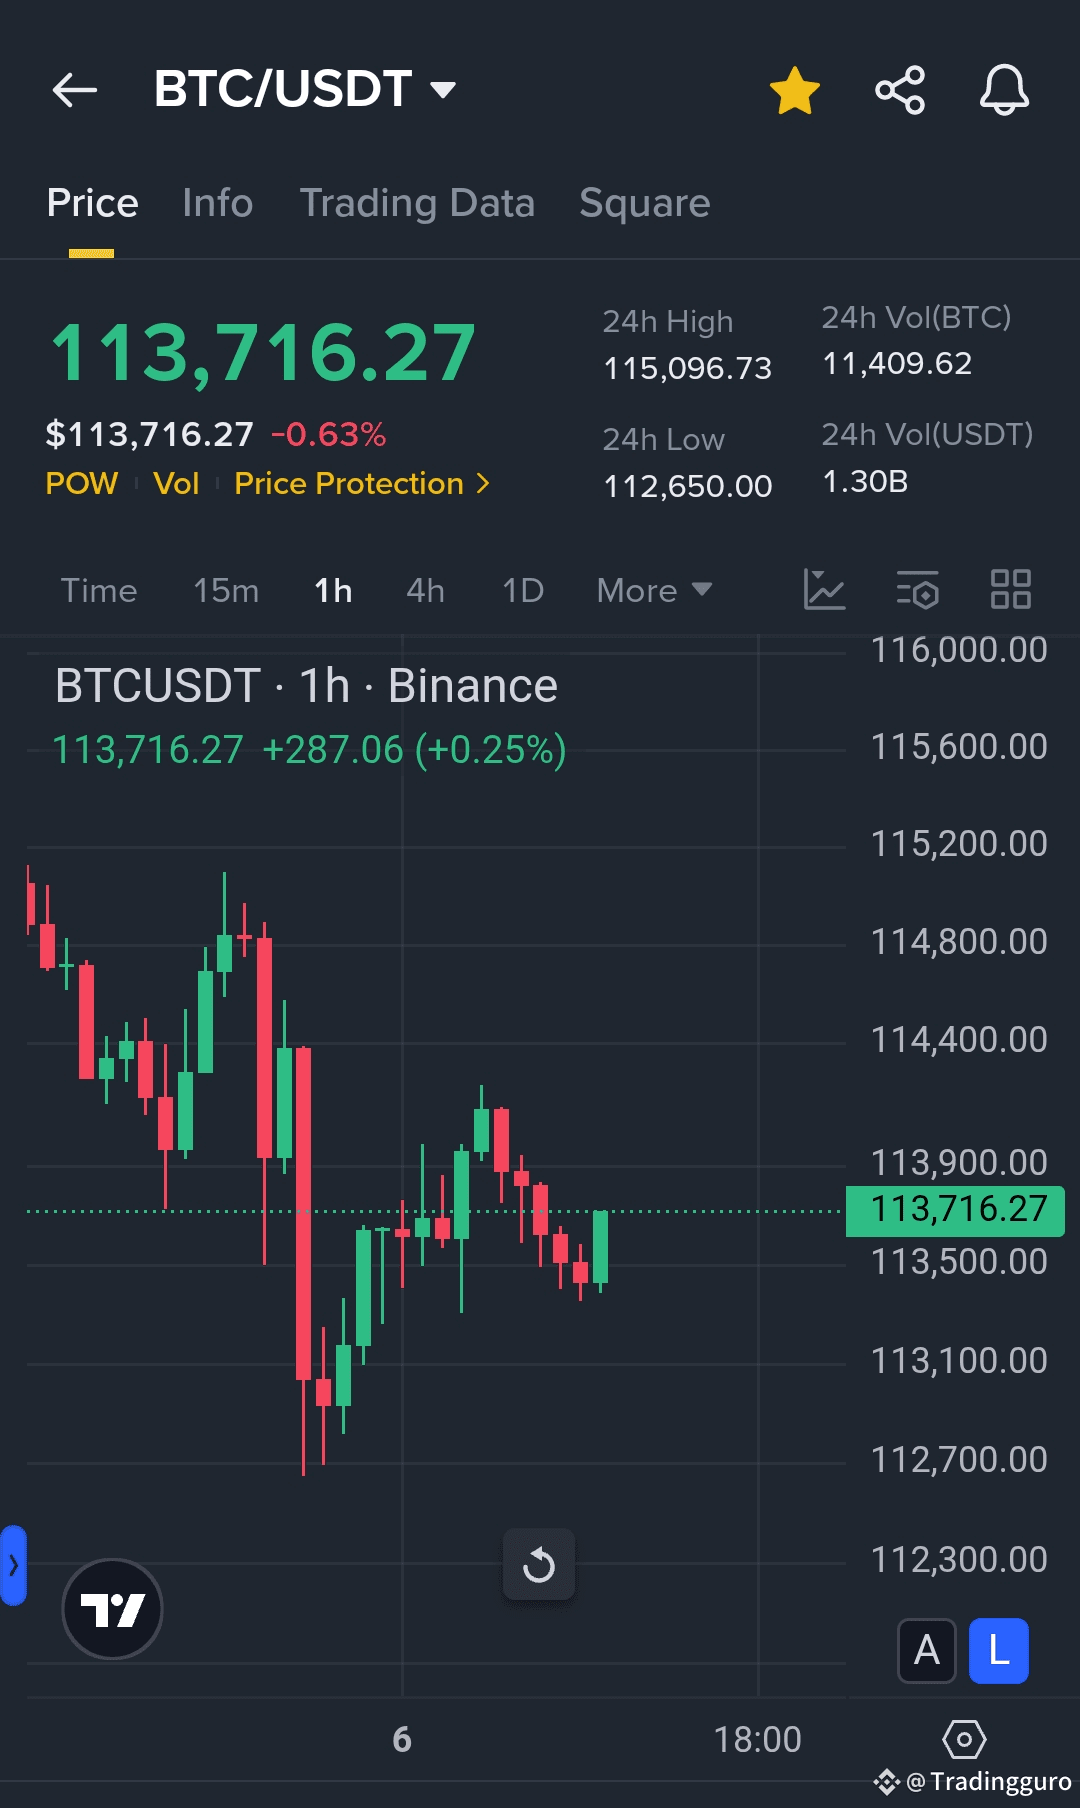
🛑 Resistance Levels:
$114,000 – short-term cap
$115,000 – major hurdle
$115,500 – deciding zone for trend reversal
Break above could push price toward $116,500, then $118,000, and possibly $120,000
⚠️ Support Zones:
$113,200 – initial support
$112,500 – key breakdown level
$112,000 – strong floor
Failure below $112K opens risk toward $110,500 and even $108,500
✅ Conclusion: BTC is consolidating, but a clear breakout above $115,500 is needed for any bullish continuation. Otherwise, the risk of a sharp fall remains. Traders should closely watch this range — the next big move could be fast and volatile.
