Bitcoin has once again stabilized at the key level of $112,000, giving the market hope for a continuation of the trend. This price point is not an ordinary support level, but a convergence of multiple key signals.
According to the MVRV model, since the market started in April this year, Bitcoin has consistently operated within a channel formed by the orange and yellow lines. This 'track' constitutes the main melody of the market in the short term, with the current lower boundary price of the channel being around $112,000. If this position can be effectively maintained, it means a higher probability of trend continuation, allowing the market to raise the rebound target to around the upper boundary of the channel at $124,000.
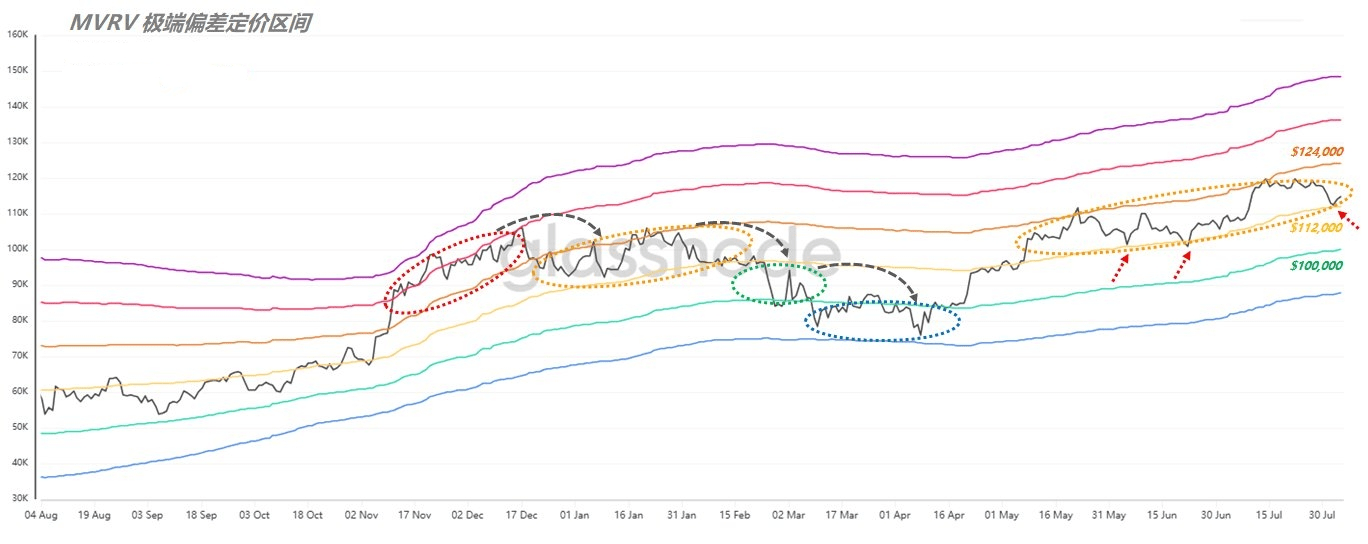
(Figure 1)
Unlike the previous round where the market gradually weakened from its high, this round appears structurally more stable, without breaking down or showing obvious trend fractures. Notably, the price of Bitcoin has received support near the yellow line for the third time, which not only revalidates the 'support line' but also indicates that the center of gravity for chip distribution is stabilizing and moving downward.
On-chain data further enhances this judgment. The latest URPD data shows that over 351,000 BTC have changed hands in the range of $112,000 to $114,000, an increase of 80,000 since August 3. Some of this is the release of chips that were previously stuck at high positions, but the area around $117,000 to $118,000 still accumulates about 1.1 million BTC, which is the most concentrated chip wall in the current market and the 'must-pass' route for the next wave of market breakthroughs.
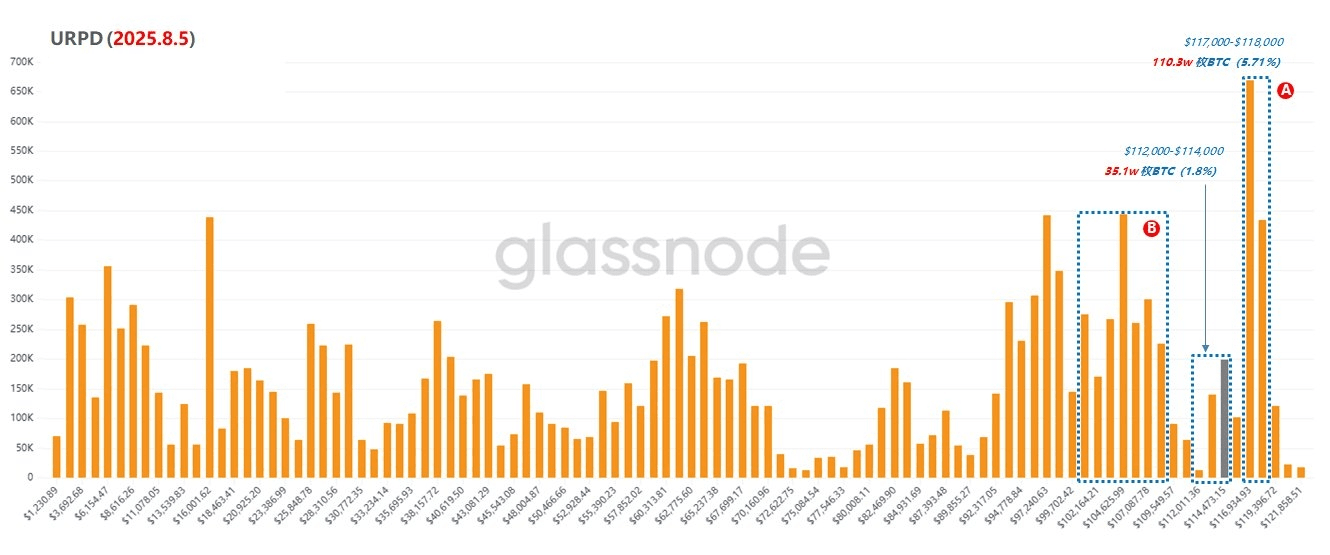
(Figure 2)
Without breaking through this pressure zone, Bitcoin is very likely to continue oscillating between $112,000 and $117,000. This is not a bad thing; on the contrary, this range-bound oscillation helps to clean up floating chips, stabilize market confidence, and accumulate more 'fuel' for the upcoming breakout.