Bitcoin rebounds near $112,000 in a key breakout area
Bitcoin's price action has recently found support at the $112,000 level, which was a strong resistance level before breaking through at the end of July. This area is reinforced by a long-term trend line traceable back to March and has now become an important technical support level. After reaching a local peak just below $121,000, Bitcoin retraced to this breakout point and successfully rebounded, indicating that buyers remain active at this level.
How does momentum affect Bitcoin's short-term outlook?
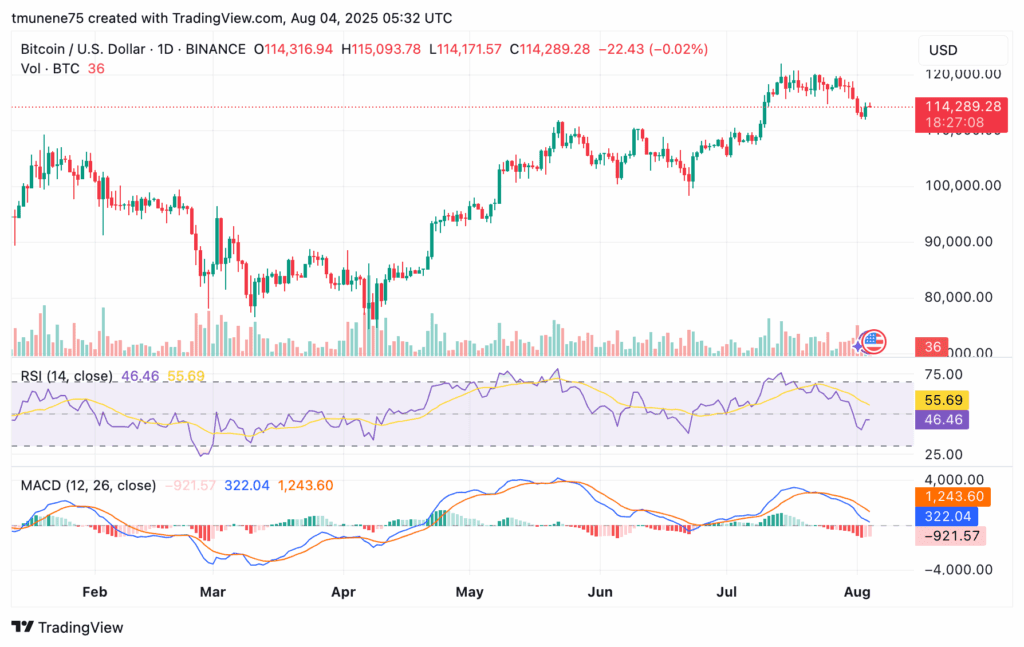
Momentum indicators are crucial for assessing Bitcoin's recent strength and weakness. The Relative Strength Index (RSI) has fallen to 46.46, dipping below the neutral 50 level, indicating that bullish momentum is weakening. Meanwhile, the MACD indicator has shown a bearish crossover, with the MACD line dropping below the signal line, and the histogram value at -921.57. These signals collectively suggest that Bitcoin's recent upward trend may be fading, necessitating cautious trading strategies.
What do price action and trading volume reveal about market sentiment?
Trading volume remains sluggish, with only 36 Bitcoins changing hands on the previous trading day, reflecting a cautious market stance. Low trading volume combined with indecisive price movements indicates trader uncertainty. The key resistance level around $116,000 and the support level at $112,000 may determine Bitcoin's next move. Staying above $112,000 will support a broader bullish trend, while failing to hold this level could lead to lower support around $105,000.
The recent decline in Bitcoin occurred after a period of consolidation between $118,500 and $121,500. The rebound at $112,000 coincides with the horizontal resistance level turning into a support level, confirming the importance of this level in the current market structure.
What is the significance of the $112,000 support level and the $116,000 resistance level?
The $112,000 support level is reinforced by historical price trends and long-term trend lines, making it a key area for stabilizing Bitcoin prices. At the same time, the $116,000 resistance level represents the next obstacle that bulls need to overcome. A decisive break above $116,000 could signal new upward momentum, while failure to break this level may lead to further consolidation or downward pressure.

How do technical indicators affect market expectations?
Technical indicators like RSI and MACD suggest that Bitcoin's momentum is entering a cooling phase. An RSI below 50 and a bearish MACD crossover indicate that bullish pressure is diminishing. Market participants should closely monitor these indicators as they often signal changes in trend direction.
Comparison of Bitcoin Price and Trading Volume
Metric Current Value Recent Comparison Price $114,299.28 Daily Change -0.02% Relative Strength Index 46.46 Below Neutral 50 MACD Histogram -921.57 Bearish Crossover Trading Volume 36 Bitcoins Below Average
Frequently Asked Questions
What caused Bitcoin to recently pull back to $112,000?
Bitcoin's pullback to $112,000 is primarily due to profit-taking after reaching around $121,000, and the weakening of momentum indicators like RSI and MACD indicates a reduction in bullish strength.
How does the $112,000 support level affect Bitcoin's price?
The $112,000 support level is a critical technical level, reinforced by historical resistance levels and long-term trend lines, providing a strong foundation that can prevent further declines if maintained.
Key Points
Bitcoin rebounds at the $112,000 support level: This level is reinforced by the March trend line and previous resistance levels.
Momentum indicators issue cautious signals: RSI below 50 and bearish MACD crossover indicate that bullish momentum is weakening.
Volume and price action show indecision: Low trading volume and narrow price range indicate market uncertainty.
Conclusion
Bitcoin rebounded at the $112,000 support level, highlighting a key technical area, but the weakening of momentum indicators such as RSI and MACD suggests a cautious short-term outlook. As Bitcoin enters this critical phase, traders should closely monitor the resistance level at $116,000 and the support level at $112,000. COINOTAG will continue to provide timely updates on market dynamics.
Keep an eye on CFX ENA ETH SOL XRP