COIN NAME : $SOL
SIGNAL TYPE : LONG
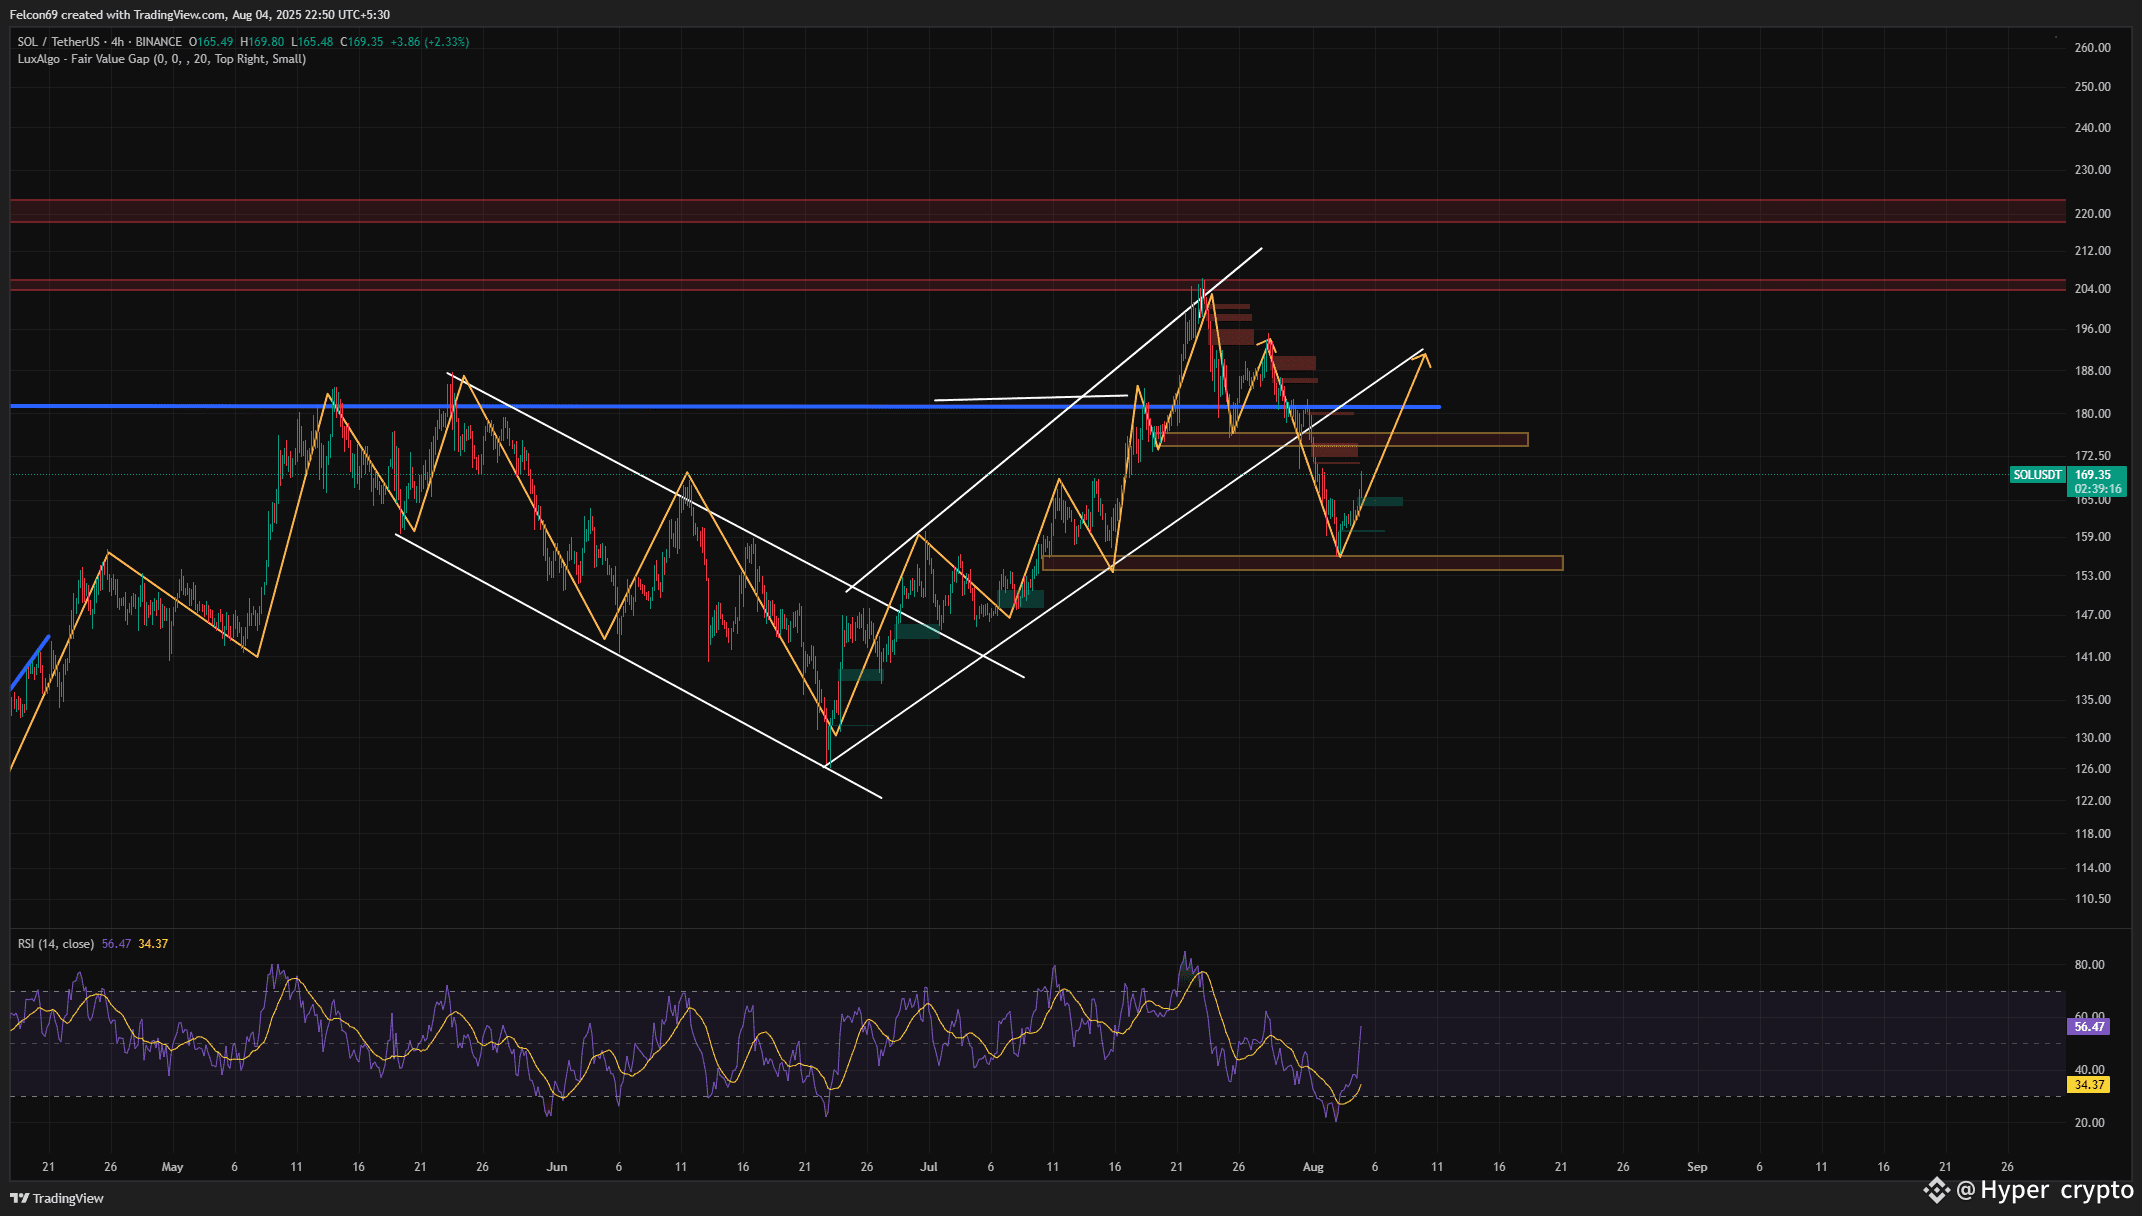
This chart 📊 shows SOL on the 4-hour timeframe. After forming a falling wedge pattern 🔻, SOL broke out bullishly 📈 and began a strong uptrend, moving within a rising channel. Recently, it faced resistance near the $200 zone 🚫 and pulled back to a key support zone 🟠, where a bounce has started. The current price action shows a possible bullish reversal 🔄, heading toward the previous resistance around $185–$190. The RSI 📈 has also rebounded from near oversold levels (now at 56), indicating renewed buying momentum. Multiple demand zones 🟧 are marked below, offering strong support if price retraces again. The red zones above represent resistance areas 🔴 to watch closely for potential take-profit targets or rejections. This setup suggests possible short-term upside 📈, but as always, DYOR 🔍 and manage your risk carefully in this volatile crypto market ⚠️.
(JOIN OUR BINANCE LIVE SECTION FOR MORE DEATAILS AND UPDATE INFORMATION)
ENTRY PRICE: 168.52 (or market price)
1st tp: 172.81
2nd tp: 186.91
3rd tp: 191.86
Leverage: 20x
(JOIN OUR BINANCE LIVE SECTION FOR MORE DEATAILS AND UPDATE INFORMATION)

