As Bitcoin's price falls below $117,000, discussions in the market about 'filling the gap' are gradually increasing. In the URPD chip distribution chart, the chip column at $117,000 is significantly higher than in other price ranges, accumulating 720,000 Bitcoins. This indicates that this price level was once the core battleground for bulls and bears, and the dense chips formed by a large amount of turnover make it an important support point. Now that the price has fallen below this level, the short-term market pattern has indeed changed.
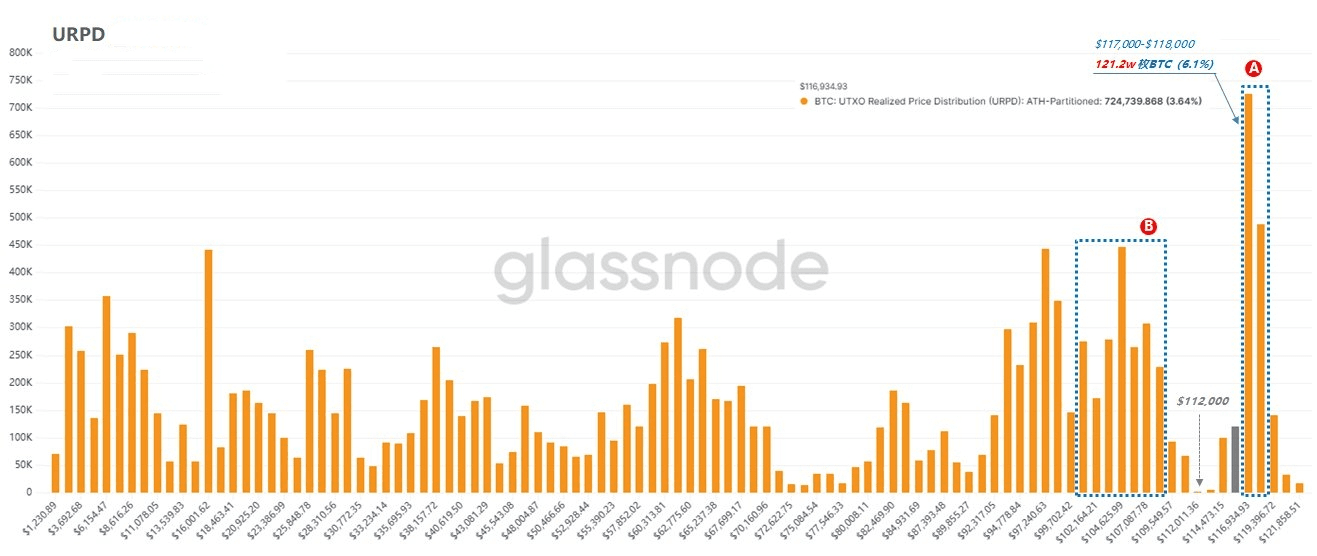
(Figure 1)
The choice of market direction is often related to the critical point of chip accumulation. When the chip accumulation in a certain price range reaches its peak, the short-term trend is likely to reverse. After the current price breaks downward, it has entered the middle zone of the 'double anchor structure' formed by sections A and B.
Based on past market patterns, if the holders of chips in sections A and B remain stable, the bottom of the correction is likely to establish itself in the middle area of the 'double anchor structure.' This area is roughly located between $112,000 and $113,000, which belongs to the fault zone in the chip structure, i.e., where the 'turnover gap' is located.
From the perspective of short-term trends, the key is whether the price can return to $117,000: if it cannot quickly rebound and hold $117,000 as support, the probability of 'filling the gap' will significantly increase; if it can quickly recover that level and stabilize, after a period of oscillation and contention, the probability of a breakout will be higher.
Jumping out of short-term fluctuations, the overall trend can be assessed by using the extreme deviation pricing range of MVRV. Historical observations show that in March-April and November-December 2024, Bitcoin's price dropped from the purple line to the red line, indicating that the price trend is weaker than the trend, suggesting that the previous strong trend is beginning to weaken.
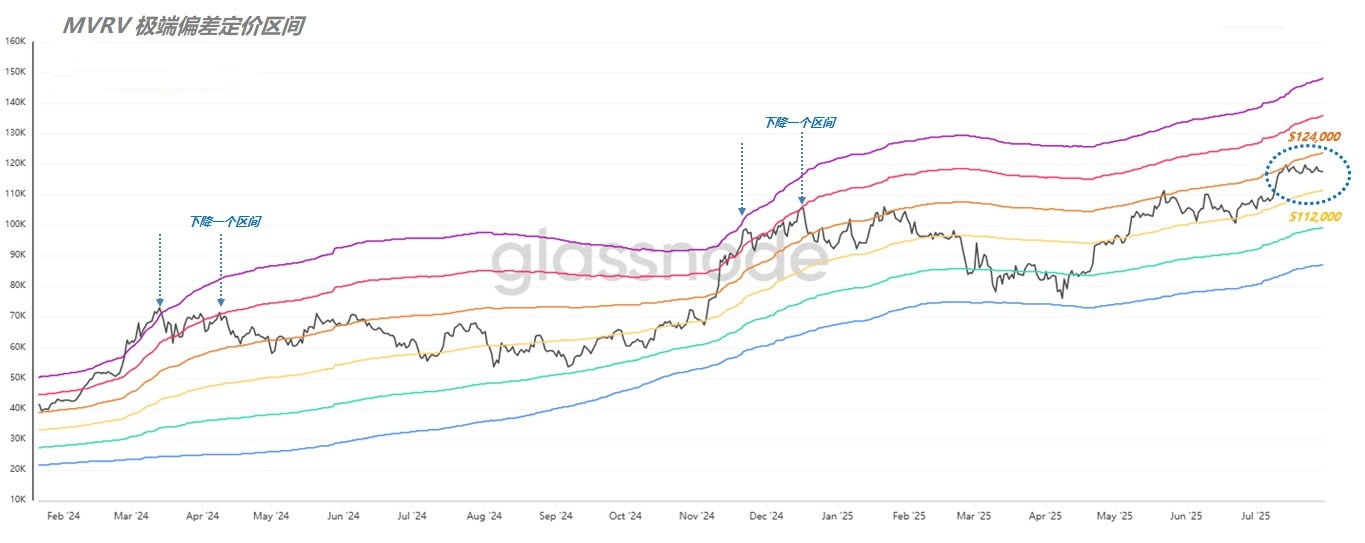
(Figure 2)
According to this logic, if the current Bitcoin price fluctuates between the orange line ($124,000) and the yellow line ($112,000), it can be seen as a continuation of the trend since April 2024. Once the price falls below the yellow line and the rebound fails to exceed the yellow line, it indicates that the trend may weaken (note that the yellow line is slowly rising, and the corresponding price will change dynamically).
Overall, even if one holds a cautious attitude towards the market, there is no need to rush to consider 'escaping the peak' at this stage. Because even if the trend shows signs of weakening, the market usually provides opportunities to make exit choices around $112,000.