After more than seven or eight years of navigating the digital currency industry, I was mired in debt for the first three years, totaling eight million yuan. But the turning point came in the last three years. Through unremitting efforts and a keen eye, I achieved a remarkable transformation from financial hardship to financial freedom. As a veteran in the cryptocurrency world, I've personally experienced countless market fluctuations, each of which presented surprising pitfalls and challenges, testing my wisdom and courage.
Throughout this journey, I've lost my way and tasted the bitterness of failure. I've also been overjoyed by occasional victories, only to sink into deep despair in the blink of an eye. My emotions surged like surging waves, a mixture of emotions difficult to describe. But time flies, and all storms will eventually pass. Today, I can face the ups and downs of the cryptocurrency world with a calm and composed mindset, continuing to move forward steadfastly on this path full of unknowns and possibilities.
Learn this dumbest way to trade cryptocurrencies and you’ll slowly become rich. First, firmly grasp the following 19 rules:
1. Avoid highs and go for lows, don't chase rising prices. Stay calm about price fluctuations, let them rise and fall freely, and don't be easily tempted.
2. There's no absolute coin, only timing matters. Choosing the right time to buy a good coin is a good choice; otherwise, even the most popular coin is just a passing fad. Patiently waiting for the perfect opportunity and investing in promising coins is the right path.
3. Mindset is king, and restraint is paramount. Itching to buy even when you know it's not the right time to buy is a major taboo in cryptocurrency trading. Only with a stable mindset can you navigate the market.
4. Analyze calmly and disregard emotions. Do not favor one currency over another, acting solely based on market signals. Those with strong technical skills and ample funds should be more flexible, regardless of the timing.
5. Self-reflection comes first; the market is not responsible. Mistakes are all your own fault. Learn from them quickly and avoid repeating them.
6. Both technique and mindset are essential. Blindly following trends is foolish; only wisdom and insight reveal the truth.
7. Capital size isn't crucial; strategic execution determines success. Buy and sell with precision, and you'll be the "wolf" of the market.
8. Operate calmly, with funds in hand, why worry about not having good money?
9. The market will not tolerate your luck. Only by radical change can you defeat the market.
10. The desire for quick success and instant benefits is the enemy of cryptocurrency speculation. Only by controlling your inner demons can you achieve long-term success. Investors often become playthings of the market because of an unbalanced mentality, becoming puppets of bulls and bears.
11. Good habits are the foundation of survival in the cryptocurrency world. Temporary gains may be a fluke, but long-term survival depends on good habits. Opportunities are common, but your ability to seize them determines success or failure.
12. Cryptocurrency trading is not gambling; sustained profitability demonstrates true skill. An effective strategy, carefully planned and executed, is the best approach.
13. Patience in nurturing your coins will lead to greatness. Frequent currency swaps will hinder your success. Focus on one area and cultivate it carefully, only then can you accumulate small victories into big ones.
14. Follow the market and dance with it. Master the rhythm and you will be at your best. Abandon greed and fear, listen to the voice of the market, and no one can stop you.
15. Cryptocurrency trading is like spiritual practice; one must clearly distinguish between natural law and human desire. Buying and selling points are determined by the combined force of the market; only by following these rules can one proceed with caution.
16. The magic of compound interest cannot be ignored. When a good mindset is combined with skills, compound interest will naturally follow, and your wealth will snowball.
17. The market is ruthless, both ups and downs are brutal. Based on technical skills, you should act when it is time to act. Missing the selling point is also a mistake.
18. Buy low and sell high; cost is king. Don't predict, just react. Build positions at a large scale and adjust positions at small scales. Lowering costs is the key to success.
19. Be cautious in good times; the market is risky. Until you convert your money into cash, it's all floating around. Chasing rising and falling prices is tantamount to digging your own grave.
In this article, we will talk about a set of practical "MACD indicator tactics", which will help you accurately predict the market in the day.
Seize opportunities and steadily improve your winning rate.
First, understand MACD systematically.
MACD is also called the exponential moving average convergence divergence. As the name suggests, the subject of the MACD indicator is still the moving average.
In fact, MACD is an indicator derived from the double moving average. When many people learn technical indicators, they learn how to use them directly based on the state of the indicator, how to use this indicator to judge long and short positions, and what are bullish signals and bearish signals.
Technical indicators all have fixed formulas. When you input variables, you get the results after the fixed formula calculations, and they are displayed intuitively through charts.
When technical indicators set fixed parameters, a certain price trend will be calculated through a fixed formula to form the corresponding indicator value and status, so there is a deterministic connection between technical indicators and prices.
Indicator formula
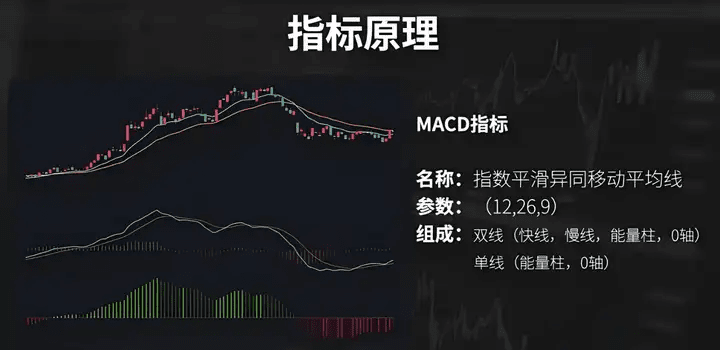
The MACD indicator will be presented in different software platforms in more or less different forms. The most common ones are single-line MACD and double-line MACD.
Generally speaking, the MACD indicator has three default parameters: 12, 26, and 9.
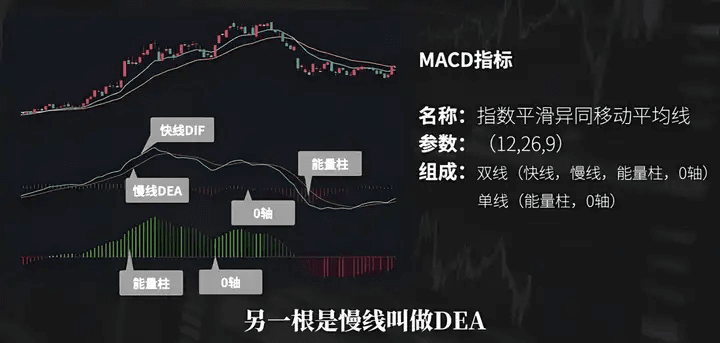
The dual-line MACD indicator consists of two lines, the O-axis and the energy column.
One of the two lines is a fast line, called DIF, and the other is a slow line, called DEA.
The single-line MACD indicator generally has an energy column and an O axis.
The indicator has three default parameters: 12, 26, and 9.
MACD is essentially an indicator generated by double moving averages.
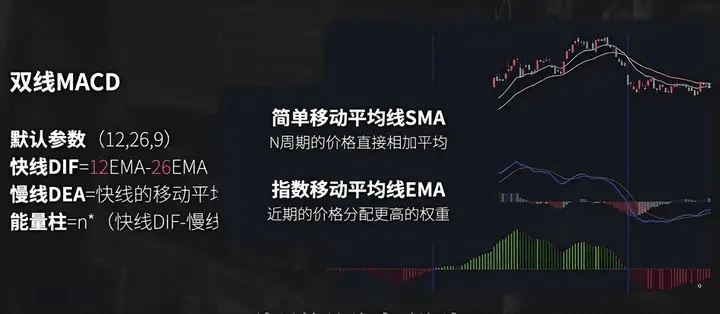
12 represents the EMA moving average with a period of 12, and 26 represents the EMA moving average with a period of 26.
EMA moving average refers to the exponential moving average, simple moving average, also called SMA, which calculates the moving average value obtained by directly adding and averaging the most recent number of K lines.
EMA stands for Exponential Moving Average. EMA is a weighted arithmetic average of prices.
Its calculation principle is that the closer the price is to the current time, the greater the weight is assigned to it. The closer the price is to the current time, the greater the weight of its impact on the moving average. EMA is calculated based on this.
Compared with the SMA moving average, the EMA moving average is more sensitive to price fluctuations and changes more quickly when prices fluctuate.
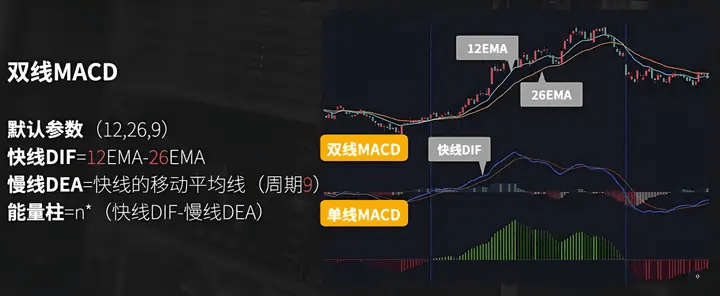
If we add the 12EMA and 26EMA moving averages to the chart, we can see that the two moving averages follow the price changes, intersecting and separating as the price fluctuates.
There is a fast line in MACD called DIF. The value of this line is obtained by 12EMA-26EMA, which represents the difference between the two moving averages (subtracting the moving averages).
The greater the difference between the two moving averages, the larger the value of the fast line. When the two moving averages intersect, the fast line is at the 0 axis.
When the 12EMA crosses the 26EMA to form a golden cross, the fast line will cross from below the 0 axis to above the 0 axis.
If you adjust the parameters, such as changing 12 and 26 to 20 and 40, the MACD fast line will become the difference between the two moving averages of 20EMA and 40EMA.
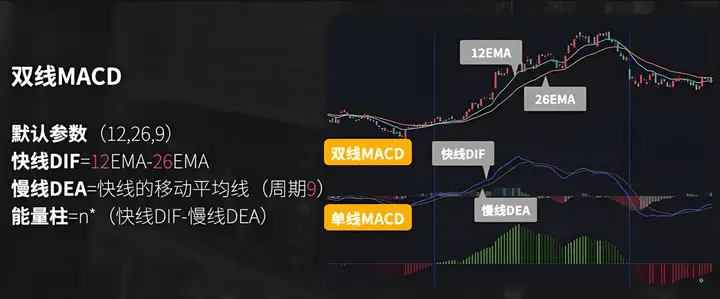
MACD also has a parameter 9, which is the parameter of the slow line DEA. We just calculated the difference between the two EMA moving averages and obtained the fast line DIF.
This fast line has a corresponding value in each unit time. Based on this fast line, we calculate the EMA moving average with a period of 9 and get the exponential moving average of this fast line.
So the slow line DEA is actually the exponential moving average of the fast line.
The slow line must follow the fast line and lag behind the fast line.
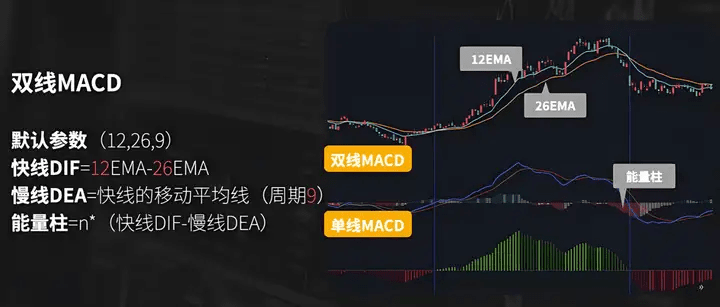
Energy column, as the price rises and falls, the fast line and the slow line will intersect and separate, and the fast line and the slow line will also have a difference value, and this difference value can be expressed by the energy column.
The length of the energy column is determined by the size of the difference between the fast line and the slow line.
When the fast line is above the slow line, the energy column is above the 0 axis. When the fast line is below the slow line, the energy column is below the 0 axis. When the fast line and the slow line intersect, the difference value is 0, and the energy column is at the 0 axis.
The greater the difference between the fast line and the slow line, the longer the energy column will be.
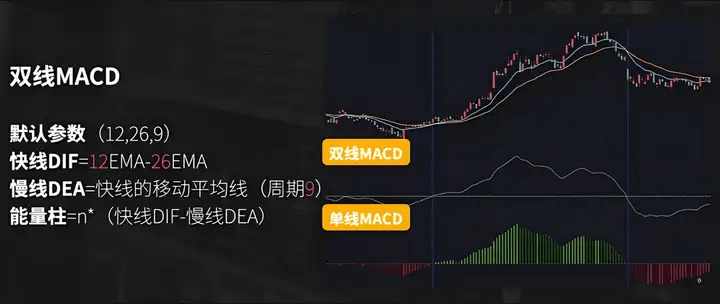
Some software uses a single-line MACD. By changing the MACD parameters 12, 26, 9 to 12, 26, 1, you can get a single-line MACD.
The energy column of the single-line MACD actually represents the value of DIF (fast line), which is the difference between the two moving averages of 12EMA and 26EMA.
The energy column of the double-line MACD represents the gap between the fast line and the slow line.
The energy column of the single-line MACD represents the gap between the two moving averages in the parameters.
usage
How to use MACD
First, the position of the fast line and the status of the fast line and slow line are usually used to judge the price trend.
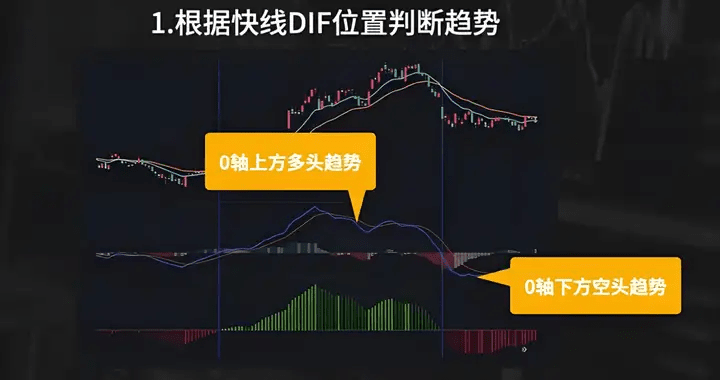
The fast line crosses the 0 axis and is above the 0 axis, indicating that the market is bullish and the market is in a bullish trend.
The fast line crosses below the 0 axis and is below the 0 axis, indicating that the market is strong in short positions and is in a bearish trend.
Second, use the intersection of MACD fast line and slow line as a signal for long and short.
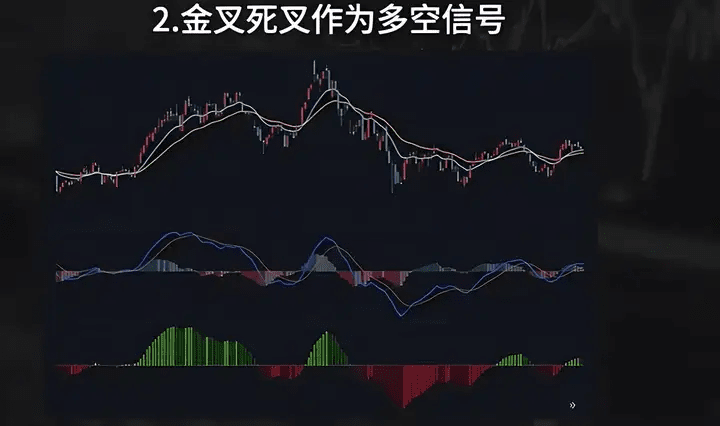
The fast line crosses the slow line to form a golden cross as a bullish signal.
The fast line crosses below the slow line to form a death cross, which is a short signal.
Third, combine the position of the express line and the cross signal.
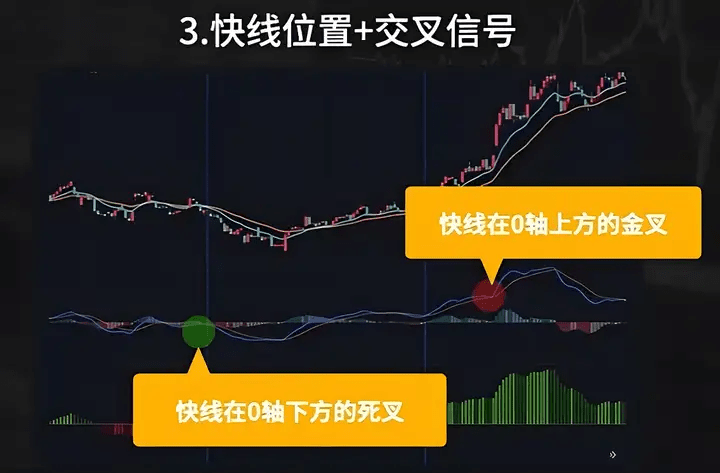
When the fast line is above the 0 axis, it indicates that the market is in a bullish trend. A golden cross signal of the fast line crossing the slow line appears above the 0 axis, which is a bullish signal.
Correspondingly, the fast line is below the 0 axis, indicating that the market is in a bearish trend. Below the 0 axis, a death cross signal appears where the fast line crosses the slow line, which serves as a bearish signal.
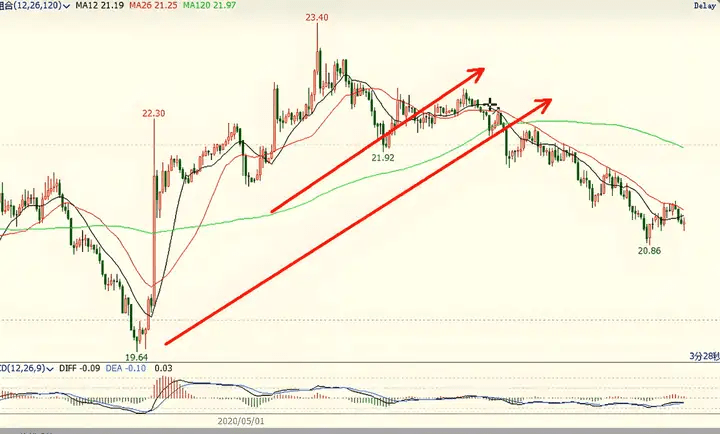
The fourth type is the divergence of indicators. Divergence refers to the continuous rise in prices and continuous new highs, but the peak value of the MACD indicator fast line is decreasing.
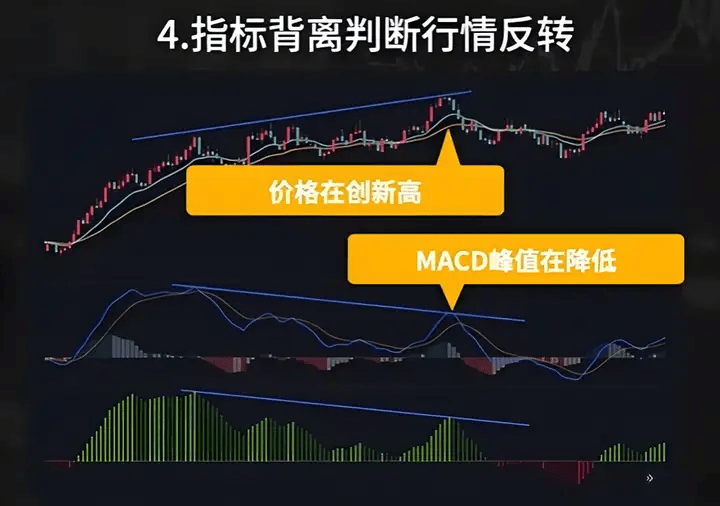
This creates a divergence between the indicator and the price, which is often used as a signal to judge that the market may reverse.
The core of the MACD indicator lies in its fast line DIF, and the value of the fast line is equal to the difference between the two moving averages.
To understand MACD, we must start with the difference between the two moving averages and understand the relationship between price trends and changes in the difference between the two moving averages.
The first is the sign of the difference.
We know that the moving average of a small cycle is more affected by the current price trend and is closer to the price, while the moving average of a large cycle will lag relatively.
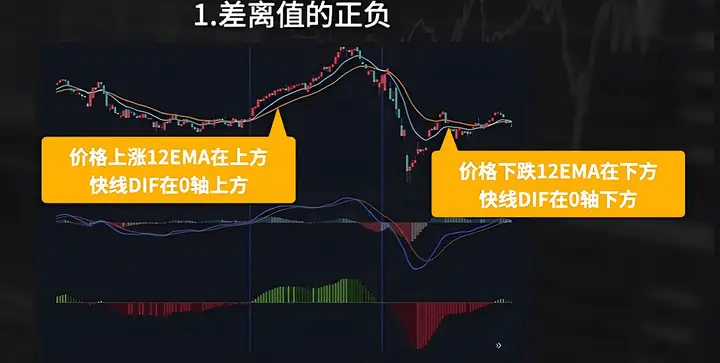
Therefore, when the price continues to rise, the small-cycle moving average will be above the large-cycle moving average, the value of 12EMA is greater than 26EMA, the corresponding difference between the two moving averages is positive, and the value of the fast line is greater than 0, which is above the 0 axis.
One of the usages just now is to use the position of the fast line and the O axis to judge whether the market trend is bullish or bearish. The value of the fast line DIF is actually the difference between the 12EMA and the 26EMA.
When the 12EMA is above the 26EMA, this fast line will be above the 0 axis. The 12EMA will cross the 26EMA to form a golden cross, and the fast line will cross from below the O axis to above the 0 axis.
When we want to judge the market trend, we observe the relative positions of the two moving averages, 12EMA and 26EMA. This is essentially the same as observing the relative positions of the MACD fast line and the 0 axis. It just depends on which method is more intuitive.
Second, understand the changes in the difference value. Under what circumstances will the difference value of the two moving averages become larger, and under what circumstances will the difference value of the two moving averages become smaller?
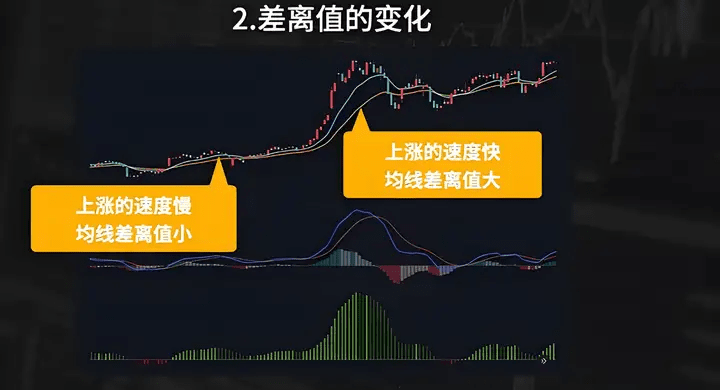
Taking the rise as an example, what are the factors that affect the size of the difference between the two moving averages?
is the rate at which prices rise.
The faster the price rises, the greater the price change per unit time. The shorter-term moving average is more affected by the current price and reacts faster, while the longer-term moving average lags behind, causing the difference between the two moving averages to increase.
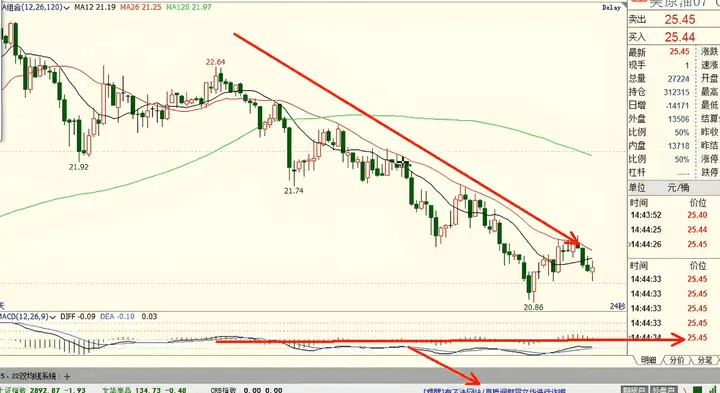
Similarly, when the price rise slows down, or turns from rising to falling, the difference between the two moving averages will decrease. The change in the price rise and fall speed affects the change in the difference between the two moving averages, which also affects the change in the MACD fast line value.
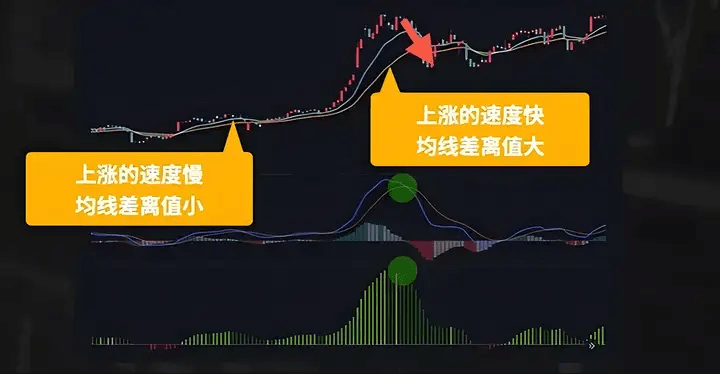
When the price accelerates and then decelerates, or turns from rising to falling, a divergence value will appear, that is, the MACD fast line value first increases and then decreases, which will form a MACD peak.
The fast line crosses the slow line and forms a death cross. Understanding this, we can know that the golden cross and death cross signals of MACD are affected by changes in the speed of price increases and decreases or the reversal of increases and decreases.
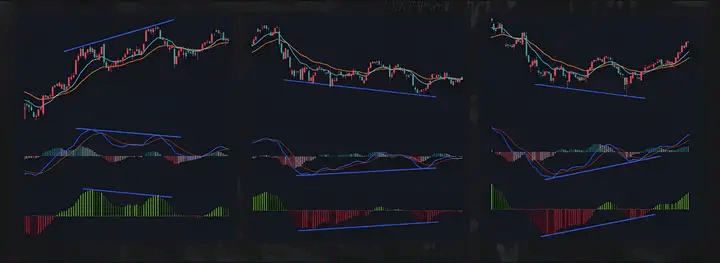
The third point is the divergence of MACD.
MACD divergence describes a situation where prices are constantly reaching new highs, but MACD peaks are decreasing. This relationship between price and indicator is called a divergence. Many people consider this divergence an important signal for a potential market reversal. To understand divergence, it's important to consider the underlying causes.
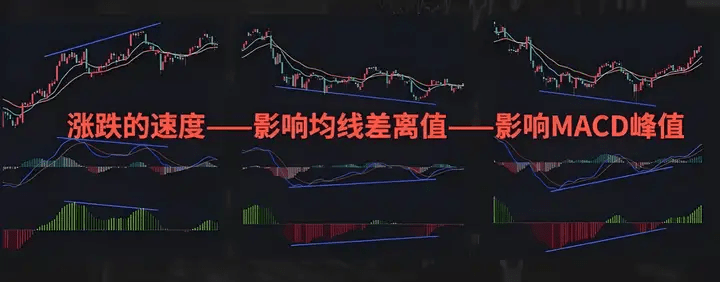
Changes in the fast line value, once it rises, slows down or reverses the rise, will cause the difference between the two moving averages to become smaller.
The MACD indicator shows that the fast line of the MACD indicator has formed a peak. What determines the value of the fast line?
The value of the fast line is equal to the difference between 12EMA and 26EMA. So what determines the size of the difference between the two moving averages?
It is the rate at which prices are rising, so what does the divergence describe?
That is, prices are rising to new highs, but the rate of increase is slowing down.
Due to the slowdown in the rising speed, the difference between the two moving averages decreases, and the corresponding MACD DIF value decreases, which is reflected in the MACD divergence on the chart.
Let’s think about two more questions:
First, the rate of increase has slowed down. Does this mean a market reversal?
It is possible, but not certain. After the upward trend slows down, the market may reverse and fall, it may go sideways, or it may continue to rise.
Divergence simply describes a state where the rate of increase is slowing down. If you see a car slowing down on the road, does that mean it's about to turn around?
It is not sufficient reason to conclude that the car is going to turn around based on the fact that its speed has slowed down.
The second question is, do we have to use MACD to observe divergence?
We understand that the essence of divergence is a slowdown in the rate of increase. So what determines the speed? The distance traveled divided by the time traveled. What we observe on the market is the magnitude and duration of the increase.
The rising time is similar, but the rising amplitude is decreasing, or the rising amplitude is similar, but the rising time is longer.
Such situations will cause divergence between the indicator and the price. After understanding the nature of indicator divergence, do we still need to observe divergence through the status of MACD? We can use it, or we can not.
An indicator is an intuitive, objective, but lagging tool. You can observe trends by the position of the MACD fast line, the relative position of the two moving averages, or by directly observing the price on the market.
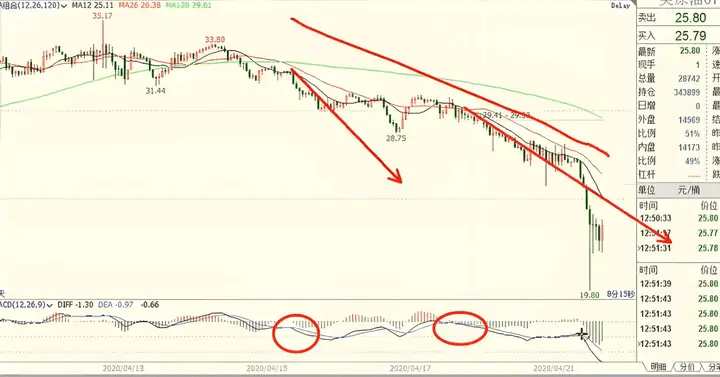
Back to candlestick chart
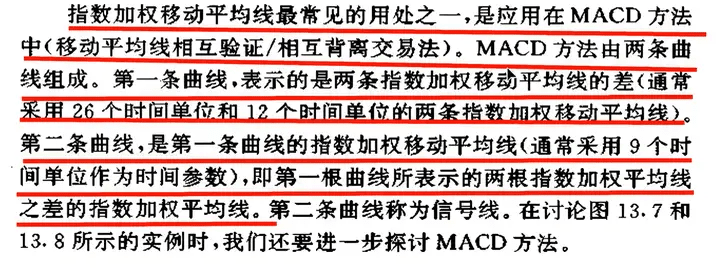
It consists of two curves:
The first curve shows the difference between two exponentially weighted moving averages of 12 and 26 time units;
The second curve is the result of taking an exponentially weighted moving average (usually 9 units) of the first curve.
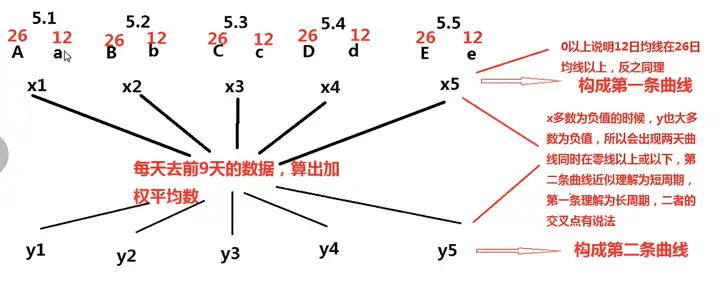
The first MACD line is formed by calculating the daily difference between the 12-day and 26-day moving averages, and connecting these differences to form a single line.
The second curve is a 9-day exponentially weighted average of each point of the first curve to form another smooth curve.
Therefore, the first curve reflects the difference between the short-term and long-term moving averages, which is the difference, while the second curve is the smoothing of this difference and then the weighted average.
When most of the values of the first curve of MACD are above zero, it indicates that the 12-day moving average is above the 26-day moving average, which means that the short-term trend is stronger than the long-term trend.
If the values of the first curve are mostly positive, then the values of the second curve will also tend to be positive, further confirming this trend.
On the contrary, when both curves are below the zero line, it means that the 12-day moving average is lower than the 26-day moving average, indicating that the short-term trend is weaker than the long-term trend, usually pointing to a downward trend.
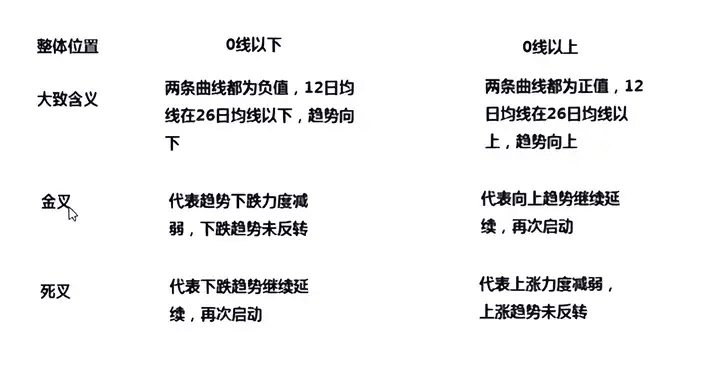
A golden cross below the zero line (i.e., the fast line crosses above the slow line) does not mean a trend reversal, but rather indicates a weakening of the downward momentum, which may foreshadow a rebound or sideways trading.
On the contrary, a death cross below the zero line (the fast line crosses below the slow line) indicates that the downtrend continues and starts again.
As for the death cross above the zero line, although the short-term upward momentum has weakened, the overall upward trend has not changed. This may be an opportunity to reduce long positions rather than a signal to short.
For a golden cross above the zero line, it usually means a small cycle rise in an upward trend, which can be used as a signal to go long with the trend.
First of all, we need to clarify the meaning of the zero axis.
When MACD is above the zero axis, it indicates that the overall trend is upward; whether a golden cross or a dead cross appears, it will not change this upward trend, and long positions are the main focus.
On the contrary, when MACD is below the zero axis, it indicates that the overall trend is downward. Similarly, neither golden cross nor dead cross will change the current downward trend.
In an environment above the zero line, traders should look for opportunities to go long because the trend is upward. A golden cross above the zero line - when the fast line crosses above the slow line - is considered a good time to go long.
In this case, the golden cross further confirms the upward trend and constitutes a "trend within a trend".
Therefore, only when MACD is above the zero axis does its golden cross make sense for going long.
A golden cross below the zero axis does not constitute a reason for a trend reversal. Instead, it may be a signal to reduce or close short positions, because going long in a downtrend is equivalent to bottom fishing, which is not recommended.
For a death cross above the zero axis, this is usually seen as a point to close a long position.
A death cross below the zero axis represents a position to enter a short position because it follows a large downward trend and combines it with a short-selling signal.
A golden cross below the zero axis can be used as a time to take profit or reduce short positions. Although this method is simple, it is one of the effective ways to track trends.
The cryptocurrency world is like a marathon; running fast is worse than running steadily. Money earned through luck is often ultimately lost through skill. Only by ingraining position management into your DNA can you survive this brutal market. Remember: only by staying active can you have a chance to turn things around.
Don’t get lost anymore. If you want a steady turnaround, a huge surge, or a comeback, just follow my strategy!
I set the pace, I choose the currency, I determine the direction, 2-5 strong signals every day, accurate prompts!
Don’t rely on feelings anymore to make trades. We rely on discipline and strategy to get results!


