There is a data point regarding Bitcoin that deserves close attention: the supply curve slope of long-term holders (LTH) is gradually flattening.
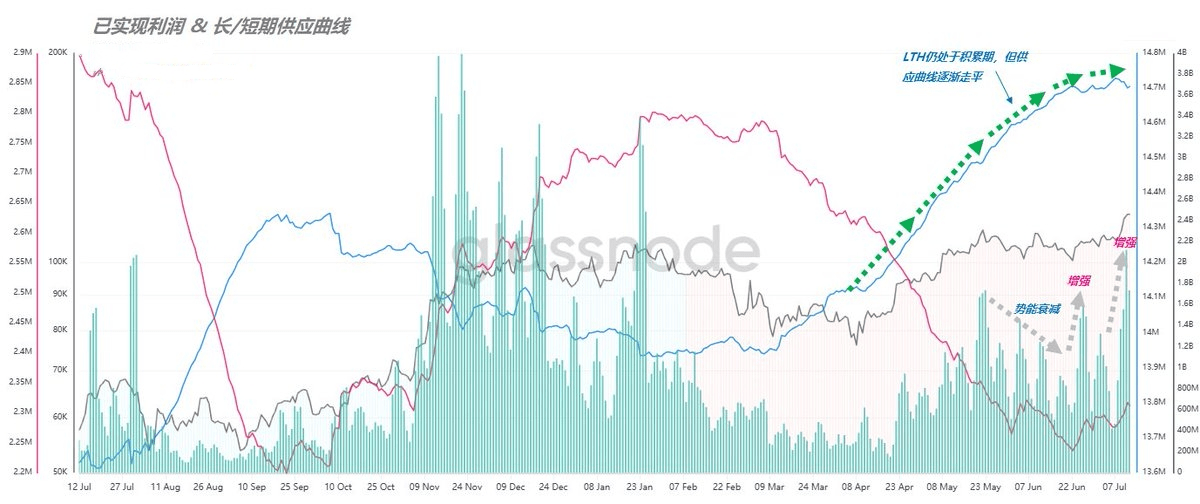
The change in the slope of this curve carries profound implications: a steep and rapidly rising slope indicates that long-term holders are actively accumulating, with an accelerated accumulation pace; while a flattening curve suggests a slowing accumulation rhythm, and there may even be hedging operations where accumulation and distribution occur simultaneously. If large profits are realized during this time, it indicates that some chips have already been offloaded.
The reason this signal is crucial is that long-term holders, as core participants in the market, directly reflect the deep emotional changes in the Bitcoin market through their behavior. A historical review shows that whenever long-term holders shift from an accumulation phase to a distribution phase, the market typically exhibits two typical trends: either demand struggles to absorb excess distribution, leading to a long-term downward trend (like in October 2021); or new demand continues to flow in, helping long-term holders complete their chip redistribution, pushing the market into a major upward wave (like in October 2023).
Currently, the market has not yet entered a clear distribution phase; it is merely the upward momentum of the curve that has weakened. Therefore, closely tracking the behavior of long-term holders and the changes in Bitcoin prices becomes particularly critical.