Under the suppression of the STH-MVRV indicator divergence, the market faces challenges at two key peaks. Among them, the realized breakthrough at $112,700 corresponds to an STH-MVRV value of 1.13, while the next target of $117,700 corresponds to 1.18. As of yesterday's close, STH-MVRV rose to 1.16, just a step away from the key threshold, and the breakout window is gradually opening.
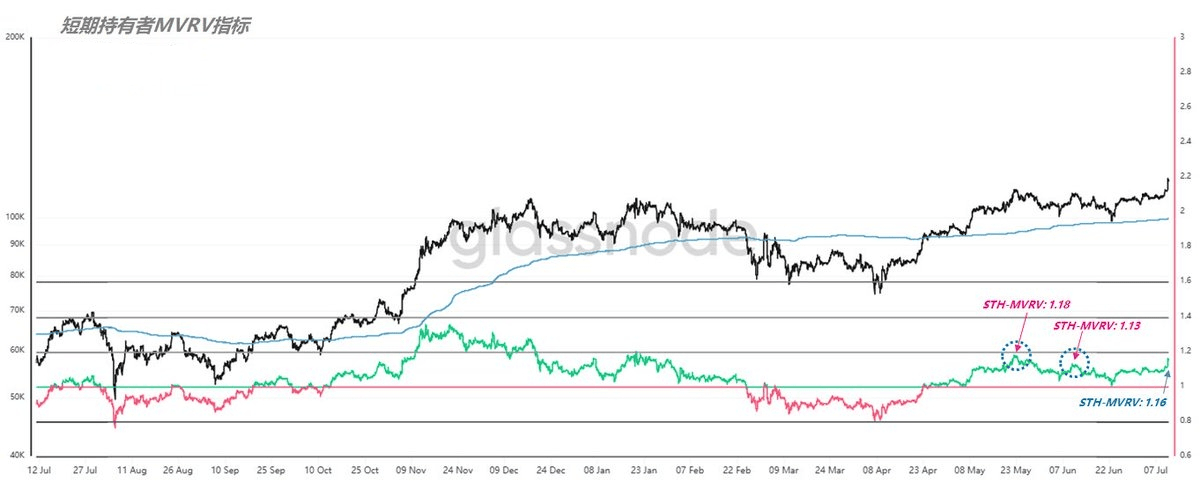
(Figure 1)
From the MVRV indicator, its value continues to rise, driving the extreme deviation pricing range to shift upwards simultaneously. This phenomenon reflects the growth rate of Market Value (MV) exceeding the Realized Value (RV) — the former is influenced by circulation and market sentiment, while the latter is closely related to the intensity of capital inflows and the frequency of chip exchanges, reflecting the uniqueness of the current market valuation expansion pace.
For subsequent trends, the market has two core expectations: if it is merely a range rebound after touching STH-RPC on June 22, the upward height may be limited to around $117,000 as indicated by the orange line; if a large-scale trend reversal occurs, it may aim for the red line at $129,000 or even the purple line at $140,000. Furthermore, $117,000 is not only the divergence point for the two trends but also a key area pointed to by multiple probability statistics and divergence calculations. Historically, the two peaks on January 21 and May 22 both encountered resistance here.
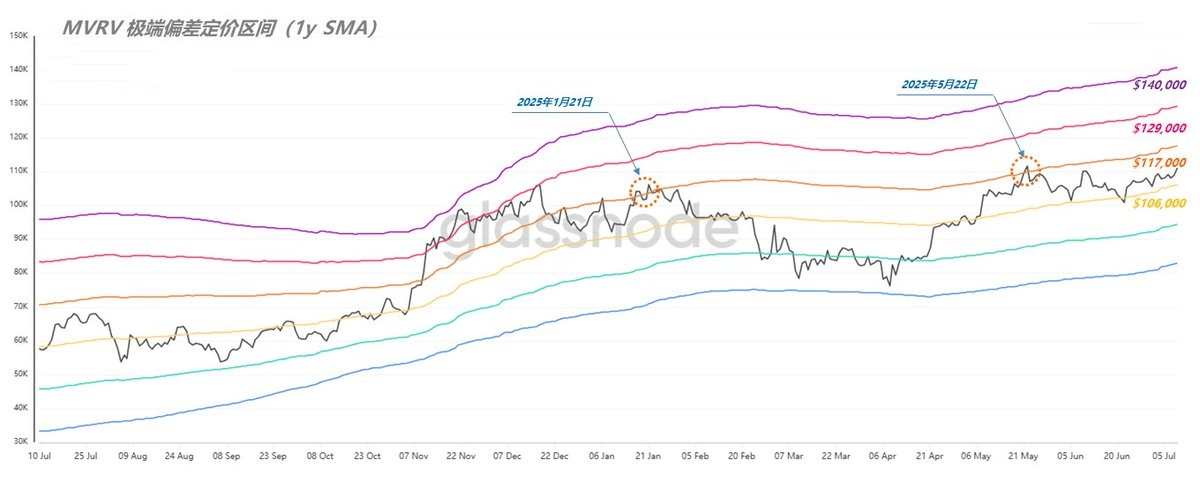
(Figure 2)
This also means that if Bitcoin can smoothly break through $117,000, the limitations of STH-MVRV divergence and extreme deviation rebound range will be broken, opening up upward space for higher prices. However, it is important to clarify that this does not encourage chasing prices. In the current environment of extreme liquidity contraction, price fluctuations are easily influenced by emotions, and rational judgment must be maintained.
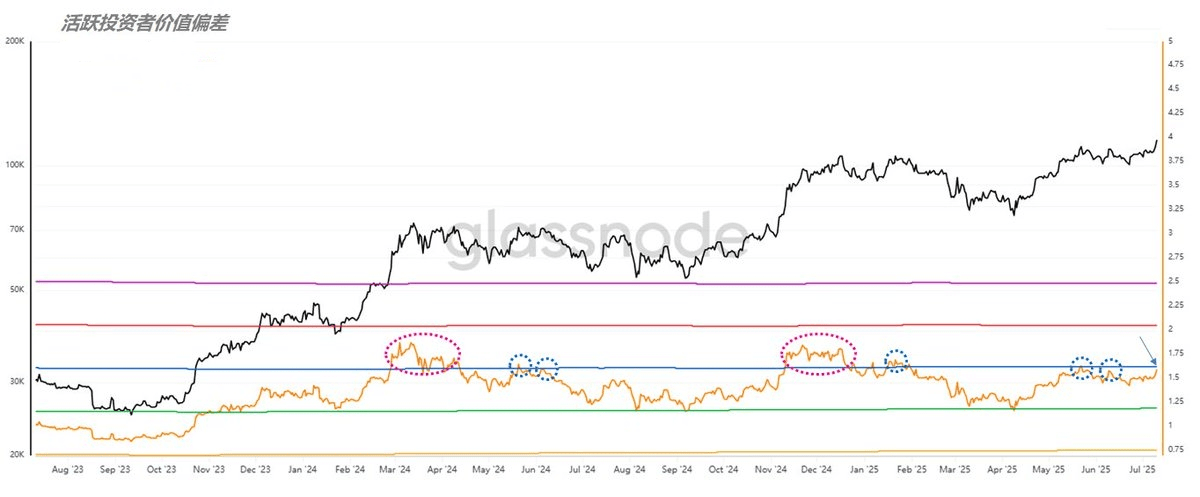
(Figure 3)
From the AVIV (Active Player Value Deviation) data, the current curve has approached +1 standard deviation (blue line). Statistics show that historically, the probability of AVIV values being below +1 standard deviation is 68.27%, with a breakout probability of approximately 31.73%. In this cycle, there were two breakouts of the blue line in March and November 2024, but there were also 5 other peaks that encountered resistance, indicating a higher probability of being blocked. However, low probability does not mean impossible; players need to incorporate a breakout scenario response strategy into their trading plans.#BTC再创新高