25/07/09 BTC is oscillating near the previous high, watching for a sharp rise or fall and the resulting polarization. How will it move next?
Bitcoin is continuously oscillating near the previous high, observing the polarization between those who see sharp rises and falls; such situations are actually very normal.
First, regarding the unreliable tariff issue, many friends are very panicked. In early February, due to the tariff issue, Bitcoin dropped from 110000 to a low of 74500, losing several tens of thousands of points. Therefore, the tariff issue has been hanging over our heads. There's also the interest rate cut issue, which has not yet received a clear answer, but the probability of a rate cut in September or October is relatively high. Moreover, every year in recent years, there has been a wave of market movement in September and October, so we will see if this year can continue.
But more importantly, everyone needs to know what the unreliable purpose of doing this is? It is hard to say whether it can exacerbate the volatility of the financial market, but the consortium behind it and its own craziness in making money in the capital market is real. The world is inherently a makeshift stage; complaining is useless, adapting is enough.
Also, regarding the performance of the three major US stock indices, they are quite strong, having broken through historical highs or reached just below historical highs. This indirectly reflects that tariffs have little impact on the stock market. As for Bitcoin, being a safe-haven product, it goes without saying. Now both Wall Street and many listed companies are accumulating Bitcoin; what should we small investors worry about?
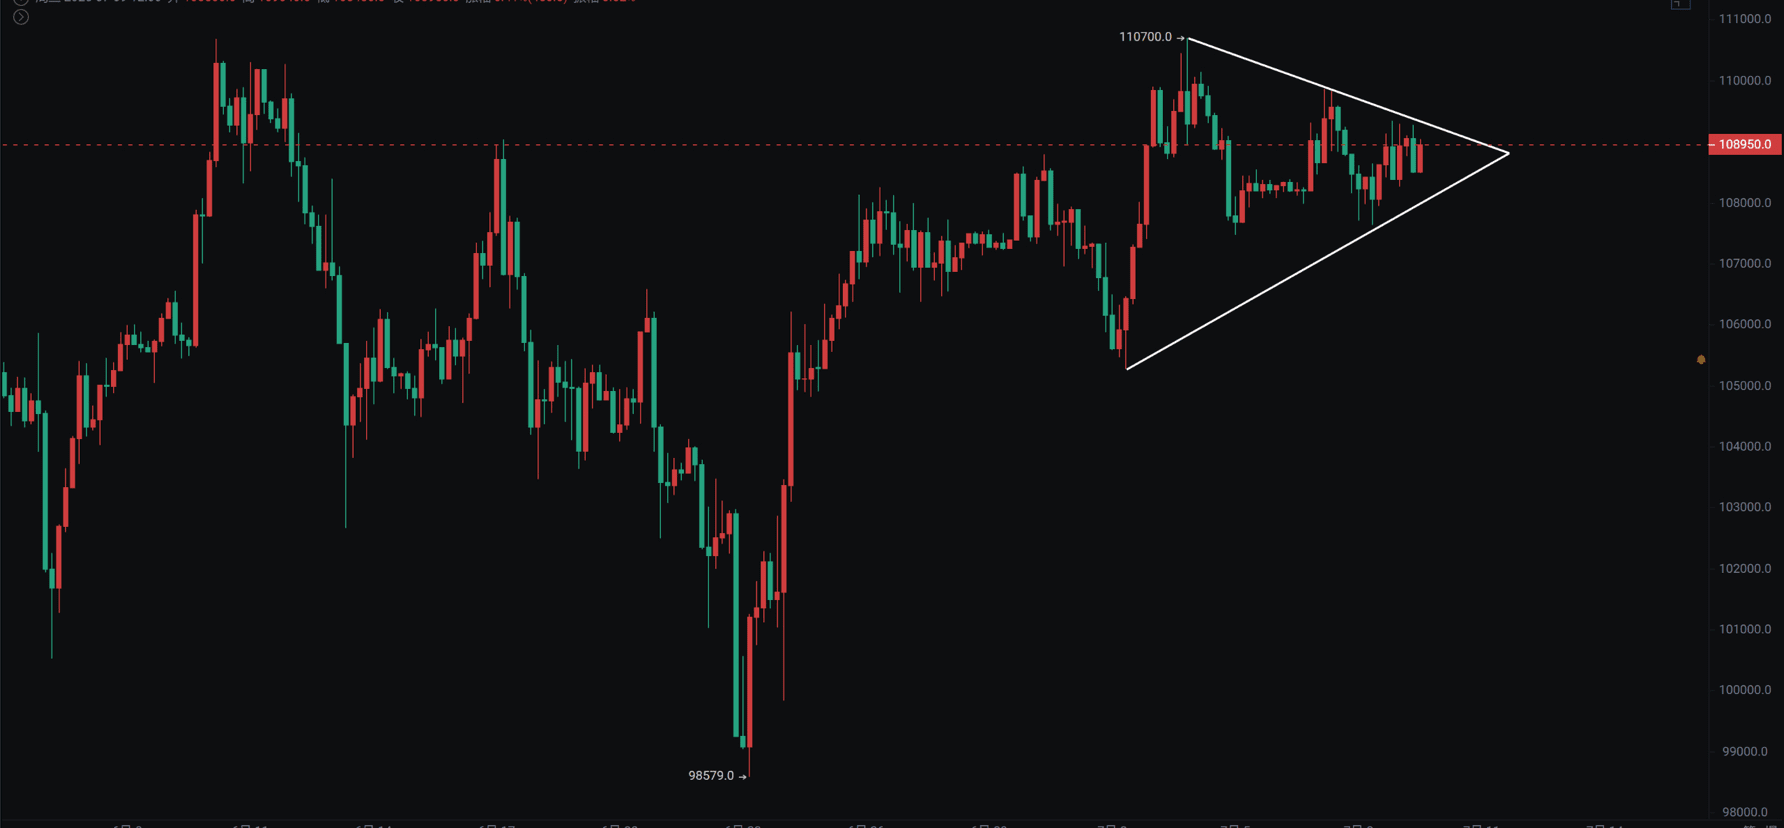
Bitcoin
The volatility of Bitcoin is getting smaller, fluctuating within 1000 points. This week, there is a high probability of closing a Doji star. If we look at the weekly closing line, it is already the highest weekly line in history. The daily lines are above the three moving averages, and the gentleman has always been a strong bull. This round, the gentleman predicts the high point will be between 180000 and 250000, but the timing cannot be guessed.
The daily chart shows slight top divergence. If there are long positions held from the bottom, it’s okay. If you haven't entered yet, you can wait for some pullbacks or a real breakthrough before entering. The current cost performance is not high...
If there’s a top divergence in the 4-hour chart, consider buying if it pulls back to 105000 to 106000.
Support: 15000 to 106000
Resistance: 110000 to 112000
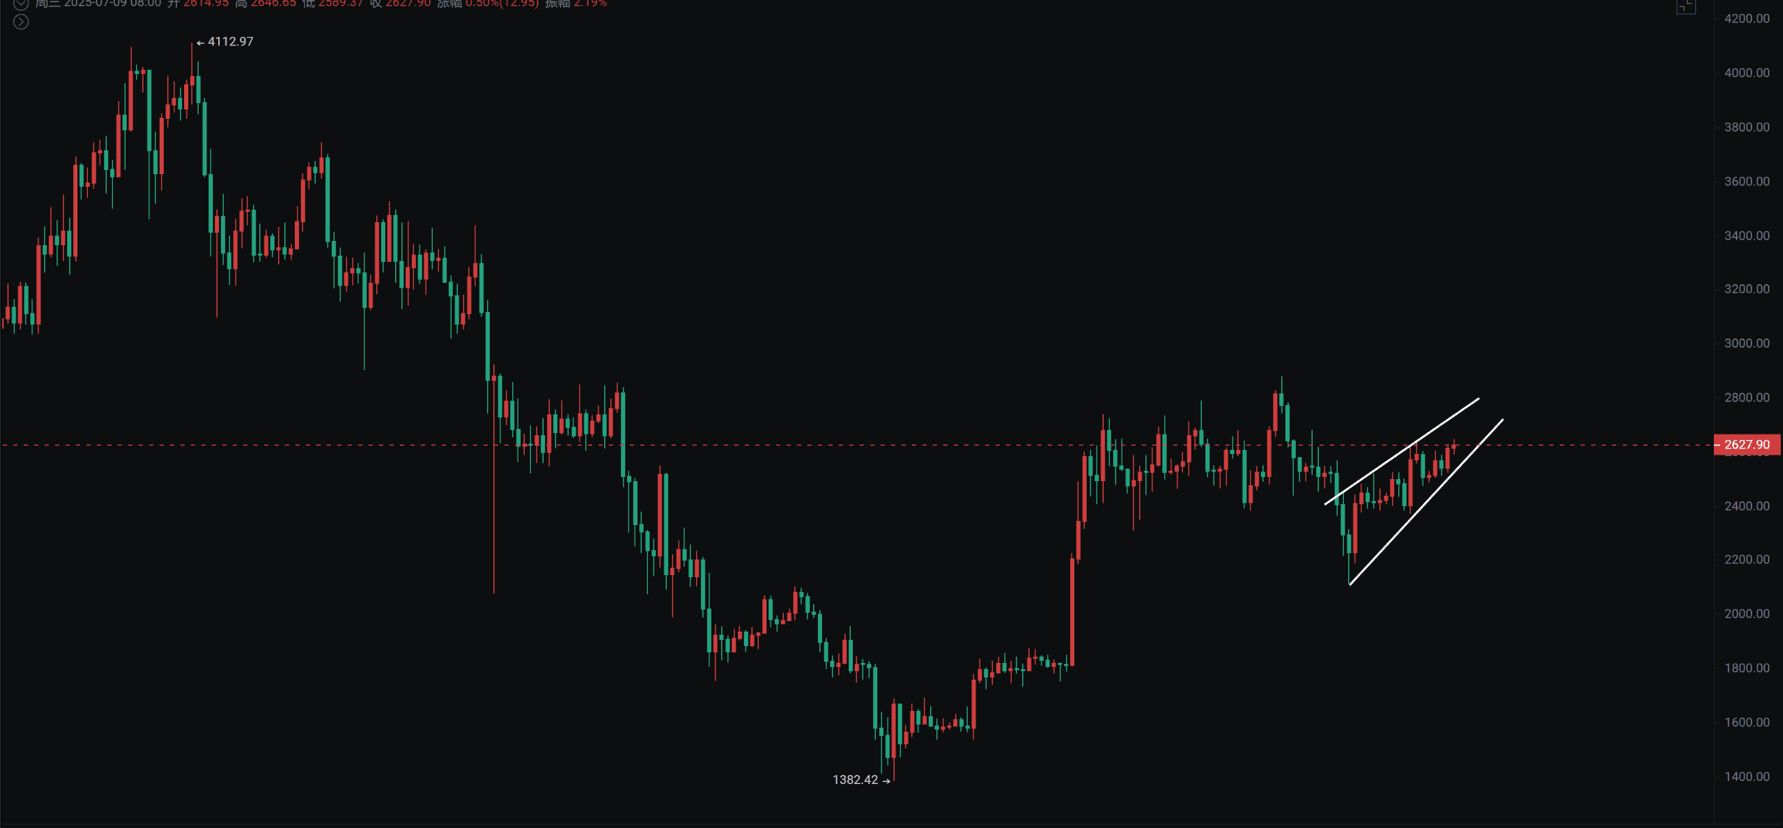
Ether
The rebound in the ETH/BTC exchange rate drives Ether to catch up. Yesterday I mentioned that being above the three moving averages on the daily chart is still bullish, and the RSI indicator has broken through significantly. If Ether recovers above 2300, the gentleman said it would go to the top of the range at 2700-2800. Currently, the daily chart shows a rising wedge; pay attention to the potential decline at the end of the wedge.
Support: 2300 to 2400
Resistance: 2700 to 2800