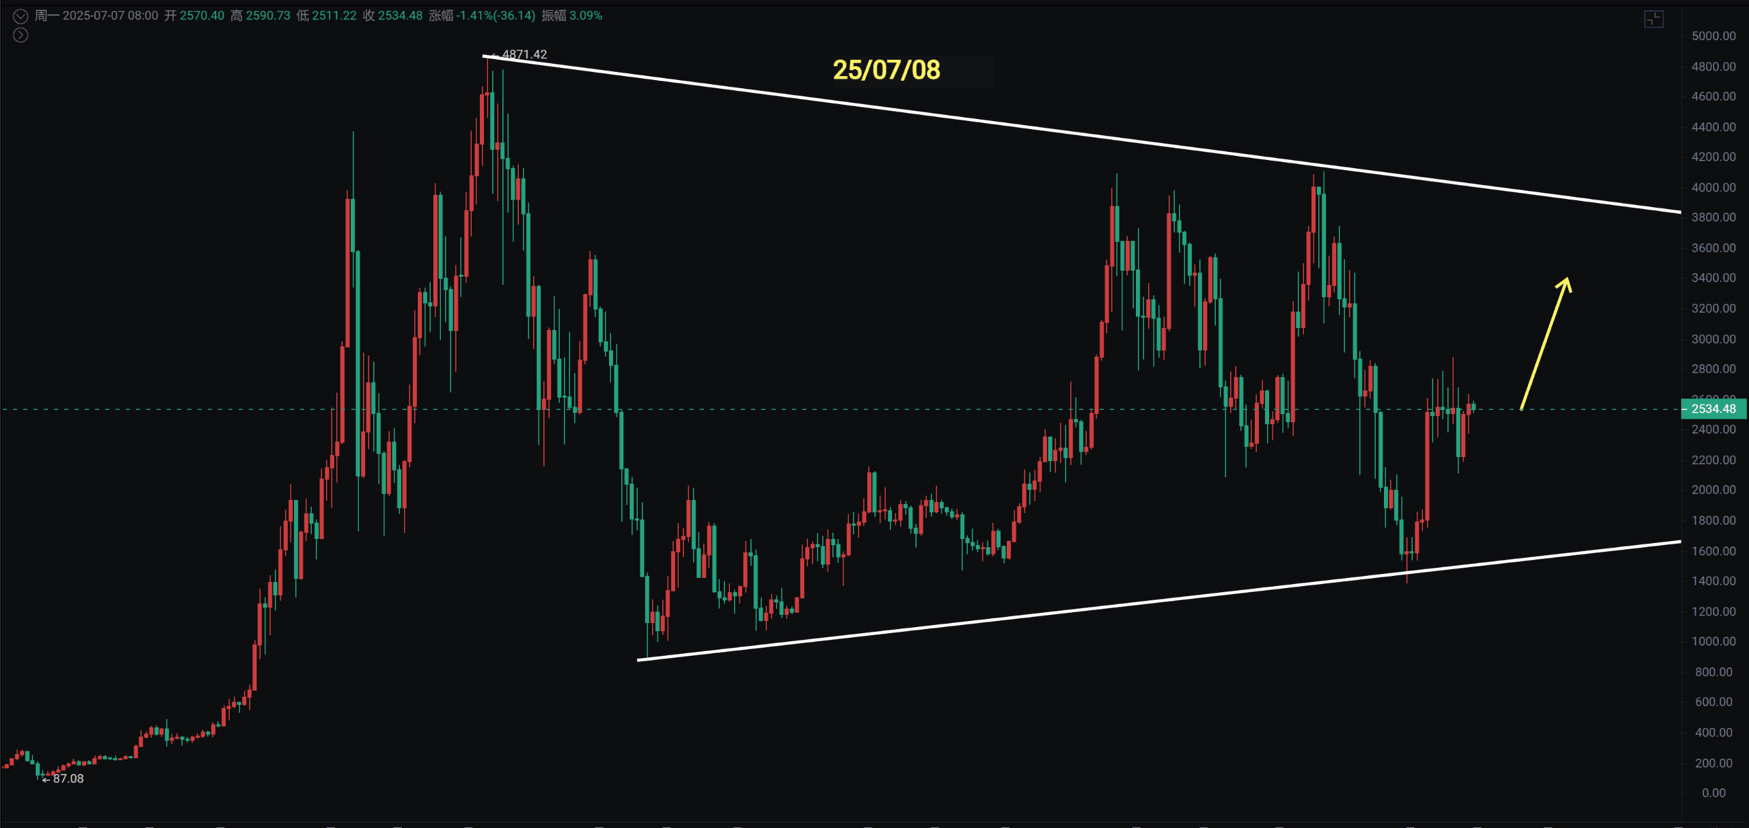
25/07/08 BTC oscillating at the upper edge of the flag, Ethereum stands above the three moving averages, about to welcome a surge.
BTC volatility has dropped to its lowest level since 2023, occurring only 7 times in history. Each time it reached these levels, volatility surged significantly within five weeks, often even faster. The recent market situation has stirred the hearts of countless traders; it's tasteless to hold but a pity to abandon, as we have approached the previous high. After reaching a maximum of 110500, only about 1500 points away from the previous high, it retraced to around 107000 for support.
Ethereum has returned above 2300 for box oscillation, with the weekly chart pulling back to the BOLL middle track and the Bollinger Bands narrowing. If Bitcoin lingers here for a long time, Ethereum may also need to consolidate for a period. It is noteworthy that in recent years, Ethereum has often surged after oscillating at the bottom for 2 to 3 months (the next video will focus on this analysis).
Bitcoin
✅ Flag breakout has been confirmed
✅ Structural pullback remains stable
✅ Momentum is building after the 3️⃣ wave
✅ Macro upward trend is intact
This trend may accelerate rapidly; the next stage of the bull market is unfolding.
The daily rising flag structure broke out and is currently oscillating near the upper edge of the flag. As long as it maintains above MA20 and MA60 on the daily chart, there is still a chance to break out. The current flag pullback here has similarities to last year's flag breakout pullback.
If the daily line is regarded as the first wave from 74500 to 112000, then the flag pattern as the second wave and breaking the previous high would be considered the third wave. Once the previous high is broken, a proportional rise to 135000 is expected.
Currently testing the critical support below 107000 at 105000, which is near MA20 and MA60 support. Only a break here will consider oscillating within the rising flag. The entire adjustment cycle would then closely match last year, and September and October still look promising.
Support: 105000 to 107000
Resistance: 109000 to 112000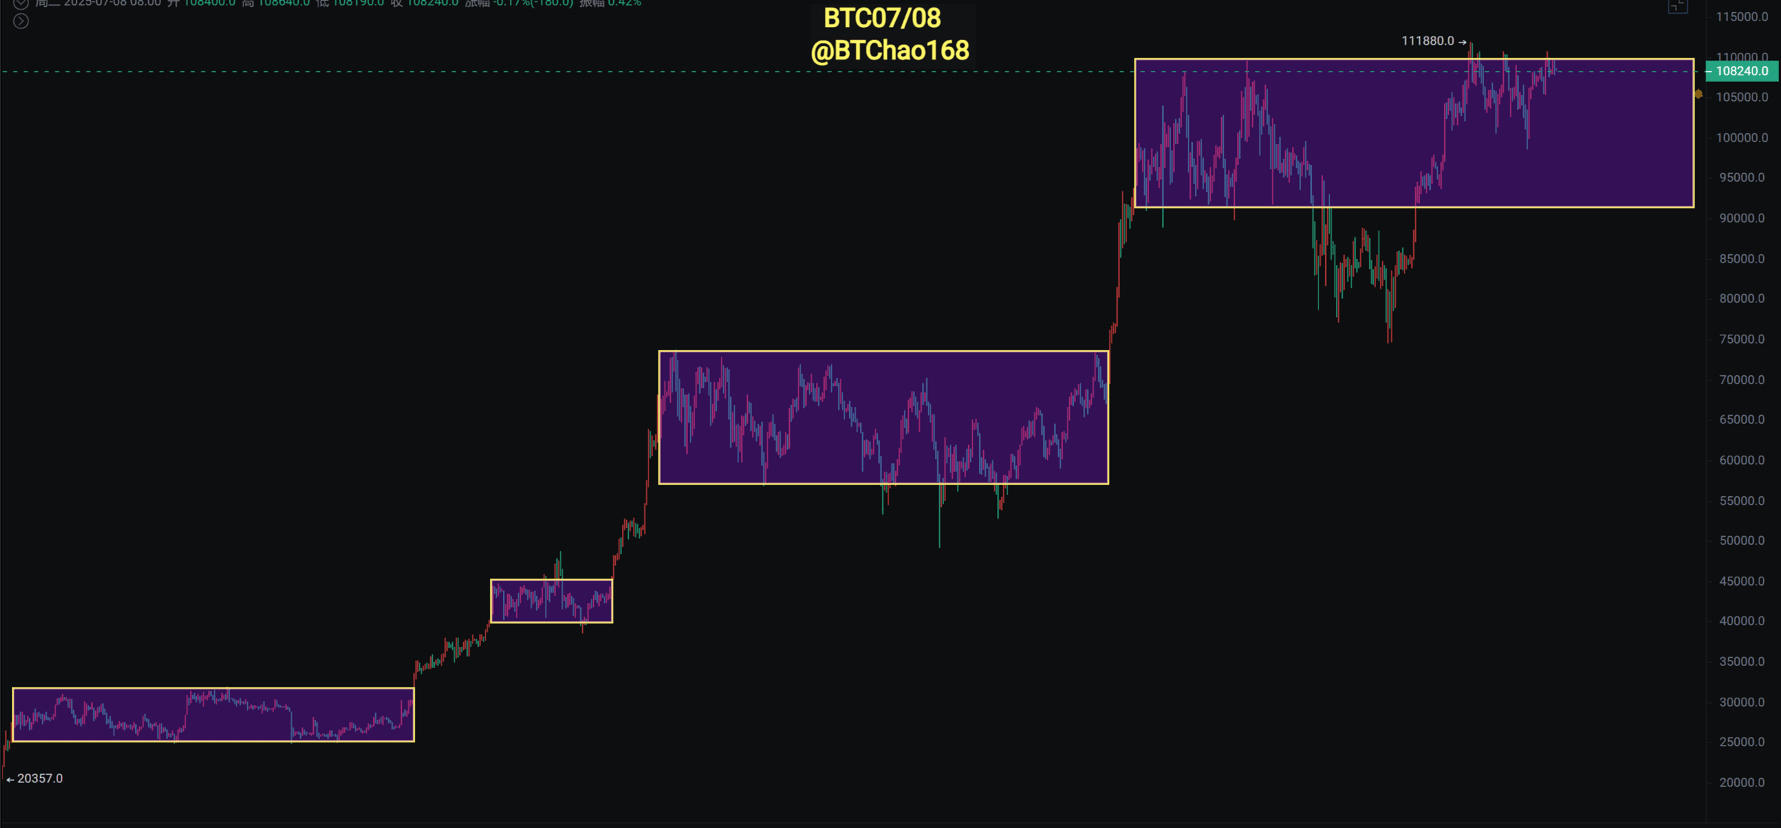
Ethereum
Ethereum doesn't have much to say; it basically follows the trend of Bitcoin. However, it's worth noting that Ethereum has often oscillated at the bottom for two to three months before moving in one direction over the past two years. Moreover, it has closed above the three moving averages on the daily chart. Therefore, first, we need to see if Bitcoin can effectively break through so that Ethereum can follow and experience a rebound. It has been oscillating between 2300 and 2700 for over 70 days, and this area's support is relatively strong. Even if there is a short-term pullback, the medium to long-term outlook remains bullish.
Support: 2300—2400
Resistance: 2700 to 2800