
The Fed remains passive, but the market actually 'wants to cut rates.'
On June 18, 2025, the Fed chose to keep interest rates unchanged at a target range of 4.25% to 4.5% during its monetary policy meeting. Everything seems calm and meets market expectations, but don't be fooled by appearances—after this meeting, market expectations for a rate cut in September soared to 71%!

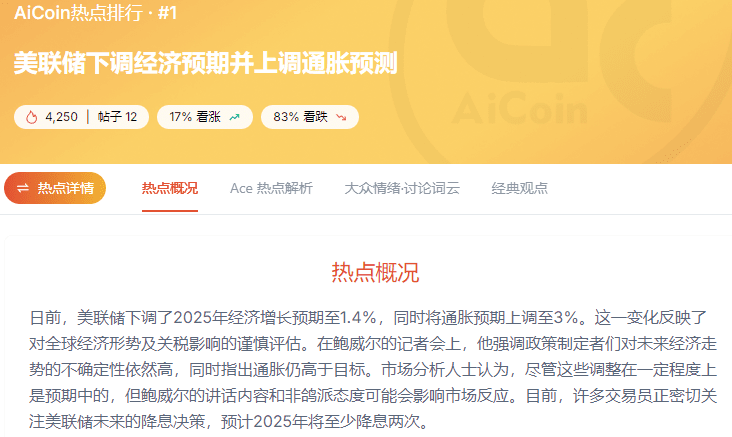
What does it mean? The Fed doesn't say, but the market has already 'visualized' the future easing scenario. Against this backdrop, the Fed itself has raised its inflation forecast (to 3%) and lowered its economic growth forecast (to 1.4%), while claiming there is no rush to cut rates yet presenting a stance that 'the economy may not hold up.'
Powell continued to play with 'ambiguous language' at the press conference: inflation is still high, the economy is still uncertain, 'we will closely monitor the data'—translated: they haven't figured it out yet, and market sentiment has stepped ahead.
BTC and ETH seem stable, but they are actually stuck in a 'waiting area.'

Bitcoin has recently stabilized around $104,000, and Ethereum is also moving sideways around $2,550. From the data, BTC's 30-day volatility is only 1.9%, and ETH is only 3.17%, both belonging to historically low ranges.
In other words: the price is moving, and the market is waiting.
The market is entering a 'stabilization period,' and this stability is not because everyone is bullish or bearish, but because large funds are waiting: Are they waiting for the Fed's next move? Or waiting for inflation data to continue softening? Or waiting for some black swan event to occur?
If you rashly chase after rises and falls at this moment, you may fall into a 'dilemma'—so we need to clarify a key question:
Is the current market 'brewing a new trend'? Or has it already 'laid flat and oscillated'?
Clarifying the market state is the first step in trading.
Why is it so important to judge the state of the market? Because the use case for strategies is completely different!
If you judge that the market has a trend, then what you should do is chase the trend, such as using MACD or moving averages to open positions in the direction of the trend;
But if you judge that the market is oscillating, then you should go against it, selling high and buying low, such as making mean reversion at the upper and lower bounds of the range.
The reality is that most of the time, the market is in an ambiguous state—when you use trend strategies, it suddenly turns back; when you want to do oscillation, it breaks out directly.
So you need a 'state scout,' which does not predict direction but tells you: which set of tactics you should use.
Chaos Index: Teach you how to judge whether 'stability' is real or fake
At this time, the Chaos Index (Choppiness Index) becomes our good helper. Its value ranges from 0 to 100, not telling you the direction of the rise or fall, but telling you whether the market is in a 'trending' or 'oscillating' state.

In simple terms:
If you see the chaos index above 61.8, it indicates the market is 'sideways,' suitable for oscillation;
If below 38.2, it is likely to have entered a 'trending' state, suitable for chasing trends;
And in the middle area, you need to combine other signals and observe.

To verify its reference value in the current market, I used AiCoin's custom indicator function to build and display the chaos index in real-time and overlaid it on the 1-hour candlestick chart for analysis.

In phase one, the chaos index was clearly close to the high value range of 61.8, with candlestick movements showing sideways consolidation, lacking a clear direction, and the market overall in a typical oscillation state.
Entering phase two, the chaos value quickly fell and oscillated around the low critical value of 32.8. At this time, we can clearly see that the candlestick broke the oscillation range, and trend characteristics began to show.
And now in the current phase three, the chaos index has risen again, approaching the 60 level—this means the market is likely back in a 'sideways' rhythm. Isn't this the 'stabilization period' we felt before!
Of course, it is worth emphasizing that the Chaos Index itself does not provide buy or sell signals, nor does it tell you whether to go long or short; its core function is to confirm the structural properties of the current market, thereby assisting us in choosing appropriate tools and strategies.
If you need to customize your own market judgment indicators, you can download AiCoin to try: https://www.aicoin.com/zh-Hans/features
Stable markets ≠ random operations; in the next article, we will discuss how to take action.
So to summarize: the current market seems calm, but it is actually in a state of macro uncertainty and technical compression. Whether it's stability with change or change hidden within stability, the most important thing is not to blindly apply strategies but to clarify what kind of market structure you are facing.
This is precisely the significance of the Chaos Index—helping us deconstruct structure, clarify direction, and lay a solid foundation for strategy selection.
As for what specific strategy to use? How to set stop losses reasonably?
—In our next article, we will discuss practical aspects relevant to the current market.

