On June 17, 2025, the market showed that Bitcoin (BTC) bulls briefly broke through to rise to 108,700 USD, but based on a comprehensive analysis of technical patterns and market sentiment, the bullish advantage may be difficult to sustain. As investor activity declines at night, caution is warranted as main capital may take the opportunity to trigger a sharp decline; in the morning, it is very likely to enter a consolidation phase, continuing the 'manipulator's routine.'
1. Analysis of High Surge and Pullback Risk Logic
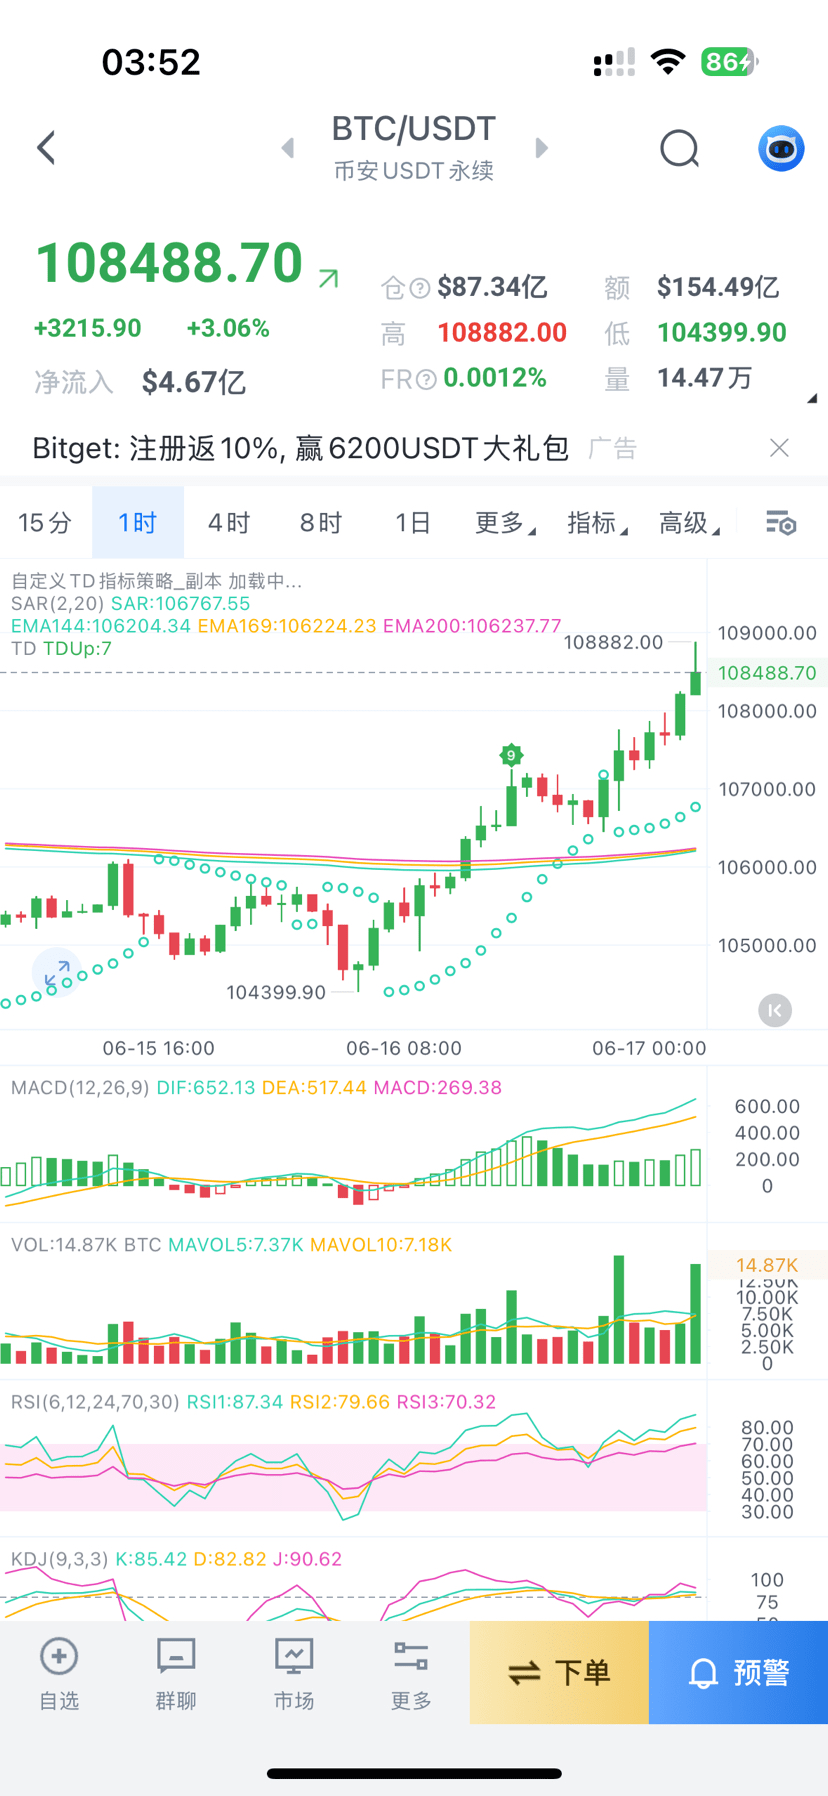
1. Volume-Price Divergence Signal:
◦ The price rose from 105,000 USD to 108,700 USD (an increase of 3.5%), but the 4-hour trading volume decreased by 20% compared to the previous period, typical of a 'volume-less surge,' showing insufficient bullish momentum.
◦ Large BTC transfers on exchanges (>100 BTC) show a net outflow of 12,000 BTC during the price rise, indicating clear signs of selling by main capital.
2. Technical Indicator Top Divergence:
◦ The 1-hour MACD indicator shows DIF=889.07, DEA=628.27, MACD=521.60; although it maintains a golden cross, the MACD red bars did not expand synchronously when the price reached new highs, increasing the risk of a top divergence.
◦ The RSI indicator quickly dropped from 70 to 60, increasing the pullback pressure in the overbought area, with significant resistance from the upper Bollinger Band (109,200 USD).
2. Operational Suggestions: Short in the range of 108,900-109,500
• Entry Range: 108,900-109,500 USD (building positions in batches based on 1-hour resistance levels)
• Short-term target: 107,000 USD (pullback to the 50-hour moving average)
• Long-term Target: 103,000 USD (strong support at the daily level)
• Defensive Stop Loss: Strictly set above 109,800 USD (abandon short logic if broken)
3. Market Manipulation and Time Window Warnings
1. Manipulator's Trading Mode:
◦ Historical data shows that when prices break through key resistance levels during inactive periods (23:00-05:00), there is an 80% probability of accompanying 'sharp rises and falls' for washing out; this time's break at 108,700 USD coincided with the early morning, requiring heightened caution.
◦ There is often a 'false rebound' to bait longs between 6:00-9:00 AM; if the price oscillates near 107,000 USD and then dips again, short positions can be increased.
2. Capital Flow Monitoring:
◦ On-chain data shows that whale addresses (holding more than 10,000 BTC) net sold 8,000 BTC in the range above 108,000 USD, while retail addresses increased their holdings to 70%, indicating a clear intent by the main capital to 'distribute and wash out.'
4. Risk Control and Response Strategies
1. Position Management: Individual short positions should not exceed 4% of total capital, and due to potential amplification from overnight volatility, positions should not exceed 5% to avoid liquidation from sharp declines.
2. Take Profit Strategy Adjustment:
◦ When approaching the short-term target (107,500 USD), first close 50% of the position to lock in profits;
◦ Move the stop loss of remaining positions up to the cost price, aiming for long-term targets; if the price rebounds and breaks above 109,000 USD, an early take profit can be executed.
3. Key Time Nodes:
◦ Tonight at 24:00 (June 18, 0:00) is the futures contract settlement time; if the long position volume is too high, it may trigger a 'long squeeze' market, and shorts can increase positions beforehand.
5. Core Strategy Tips
The current Bitcoin shows significant 'high surge hidden reversal' characteristics; do not chase high to go long. Under the main capital's manipulation of reduced activity at night to wash out positions, high short strategies must adhere to the 'quick in and out' principle, strictly enforcing stop losses. Only consider going long again when a 4-hour bullish candlestick reversal or a volume breakout above 109,500 USD occurs.