Since June 5, the price of Bitcoin has rapidly rebounded from $100,000, and on June 9, it approached $110,000 again, just a step away from the previous high. This price performance ignited short-term market sentiment, but has the support at the capital level strengthened in sync? Through the RMMPC funding source map, we can glimpse the true structure of this rebound.
According to the latest data (Figure 1), funding in the US (blue line) and Europe (yellow line) has grown in sync, clearly indicating that they are the main forces driving BTC prices upward this time. Meanwhile, funding performance in Asia continues to decline (the red line is dropping), showing that Asian players have chosen to observe or exit during this rebound.
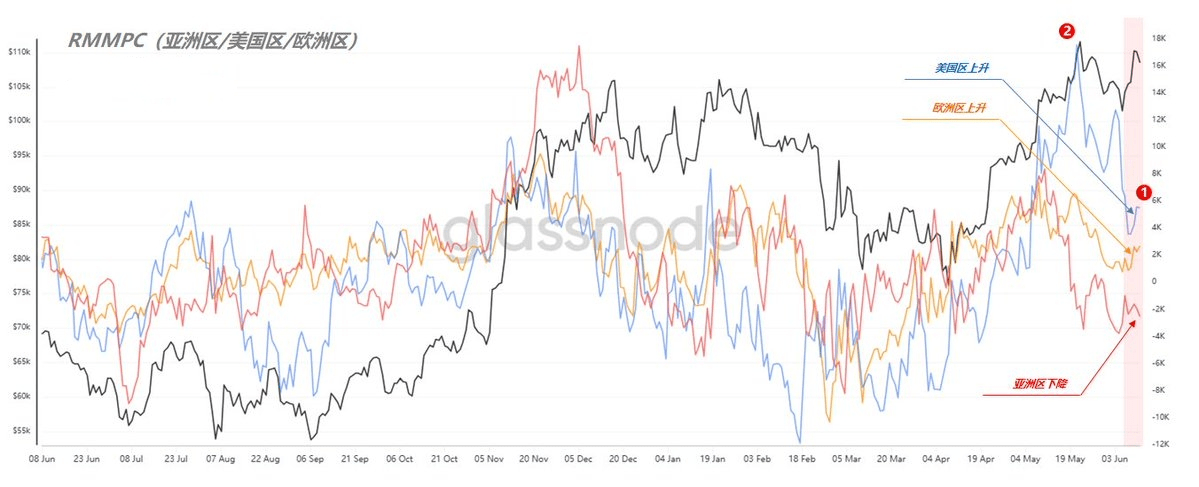
(Figure 1)
Despite the strong price trend, the funding curve implies a hint of concern. Comparing the peak corresponding to the previous high point with the current level of funding enthusiasm in the US and Europe (Label 1) shows that it is far below the previous levels at similar price points (Label 2). In other words, the funding sentiment has not risen in sync with the price, indicating that there is a certain 'overvaluation' behind the push.
If we isolate the US funding curve, its historical performance reveals a pattern: whenever the blue line shows a rapid decline, it often indicates that US funds are gradually withdrawing their push on prices, which is often followed by a phase of price weakness. I have marked similar phases in red shading in the figure. In the past, in such situations, Asian funds would often step in to support the price, but this time the situation is different.
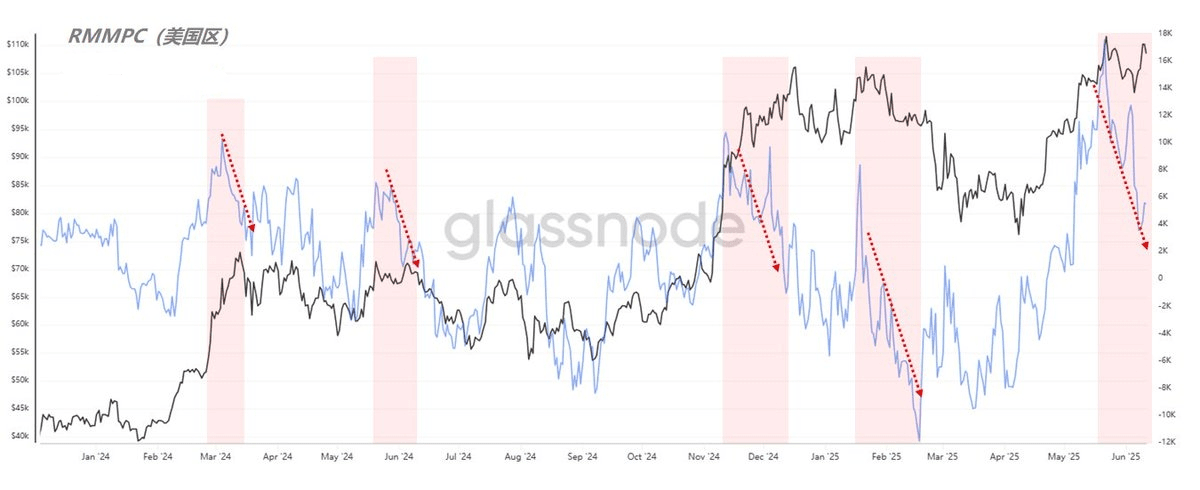
(Figure 2)
During this rebound, Asian funds not only did not enter the market but instead chose to observe or even exit. This imbalance in funding structure may lay the groundwork for risks in subsequent trends.
