

Amid a crypto market recovering bullish momentum after months of consolidation, XRP is back on the radar of institutional investors.
The legal conflict between Ripple Labs and the SEC has entered its final phase, and analysts anticipate a resolution that could unleash a wave of capital into the XRP ecosystem. In this scenario, many wonder if the coin will be able to surpass its all-time high, following in Bitcoin's footsteps.
XRP analysis on indicators
The daily chart indicates a clear change in character structure (CHoCH), with the break of the sequence of lower highs and lows after the price reached the demand zone around $1.80.
Subsequently, XRP recorded a new higher low (HL), reinforcing the possibility of a bullish trend forming. Currently, the value fluctuates between $2.30 and $2.60, just below a significant supply zone.
 Price analysis of XRP. Source: TradingView
If the price can strongly break through the supply zone near $2.80, the next immediate target will be the psychological resistance at $3.00, followed by the level of $3.40, which corresponds to the last major distribution structure.
Volume began to grow, which could support a new bullish movement. A daily close above $2.80 would confirm this setup.
However, if XRP fails to overcome the supply zone and retreats below $2.20, the coin may seek support again between $1.80 and $2.00. Losing this range would open up space for a sharper decline towards $1.50, resuming the bearish structure observed in previous months.
Weekly outlook for XRP
On the weekly chart, a bullish breakout is observed from a descending channel that limited the price in recent months. XRP broke the downtrend line with a consistent candle, signaling a potential trend reversal.
Moreover, the quotation remains above the dynamic support, and a Fibonacci projection indicates targets at $3.07, $3.41, and $3.89.
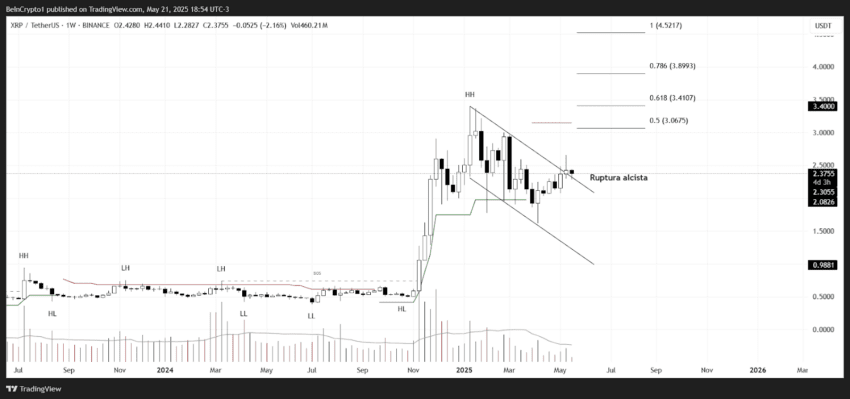 Price analysis of XRP. Source: TradingView
If the momentum holds, XRP could advance to the Fibonacci level of 0.618 at $3.41, a point that coincides with key liquidity zones and technical confluence. Overcoming this resistance would significantly increase the chance of hitting a new all-time high above $4.00.
If the bullish breakout proves to be a false signal (fakeout) and the price retreats below the support at $2.30, the coin may return to the previous descending channel, possibly retreating to $2.00 or less.
On-chain analysis of XRP
In the last quarter, XRP showed mixed signals in its on-chain metrics. Active address activity recorded moderate growth, while transfer volumes remained stable.
On the other hand, reserves on exchanges have slightly decreased, which is typically interpreted as a positive indicator.
The Coinglass chart reveals a significant concentration of sell orders in the $2.45 and $2.50 regions, while support is identified at $2.30, with emphasis on the zone at $2.25.
The presence of passive orders at both extremes indicates that XRP is in a defining area. A liquidity sweep below $2.30, followed by recovery, may signal institutional entry.
After all, can XRP reach a new high in the short term?
In conclusion, XRP is going through a decisive moment. From a technical standpoint, the asset shows signs of trend reversal on the daily and weekly charts, driven by a relevant breakout and institutional support. On-chain conditions remain neutral to slightly positive.
If Ripple obtains a favorable ruling in the lawsuit against the SEC and the crypto market continues to rise, there is a concrete possibility for XRP to reach and exceed $4.00 in the third quarter. However, it will be crucial to monitor volume in resistance zones and the market's response to new regulatory developments.
The article After Bitcoin, is it possible for XRP to hit its all-time high? was first seen on BeInCrypto Brazil.

