1. Core Assessment of Short-Term Trend
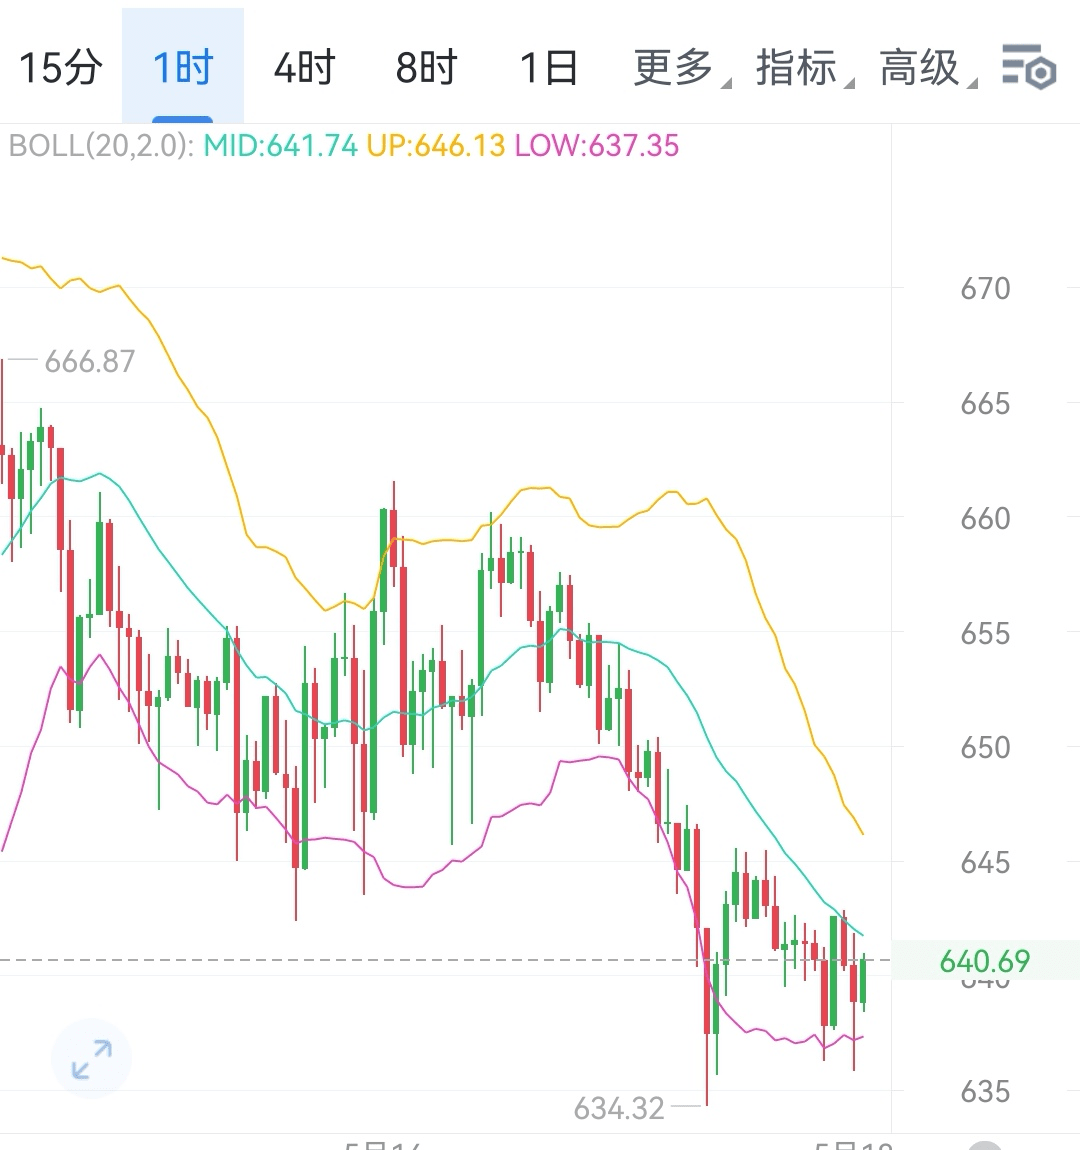
Tonight, the focus of the BNB market's trend is concentrated on the key price level of 642.9, and its performance in the 1 - 2 hour candlestick chart will become the core basis for judging whether a short-term rebound can start.
- Bullish Confirmation Signal: If the 1 - 2 hour candlestick effectively stabilizes above 642.9, and the subsequent two cycles continue to close above this price level, it indicates strong momentum for a small-scale rebound, and the market is expected to reverse the current weak pattern, starting a new upward trend, with bullish forces gradually taking control of the market rhythm.
- Bearish Warning Signal: Conversely, if the BNB price cannot consistently hold above 642.9 at the 1 - 2 hour level, it indicates that the rebound lacks effective support, and bearish forces still dominate, making it likely that the market continues in a pullback phase.
2. Distribution of Key Levels and Strategy Reference
(1) Upward Pressure Levels
1. First Resistance Level: 646.5
- Technical Features: This position is at the upper edge of the previous price consolidation range, where a large number of trapped positions and profit-taking positions are concentrated. When the BNB price rises to this level, the dual selling pressure will directly hinder short-term gains, making it the primary barrier the bulls need to break through.
2. Mid-term Pressure Level: 650
- Technical Features: Located in the overlapping area of key moving average resistance zones and important Fibonacci resistance levels, this point strongly suppresses price upward movements. To achieve an effective breakthrough, sufficient buying capital is required, along with a shift in overall market sentiment towards optimism.
3. Trend Breakthrough Level: 654.7
- Technical Features: Once the BNB price successfully stabilizes at this point, it will confirm its entry into a new upward channel, and the subsequent upward space is expected to be significantly opened, indicating that a new round of strong upward momentum is about to begin.
(2) Downward Support Levels
If the 1 - 2 hour level fails to stabilize above 642.9, it is expected to trigger a new round of pullback, with support levels below being:
1. Primary Support Level: 636.3
- Technical Features: Formed by the convergence of short-term moving averages, providing support, and also an important psychological barrier tested multiple times in the past, it can cushion the impact of bearish pressure to some extent.
2. Secondary Support Level: 631.5
- Technical Features: As a strong support level formed by the previous price low, if this level is lost, market panic may spread rapidly, leading to larger-scale selling and causing the price to accelerate downward.
3. Strong Support Level: 627.5
- Technical Features: This point is located in the area of convergence of multiple cycle moving averages and is a key strategic position for both bulls and bears. Its loss or gain directly affects the subsequent medium to long-term trend of BNB. Once it breaks down, it may trigger a deep pullback.
3. Summary
The core of BNB's short-term trend lies in the tug-of-war at the 642.9 level. If the price stabilizes effectively above this position, the bulls may challenge the resistance in the 646.5 - 654.7 range; if it cannot hold, one must be cautious of the risk of a price pullback to the 636.3 - 627.5 area. The volatility is intense and full of uncertainty, so it is advised to closely monitor the 1 - 2 hour candlestick patterns and strictly implement stop-loss and take-profit strategies, while reasonably controlling positions.$BNB #BNB走势