1. Core assessment of short-term trends
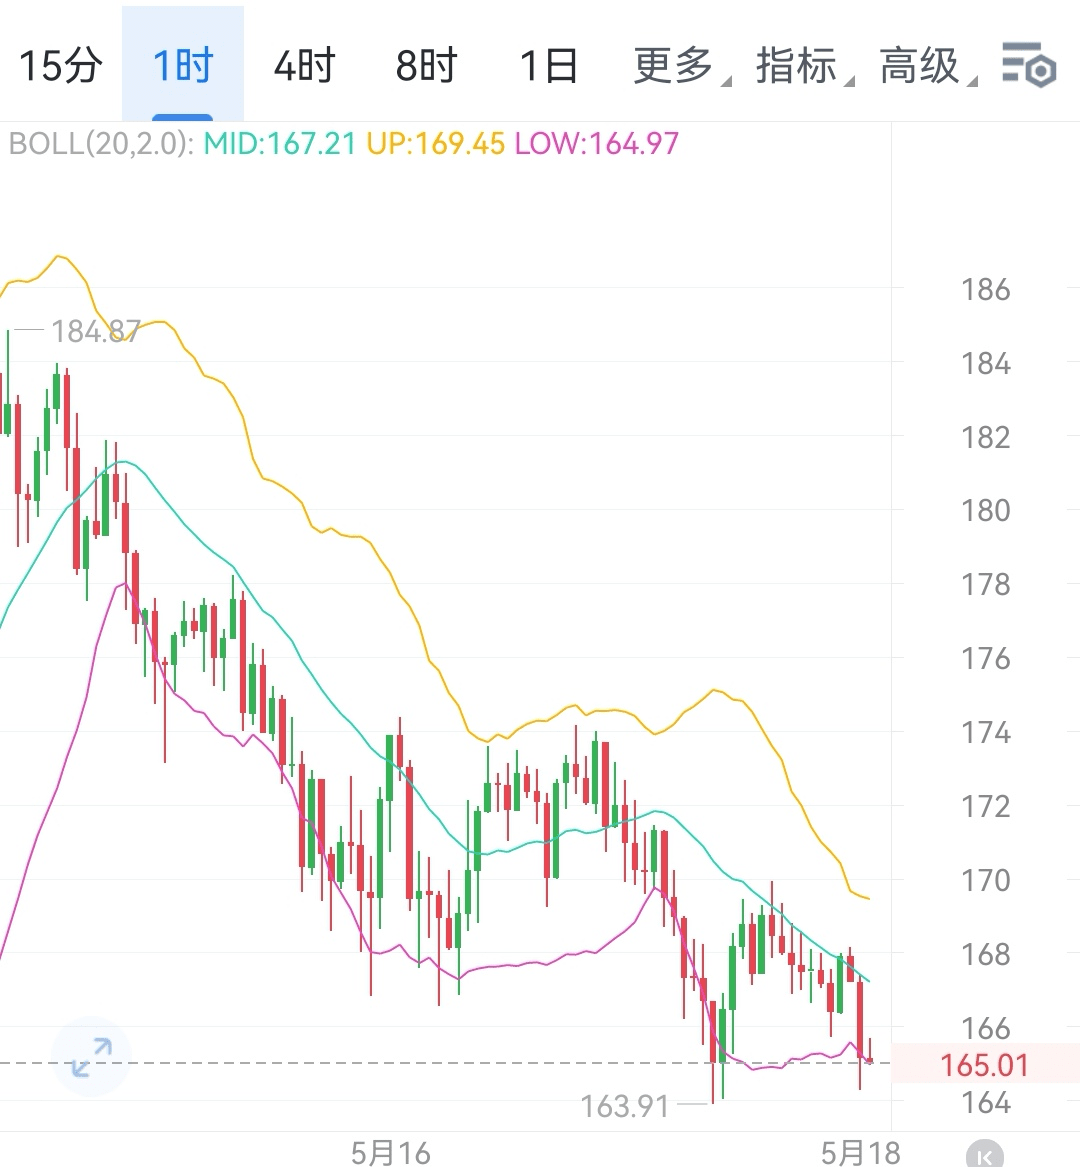
Tonight, the key focus of the SOL market trend is on the price level of 167.8. The performance of this level in the 1 - 2 hour K-line chart will become an important basis for judging whether a short-term rebound can begin.
- Bullish confirmation signal: If the 1 - 2 hour K-line can effectively stabilize above 167.8, and subsequently maintain above this price level for two consecutive periods, it indicates that bullish forces in the market are beginning to accumulate, with sufficient momentum for a small-scale rebound, likely pushing SOL to initiate a new upward trend, with bulls gradually dominating the market rhythm.
- Bearish warning signal: Conversely, if SOL price cannot stay above 167.8 in the 1 - 2 hour level, it indicates that the current rebound lacks effective support, and bearish forces still hold the upper hand, making it likely that the market will continue its pullback trend and remain in a state of adjustment.
2. Key point distribution and strategy reference
(1) Upward pressure level
1. First resistance level: 170
- Technical characteristics: This position is the upper edge of the previous price fluctuation range, where there are a large number of trapped positions. When SOL price rises to this level, the dual selling pressure from profit-taking and liquidation will create a primary obstacle to short-term upward movement.
2. Mid-term pressure level: 174
- Technical characteristics: This position coincides with an important moving average resistance area and key Fibonacci resistance level. To achieve an effective breakthrough, strong buying support is needed, along with a significant warming of market sentiment.
3. Trend breakthrough level: 178
- Technical characteristics: If SOL price successfully stabilizes at this level, it will confirm its entry into a new upward channel, and subsequent upward space is expected to significantly expand, initiating a new round of strong upward trends.
(2) Downward support level
If the 1 - 2 hour level cannot stabilize above 167.8, a new round of pullback is expected, with support levels as follows:
1. Primary support level: 164.3
- Technical characteristics: Support formed by the convergence of short-term moving averages, which is also an important psychological level tested multiple times in the past, can buffer the impact of bearish movements to a certain extent.
2. Secondary support level: 161.1
- Technical characteristics: As a strong support level formed by previous price lows, once broken, bearish sentiment in the market may quickly spread, triggering larger-scale selling behaviors.
3. Strong support level: 158.5
- Technical characteristics: This level is located in the support area of multiple cycle moving averages and is a key battleground for both bulls and bears. Its gain or loss directly affects the subsequent medium to long-term trend of SOL. Once breached, it may trigger a deep correction.
3. Summary
The core of SOL's short-term trend lies in the tug-of-war between bulls and bears at the 167.8 level. If the price can effectively stabilize above this position, bulls are expected to challenge the resistance between 170 - 178; if it cannot stabilize, attention should be paid to the risk of the price pulling back to the 164.3 - 158.5 area. The volatility is intense and full of uncertainty, so it is recommended to closely monitor changes in the 1 - 2 hour K-line patterns, strictly implement stop-loss and take-profit strategies, and control positions reasonably.$SOL #SOL走势