Daily sharing
Current situation of the market this week:
After Bitcoin's surge to 105819, it no longer continued to rise but instead initiated a series of pullbacks. This pullback is mainly characterized by an up-and-down oscillation, with the oscillation range being 100700~105000. The oscillation pattern is mainly triangular convergence, with high points decreasing and low points increasing. A central oscillation is currently taking place here, waiting for the final directional choice.
If it continues to surge upward, it will continue to extend the 4H level rebound. Currently, it is in the third 1H central oscillation of the 4H level rebound, and a subsequent central departure phase is needed for the upward movement.
If it breaks downward, it indicates that the short-term has started a 4H level correction. This pullback may still require some time, and it is very likely that the short-term will experience a slightly larger drop to wash out positions. The amplitude at the 100,000 mark is still insufficient to meet the demand for a 4H level correction.
Now let's talk about Ethereum and altcoins:
On the third day after Bitcoin's high and pullback, Ethereum surged to 2738, slightly lagging behind Bitcoin's pace. Currently, it is also in a pullback state, but it is still uncertain whether it is a 4H level correction, and we need to observe the price situation below, as well as the direction of Bitcoin. Altcoins have also started to enter a short-term correction after Bitcoin and Ethereum surged in the past two days. As before, the drop is still significant, with some coins experiencing a halving from their peak. This indicates that the current altcoins are still in a state of not being resistant to declines.
About trading:
So-called market prediction is essentially just guessing the market, because we cannot control the direction of the market ourselves, so we can only speculate whether the market will rise or fall.
On what basis do you speculate the market direction? Everyone has their own methods. Zhang San predicts through macro fundamentals, Li Si predicts through historical experience, Wang Wu through wave theory, Ding Liu through the theory of intraday trading, Xiao Qi through feedback from indicators, etc.
However, not all market trends can be precisely predicted. When the trend is strongly patterned, trading is easier because predictions are more accurate. When the trend is weakly patterned, and it can go either way, predicting the market becomes very difficult.
The recent short-term trend is like this; on one hand, we need to consider whether Bitcoin has started a 4-hour level correction, and on the other hand, we need to see if it can really not drop and extend further.
Some people ask, can't we just not predict? Although it is said that the theory of intraday trading classifies trends completely, predicting without measuring. However, when placing an order, whether to go long or short, one still has to choose a direction, ultimately returning to the prediction of the market. Why are you going long? Is the buying point you see really a true buying point? From the moment you decide to place an order in a certain direction, you are already predicting the market. What if your prediction is wrong? You can only rely on stop-loss to save yourself, or wait and see until the trend has higher certainty before making a prediction.
BTC
Due to the rapid changes in the market, the article can only provide predictive assessments based on the market changes at the moment of publication. Short-term players should pay attention to the latest market changes, which can only serve as references.
1H:
Is the current structure at the 1H level very chaotic and complex?
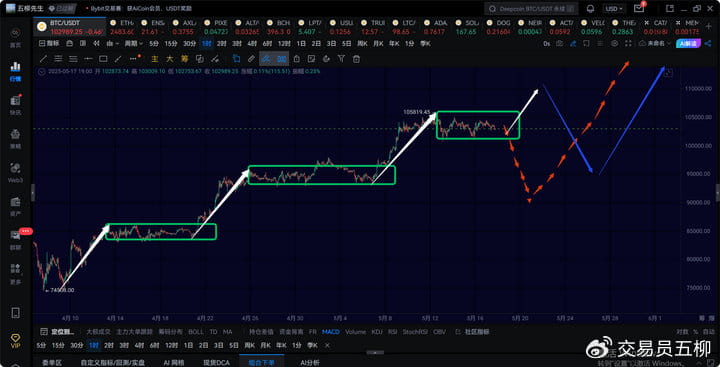
The actual structure is not complex; it is currently constructing the third 1H level central point. Starting from 74500, the first 1H level central point is mainly in the 83000~86000 range, as indicated by the green box at the bottom of the above image. The second 1H level central point is mainly in the 93000~96000 range, represented by the middle green box in the above image. Currently, it is forming the third 1H level central point, primarily in the 101000~105000 range.
The difficulty lies in judging the direction after the central point construction is completed.
Theoretically, after the construction of the third central point is completed, there should be a central departure phase surge to the range of 108000~115000, provided that the current price does not break below 101000. After that, we will begin the second part of the 4H level correction and the third part of the 4H level rebound during the daily rebound, as shown by the blue arrow after the white arrow in the above diagram.
If the short-term drops below 101000 again, or even below 100700, then we are already in the second part of a 4H level correction during the daily rebound, and the correction will likely require at least another week or so, after which we will start the third part of the 4H level rebound, as indicated by the red dashed arrow in the above diagram.
15M:
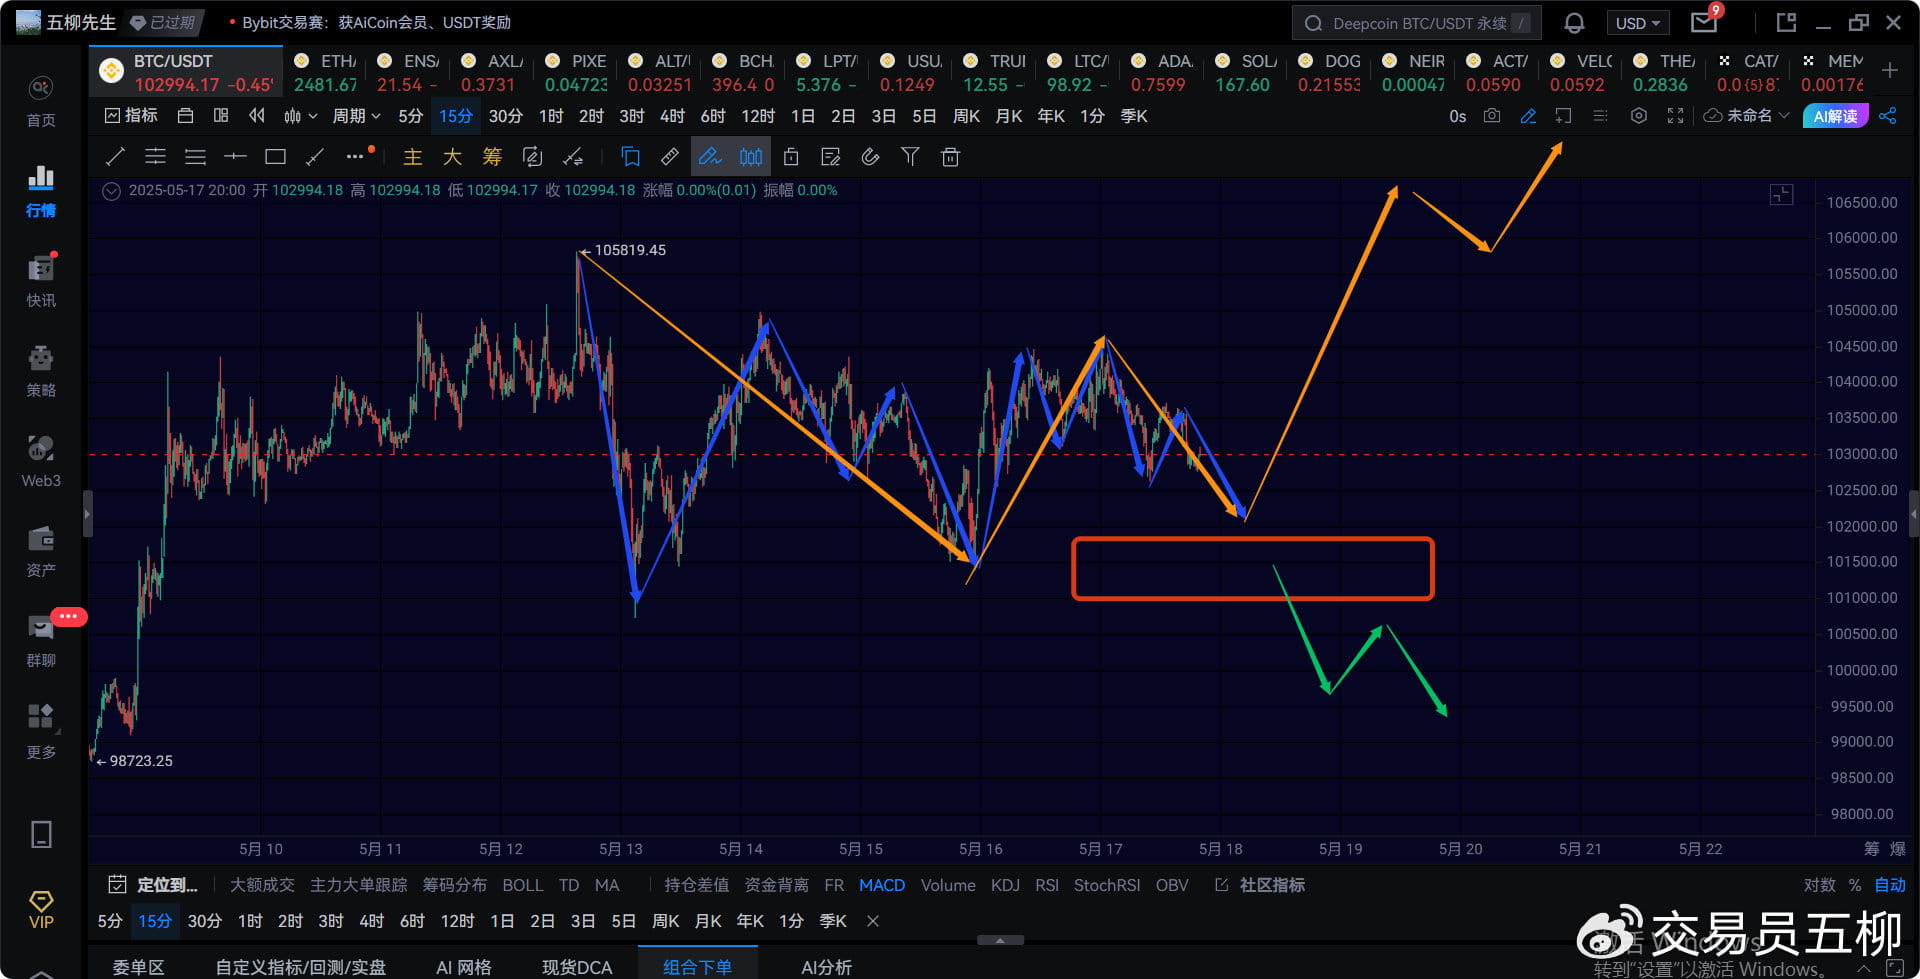
At the 15-minute level, we should currently be in a 1H level pullback, specifically the 1H level pullback that started yesterday at 104550. It is currently likely the third 15-minute level drop, and the short term should still be able to drop a bit further. Focus on the area around 101000; if it doesn't break this position for a while, it is very likely to choose the direction to break up, starting a surge in the 1H level central departure phase to go above 107000.
If the short-term 15-minute level drop breaks below 101000, it can basically be seen as a 4H level correction.
Currently, I personally tend to believe that after this consolidation, it will ultimately break upward, so the focus will be on the support situation below.
ETH
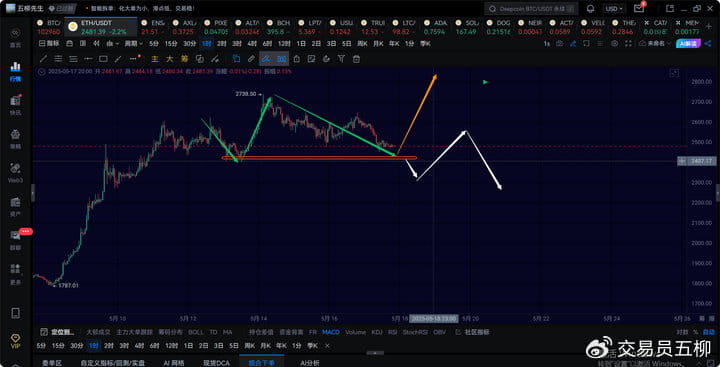
Ethereum did not manage to achieve a 1H level rebound yesterday and has once again dropped below 2500 today, indicating that it is still continuing the 1H level drop that began from 2738. If we consider 101000 for Bitcoin as the critical point to determine whether to continue rising or enter a 4H level correction, then 2400 below for Ethereum should be the key point for whether it is in a 4H level correction. If it also breaks below 2400, then we will be looking at a 4H level correction in the short term; if not broken, we may continue to push upward towards 2800 for a rebound extension.
ps: Previously considering 2500 as the critical point for whether Ethereum is in a 4H level correction was actually somewhat inaccurate, because the lower central point in 1H is around 2400.
Trend direction
Weekly level: Direction is upward, currently forming a new weekly upward trend, with an overall target looking at above 150,000.
Daily level: Direction is upward, currently in a daily rebound, this daily rise has a probability of continuing to create historical highs.
4-hour level: Direction is upward, the 4H level correction is still uncertain; it will continue to extend upward until it breaks 101000.
1-hour level: Direction is downward, watching the strength of the 1H level pullback here; if it does not break 101000, there is still a chance to continue upward.
15-minute level: Direction is downward, watching the strength of the 15-minute level pullback.


